Fig. 4.1
Scheme of IHC: (a) direct visualisation (usually with fluorescent dye); (b) normal AP technique; (c) APAAP and ABC technique with multiple visualisation dyes
The bound antibodies can be visualised by two different techniques: (a) by a secondary immune complex that recognises the (biotin) labelled antibody or (b) by a fluorescent signal that is released either directly (bound to the antibody) or indirectly (by a secondary fluorescent labelled antibody directed to a so-called linker molecule (biotin)) [11–14]. An enhancement of the indirect (two step method) has been developed in adding a third layer of antibodies to the second layer (first antibody) that are labelled with two (or more) visualisation molecules (so-called APAAP technique). Today, most laboratories use the avidin/streptavidin-biotin technique, because streptavidin and avidin possess strong binding capacities for biotin (ABC technique). These molecules can be labelled with several enzyme reaction molecules. The sensitivity of the antigen–antibody reaction is enhanced for about 6–10 times using this technology [10].
It is important to distinguish between the two visualisation techniques as they follow different natural laws of light propagation: Conventional transmission light microscopy uses the absorption of light induced by the applied stains. Conventional IHC visualises the antibodies in brown (DAB) or red (AP) or black (silver) colours. The intensity of these stains decreases logarithmically in relation to the molecules’ (antibody) density which is automatically corrected by the human eye [15]. Therefore, human-based light absorbance evaluation disregards the logarithmic law. This feature has to be taken into account when quantitative measurements are undertaken [16]. On the other hand, fluorescent signals are linear related to the signal density and do not require a logarithmic “correction”.
Tissue Microarrays
The significant frequency of IHC application in addition to the numerous available antibodies has forced the intensive search for more efficient histological techniques as just to apply one antibody to one glass slide. The result is the development of arrays which are pre-prepared matrices of small tissue punches that can be analysed with a broad number of different antibodies at the same time [17, 18]. An example of such an arrangement is shown in Fig. 4.2. An exemplarily tissue cut is analysed microscopically, and the corresponding areas of the associated tissue block are punched out and embedded in a new tissue block in a matrix-like arrangement. Such tissue microarrays (TMA) can contain up to several hundred punches, which might be obtained either from the same tumour (and then be exposed to a set of different probes) or from a series of different tumours (and then be exposed to the same probe) [19–22].
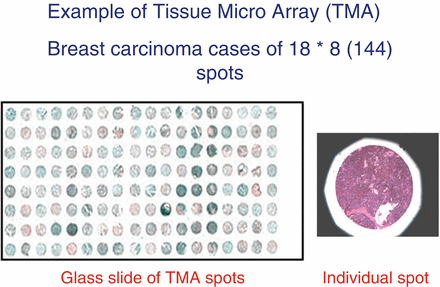
Fig. 4.2
Example of a TMA with 144 tissue spots of a breast carcinoma
The probes can differ, and include antibodies applicable in IHC, DNA, or RNA segments applicable in hybridisation or PCR, or other molecular genetic methods.
The analysis of TMA requires an automated or at least semi-automated measurement of the signals, followed by detailed statistics. An open question remains as the issue of disease heterogeneity combined with the small size of the analysed probes has not been solved to our knowledge [18–20, 22–24]. The smaller the size of the examined tissue, the more it is subject for individual alterations within the lesion which might be of significance for the individual patient; however, it might not reflect to a more generalised classification, development, or therapeutic response.
Tissue-Based Diagnosis and Types of Diagnoses
There is no doubt that surgical pathology is the medical diagnostic technique with the highest diagnostic accuracy in terms of sensitivity and specificity [25, 26]. The mentioned high intra- and inter-observer discrepancies are usually related to highly differentiated morphological patterns and do not possess any or only weak clinical, i.e. therapeutic impact [27–33]. They reflect to the broad variance of morphological appearance in most of the living systems, at least in histology [34–36]. The relationship of morphology to functional properties such as occurrence of malignant growth is only crudely understood in our opinion.
Despite this constraint, morphologically based diagnoses have been proven to be a solid basis in several diseases such as cancer or specific infections (tuberculosis etc.). These diagnoses are derived from conventionally stained (H&E) slides, and are called conventional diagnosis [37–39]. As shown in Fig. 4.3, at least four different “subtypes” of tissue-based diagnosis (judged from surgical pathology specimens) can be distinguished. In addition to the conventional diagnosis, specific commonly IHC founded diagnoses can be histologically derived from surgical specimens. They can be associated with the patient’s diagnosis, and are called prognostic diagnoses. IHC can visualise cellular and functional properties such as percentage of proliferating tumour cells, expression of factors that induce/promote vascularisation, and other properties that might obviously be of influence on tumour propagation and metastasis. An example of such a constellation is depicted in Fig. 4.4. The therapeutic ill-defined Her2-neu score of 2+ in breast carcinomas can be further refined by entropy analysis.
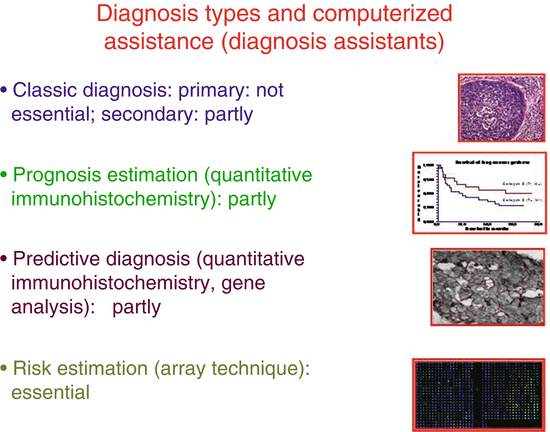
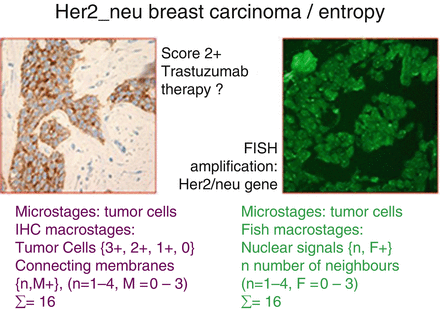
Fig. 4.3
Survey of the different diagnosis types
Fig. 4.4
IHC of the herceptin receptor , the corresponding FISH signals, and entropy calculations in respect of micro- and macrostages
Whereas prognostic diagnoses are obtained from IHC analyses of extracellular and intercellular (structural) features, predictive diagnoses are based upon the investigations of associated intracellular pathways. The most frequently analysed pathways are related to the expression of the epidermal growth factor receptor (EGFR), a molecule that can promote growth-related genes (oncogenes) via specific associated genes (kras, etc.). A generally accepted model of some of these pathways is shown in Fig. 4.5 (after [40]). The blocking of the EGFR by use of specific antibodies will only work if the intracellular pathways (and their genes) are not altered, i.e. the obtained constellation is of predictive value for potential therapies.
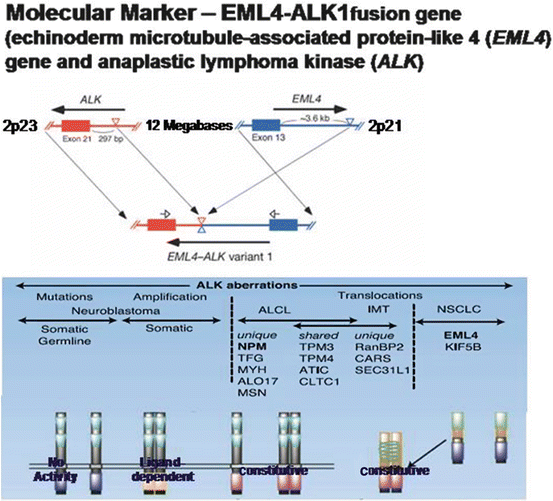
Fig. 4.5
Scheme of EML4-ALK1 fusion gene and the associated protein expression. Soda et al. Nature. 2007;448:561–7 [40]
The described IHC (and molecular genetic applications such as PCR, DNA sequencing, etc.) are all applied to detect diseases, i.e. once the cancer, infection, or inflammation became manifest. The last kind of disease diagnosis is the risk estimation diagnosis, which describes the risk of a population to develop a certain disease. An example of such a diagnosis is the expression of the BRCA1 (2) gene in women associated with the (increased) risk of breast cancer [41–43].
With the exception of the classic diagnosis, all other diagnosis types require at least some semi-quantitative (scores) if not a complete quantification of the visualised signals (see Fig. 4.3).
Basics of Image Analysis
Images are one important source of medical information. These include whole body live imaging (X-rays, computerised technology (CT), nuclear resonance imaging (NMR), radio-isotopes, ultrasound, and others. Radiological images provide the clinician with information about the extension of a suggested disease in contrast to tissue-based diagnosis which is mainly dealing with its (detailed) nature (diagnosis). The general procedure on how to obtain a tissue-based diagnosis is shown in Fig. 4.6. Biopsies precede the analysis of surgical specimen, and a quality evaluation of the surgical treatment (usual analysis of resection boundaries) adds to the establishment of tissue-based diagnosis [44].
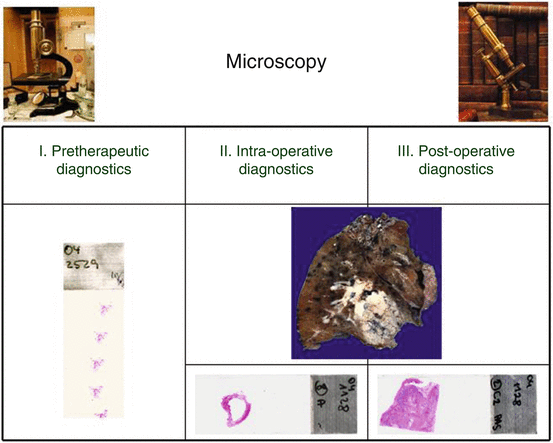
Fig. 4.6
Diagnoses and therapy-associated with different schedules of tissue-based diagnosis
Principles of Microscopic Image Analysis
Each digitised image consists of a matrix of grey values (pixels) distributed on three colour dimensions (most frequently in red, green, blue (rgb)) axes. Thus, the information mapped on this three-dimensional colour space is a function of the grey values in principle. The information acquisition by any viewer (pathologist) can be formulated by a function that transfers the grey value distribution to the analysing pathologist and depends in addition upon the pathologist’s knowledge and interpretation. Interpretation requires in addition the detection and identification of objects, which represent the “external” knowledge. At light microscopy, magnification objects are nuclei and cells, cellular agglutinations arranged to functional units such as vessels, glands, nerves, etc., or intestinal surfaces, or skin. The neighbourhood of these functional units or biological meaningful objects may contain a biological function again, for example goblet cells and ciliated cells in bronchial mucosa.
A more sophisticated analysis directs to the concept of ordered structures in living organisms which seem to be a necessity to stay alive [34, 35, 45–48].
In respect to image analysis, the derivative is the idea that all content-based image information can be derived from three different, not necessarily independent, parameters, namely texture, object, and structure [37, 49, 50]. The principle is demonstrated in Fig. 4.7. Texture is a mapping of pixel-based grey values, which can be transformed by different transformations such as Fourier analysis, regressive analysis comparable to time series analysis, Laplace transformations, local and other filters, etc. [36, 37, 51, 52]. The second and third techniques depend on segmentation and identification of external defined objects and their spatial relationship. The definition of a neighbourhood is mandatory to analyse the structures built by the objects. Voronoi’s neighbourhood condition and the graph theory are often applied to measure structural features [15, 53–58].
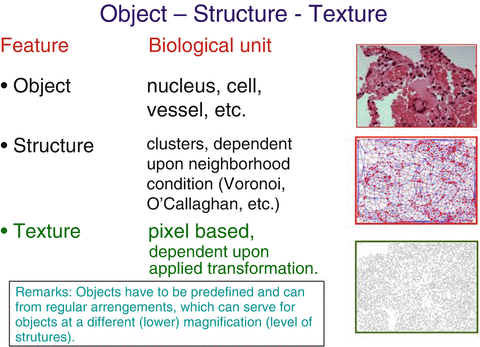
Fig. 4.7
Explanation of the main components of image content information
The three image information components can be set in order as follows:
1.
An image texture is a prerequisite for the presence of objects and structures, i.e. without an image texture no objects and consecutively no structures do exist.
2.
Textures basically depend upon the image size and the chosen start point of analysis. Most algorithms require an image size >256 × 256 pixels for reliable performance.
3.
Objects can only be segmented if the grey value distribution of the image displays at least one maximum at a statistically significant level (to be separated from noise).
4.
Objects are a prerequisite for structure(s), i.e. without any object no structure.
5.
All object features can be derived from its size (in pixels) and its internal grey value distribution (including its surface). Thus, objects have to possess a minimum size in order to perform feature extraction at a statistically significant level. The average size of an object should amount to 1000 pixels, and a minimum of 100 objects should be measured.
6.
The average number of objects that form a structure should amount to 100 objects.
Colour Space
Different colour spaces have been defined to present and analyse a digitised image. The most frequently used one is the image presentation in the rgb space. The rgb space takes into account that each colour can be composed by contribution of colours red, green, and blue. The rgb space is suitable to working with fluorescent images because most of the signals are highly colour specific, for example DAPI (blue), FITC (green), or Texas red (red) [15, 27, 59]. The same statement holds true if monochrome light sources (lasers) are used. A transformation of the rgb space into a different colour space that separated the intensity is of advantage if “normal” IHC, especially DAB, is applied which results in a brown detection signal [60]. The HSI colour space (hue, saturation, intensity) is an often used transformation of the rgb colour space. It permits an easy computation of colour-specific intensities [44, 59, 61–63].
Image Quality
Images of “good quality” are mandatory to extract content-based information or to derive a certain diagnosis. However, what is good image quality? The answer depends upon the aim to have “good quality”, or, in other words, what is meant by good quality. The quality measures of images that serve for a certain diagnosis probably differ from those that are created by artists that are designed to express ideas or personal views of specific events or motions. Thus, we can distinguish between subjective and machine-oriented methods to define image quality. Subjective methods analyse colour and intensity (brightness) adjustment to the individual human perception (morning light, sunset, moonlight, etc.). Machine-oriented methods compare image copies with the original ones, and correct potential differences.
Measurements of digitised light microscopy images are aimed to result in reliable, reproducible, and clinically applicable data [44, 59, 63, 64]. The mandatory image properties include:
1.
No vignetting (shading). The grey values of the background pixels should not depend upon their coordinates (spatially independent). In other words, the background grey values of pixels in the x–y gradient image should be zero.
2.
The absolute grey value range (0–255 bits) should be spatially independent.
3.
The total grey value histogram should display distinct minima and maxima, which indicate the existence of reliable segmentation thresholds.
4.
The surface gradient of potential objects should exceed 20 % of the total grey value range (i.e. the objects should be in focus).
5.
The image size should exceed 256 × 256 pixels in order to allow reliable texture analysis.
6.
The size of potential objects should amount >1000 pixels/object.
7.
The number of potential objects should amount >100 pixels/image.
Some of these requirements can be artificially readjusted. Especially the shading and the grey value range can be corrected to an optimum. An example of automated image quality correction is shown in Fig. 4.8. All these parameters should be continuously measured, corrected, and demonstrated in series as reported by Kayser et al. [65, 66]. Analysis of such series can explain potential inaccurate measurements [16, 59, 65–67].
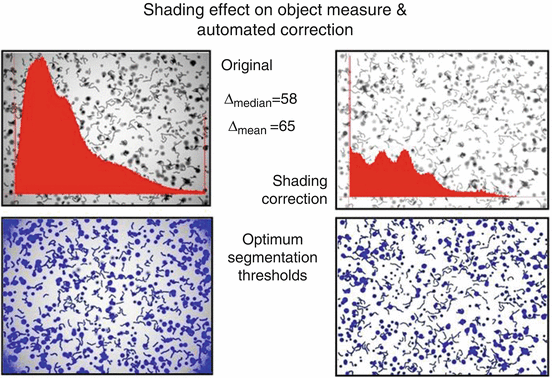
Fig. 4.8
Effect of (automated) image quality correction on segmentation quality
Object Segmentation
The segmentation and consecutive identification of objects may be difficult especially in IHC images. Objects that are characterised by closed surfaces (nuclei, cells, glands, vessels, etc.) are usually segmented by algorithms that are based upon a dynamic or fixed threshold, and, in addition, upon edge finding mechanisms and analysis of the convexity of the already segmented surface segments [37, 50, 51, 64, 68, 69]. Such algorithms with included variable thresholds and appropriate feedback mechanisms have been reported to reproducibly segment (and identify) more than 95 % of nuclei in IHC images [39]. Membranes are more difficult to segment, especially in IHC images with only partially stained membranes. The identification of nuclei, the computation of the corresponding gravity centres, and the application of Dirichlet’s (Voronoi’s) tessellation permit the construction of artificial membranes adjusted to the IHC stained membrane fragments [44, 52, 70]. Such an algorithm permits a detailed and reproducible, automated calculation of membrane stains (for example expression of her2_neu) in addition to the crude Her2_neu score [17, 27, 38, 71–73].
Vessels can be segmented in a comparable manner, especially if the inner surface (endothelial cells) is marked by specific antibodies (CD31, CD34, or VEGFR (vascular endothelial growth factor receptor)). The application of appropriate neighbourhood condition and double marker stain (for example Ki67 (MIB2) for proliferation and CD34 for intra-tumour vessels) has been reported to permit a sophisticated insight into the association of tumour cell proliferation and distance from the nearest neighbouring vessel. The situation is shown in Fig. 4.9 and visualises the diffusion density within a malignant tumour [70].
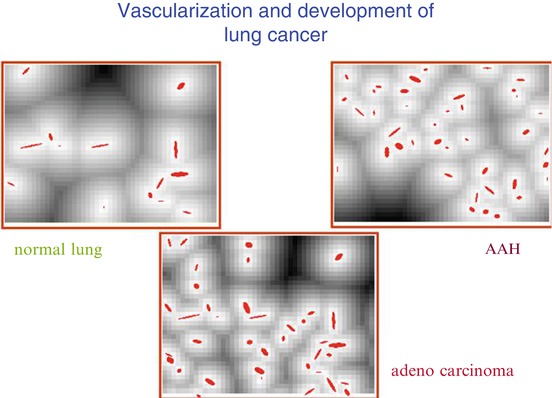
Fig. 4.9
Visualisation of spatial diffusion in relation to vascularisation. Syntactic structure analysis, CD31 IHC, magnification: ×150
Segmentation of FISH signals is relatively easy due to the sharp and demarcated FISH signals. It is, however, handicapped by the small size of the signals and the thin focus plane which might not contain all FISH signals. Therefore, FISH images should be composed by several focus layers in order to possess and analyse all nuclear signals [71, 72].
Analysis of IHC detectable antigens in the cellular cytoplasm is best performed by stereologic methods, such as point/grid counting, in our opinion. An object is the overlay of an appropriate grid (for details, see [74–77]) and the automated assessment of the hit events (points of interest) which are used to calculate stereologic parameters such as area/volume fraction, size adjusted point (object) density, length/area fraction, etc.
Syntactic Structure Algorithms
An object remains the principal and visual controllable main feature of any digitised image. Most objects of microscopic images reflect to nuclei, followed by membranes in images derived from IHC. Once the objects have been segmented, they are considered “as a whole” and their features are measured [36, 45, 47, 56, 58, 78]. There does exist an additional method for analysing and characterising digitised images based upon stochastic geometry, so-called image primitives [44, 49, 79–82]. The idea is that each object or characteristic unit of an image can be constructed by a set of primitives that include {points, lines, circles} above and below a certain threshold [49, 50]. They correspond to peaks (holes) and ridges (valleys), and form a so-called group. Similar to the syntactic structure algorithms that are derived from image objects (usually nuclei), these primitives can serve for extraction of image information. The flexible arrangement of thresholds and the threshold-depending clusters and neighbourhood function is probably an advantage of such algorithms [39]. However, detailed reports of IHC application are still missing to our knowledge. An example of the described method is shown in Fig. 4.10.
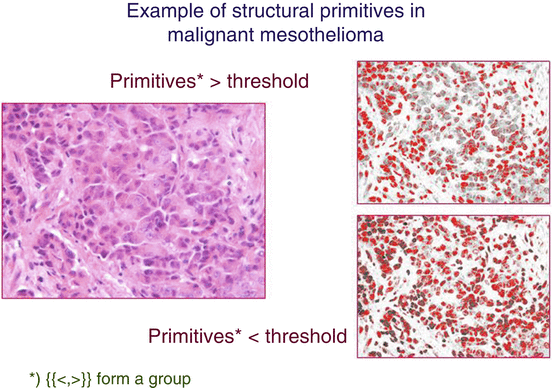
Fig. 4.10
Example of evaluation of primitives in a malignant epithelioid mesothelioma . ×180
Image Information and Feature Extraction
There exist at least five different techniques to derive information from a histological image [37, 38, 44]: (a) analysis of pixel grey values and their coordination (texture analysis); (b) external definition of objects, segmentation, and object-related feature extraction, (c) analysis of object-associated structures and structure-related feature extraction (after definition of a neighbourhood condition), (d) construction of image primitives and related feature extraction, (e) comparison of the individual image “as a whole” with a “set of standardised and quality (content) evaluated set of images (gold standard set)”, computation of the best fitting (nearest neighbouring) image, and association of the (already computed) corresponding labels (diagnosis, texture, objects, structures, and features) with the image under request. Each of the mentioned algorithms has its advantages and disadvantages. They can be considered to be independent from or only weakly dependent upon each other and, therefore, be combined. Especially, the combination of texture, object, and structure features has been applied successfully to automatically screen histological images and to derive crude diagnoses (normal, inflammatory altered, benign and malignant tumours) [37, 50, 51]. The principal features are based upon grey values and their distribution and include size, surface, form factor, moments, pixel-based entropy, moments, transformation-associated features (derived after application of locally dependent and independent filters/transformations such as Fourier, Prewitt, Laplace, Radon, Hadamard, etc.) [57, 82–85]. All these methods result in a vector that can be statistically analysed in respect to observer-related information (diagnosis, prognosis, response to therapy, etc). The applied statistical methods include neural networks and multivariate analysis [27, 44, 56, 63, 80, 86]. The statistical investigations require a training set (to define the diagnosis-associated limitations of the variables, or to train the neural network, and a test set that confirms the calculated results [27, 87–92]. These results can, in addition, be used to search for and select those image areas that contain the “most significant information”. What is the most significant image information?
Region of Interest
Already at a first glance it can be stated that a virtual slide (VS) can be disintegrated into image compartments that might be identical in terms of the visualised objects and structures, or that might differ in between. Such an image consists of image compartments that reflect more to the diagnosis compared to others. The areas are called regions of interest (ROI) and can contain an increased frequency of proliferating cells, a denser vascularisation, or less necrotic areas. They are, in addition, considered to be of increased prognostic significant value.
How can these compartments be automatically detected?
All the above discussed techniques can be applied. The image is either divided into connecting compartments equal in size, and the different compartments are analysed in respect of object density and structure parameters (and, in addition, of texture features (sliding technique)), or clusters of specific texture features dependent upon the minimum spanning tree and derived structural entropy are identified [27, 44, 50]. Both techniques have been reported to detect ROIs with a sensitivity >95 %. An example of the obtained ROI in a biopsy of breast (sclerosing ductal carcinoma) is depicted in Fig. 4.11. Other approaches are based upon stereologic sampling and diffusion maps [84, 86, 93, 94], or by density calculations of similarity (dissimilarity) maps [85].
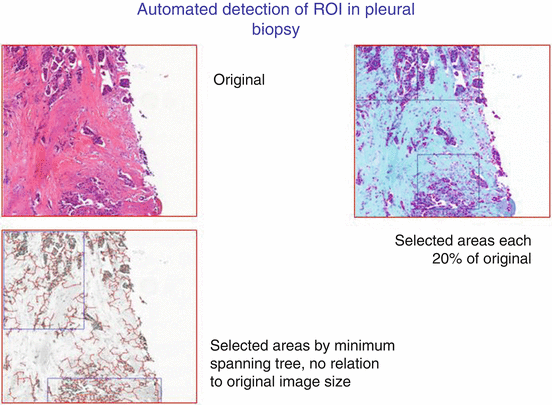
Fig. 4.11
Example of automated ROI detection in a biopsy of a sclerosing invasive ductal carcinoma of the breast, HE, ×120
Application in IHC
The described methods and algorithms have all been developed to ensure reproducible and reliable measurements of still images and VS. IHC has become the main field of application of this technology in contrast to images acquired from conventional H&E stained slides. Within the IHC application, the most frequently used visualisation technique is based upon the DAB reaction which yields a brown signal in case of antigen presence. The development of automated IHC staining systems ensures a quite stable and reliable reaction despite some problems which are mainly caused by sometime unavoidable tissue preservation and fixation failures. Assuming a high-quality IHC stain, what are the mandatory conditions to perform reproducible staining analysis and quantification?
Stay updated, free articles. Join our Telegram channel

Full access? Get Clinical Tree


