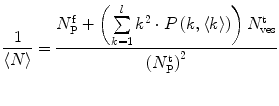
(1)
Centro de Química-Física Molecular and Institute of Nanoscience and Nanotechnology, Instituto Superior Técnico, Universidade Técnica de Lisboa, Lisbon, Portugal
(2)
Departamento Química e Bioquímica, Faculdade de Ciências da Universidade de Lisboa, Lisbon, Portugal
Abstract
Fluorescence correlation spectroscopy (FCS) is a powerful method to investigate molecular interactions based on the variation of diffusion properties at the single-molecule level. This technique allows studying quantitatively the interaction of fluorescently labeled proteins/peptides with lipid vesicles. Here, we describe how to acquire and analyze FCS partition data in order to accurately determine the protein/peptide partition coefficients between the aqueous and lipid phases. It is shown that the recovery of unbiased partition coefficients from FCS partition curves (fractional amplitude of the bound species versus lipid concentration) requires considering explicitly the Poissonian loading of the lipid vesicles with the fluorescently labeled protein in order to account for the variable liposome brightness in each sample. Additionally, the impact of a trace amount of a fluorescent non-binding component on the partition curves determined by FCS is also discussed.
Key words
Protein/peptide partition coefficientsPoisson distributionMolecular brightnessElectrostatic interactions1 Introduction
The single-molecule-based fluorescence correlation spectroscopy (FCS) is a suitable and powerful technique to investigate a large variety of dynamic processes and to quantify molecular interactions both in vitro and in vivo [1–3]. This technique measures fluorescence intensity fluctuations of a small number of fluorescently labeled molecules diffusing into and out of a very small focal volume (Fig. 1a, b). Therefore, any process that affects these fluctuations, e.g., ligand-macromolecule binding, internal macromolecule dynamics, intersystem crossing, translational and rotational diffusion, and excited state reactions, can be detected from FCS data [1–3].
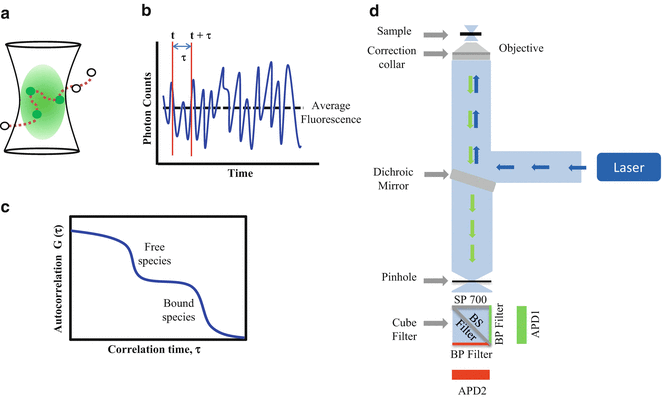

Fig. 1
Fluorescence correlation spectroscopy. (a) Fluorescently labeled molecules diffuse into and out of the ellipsoidal shape observation volume, (b) causing fluctuations in the fluorescence intensity signal over time. This signal is then processed using an autocorrelation algorithm to obtain the AC curve of the diffusing species. (c) Plot of an idealized two-component AC curve related to protein/peptide partition studies. Using single-color FCS, the free fluorescently labeled molecules can be easily distinguished from the slower-diffusing species (liposomes containing one or more bound fluorescently labeled proteins/peptides). (d) FCS setup. The laser beam is focused by a high-numerical objective on the sample. The fluorescence light is then collected by the same objective, passes the dichroic mirror and is focused onto a pinhole to reduce the excitation volume. Finally, the fluorescence signal is detected by an APD after passing through an emission band-pass filter cube. This filter cube has a 700 nm short band-pass filter (SP 700) and a beam splitter (BS Filter), which separate the emission light into two channels containing band-pass filters (BP Filter)
The normalized autocorrelation (AC) function,  , of fluorescence fluctuations at a given time t,
  , and at a later time
  ,
,  , is given by

where F(t) is the fluorescence intensity as a function of time t and  . The angular brackets refer to time averaging and τ is the correlation time. Therefore, the AC function is a measure of the self-similarity of the fluorescence signal at time t and after a given delay time τ.
 , of fluorescence fluctuations at a given time t,
  , and at a later time
  ,
,  , is given by
(1)
 . The angular brackets refer to time averaging and τ is the correlation time. Therefore, the AC function is a measure of the self-similarity of the fluorescence signal at time t and after a given delay time τ.
To obtain the physical parameters of interest, the experimental AC curves are fitted by the appropriate mathematical model describing the characteristics of the system under study. For a single diffusing species undergoing Brownian motion in a three-dimensional (3D) Gaussian focus volume element, the AC function that includes the triplet-state formation is described by [3]:

where N is the average number of fluorescent molecules in the laser focus, and T and  are the fraction of fluorophores in the triplet state and triplet lifetime, respectively. The parameter
  is the correlation time of the particle, which corresponds to the characteristic average diffusion time during which a molecule resides in the observation confocal volume with axial (
 ) to lateral (
 ) dimensions
 .
.  is related to the diffusion coefficient of the molecule,
  , through the Einstein relation,
  .
.

(2)
 are the fraction of fluorophores in the triplet state and triplet lifetime, respectively. The parameter
  is the correlation time of the particle, which corresponds to the characteristic average diffusion time during which a molecule resides in the observation confocal volume with axial (
 ) to lateral (
 ) dimensions
 .
.  is related to the diffusion coefficient of the molecule,
  , through the Einstein relation,
  .
.For multiple independent fluorescent species, the AC function is a linear combination of the AC curve for each species  ,
,  , weighted by the square of its molecular brightness,
  [4]:
[4]:
![$$ G(\tau )={{{\sum\limits_{i=1}^n {B_i^2N_i^2{G_i}(\tau )} }} \left/ {{{{{\left[ {\sum\limits_{i=1}^n {{B_i}{N_i}} } \right]}}^2}}} \right.} $$](/wp-content/uploads/2017/03/A299540_1_En_26_Chapter_Equ00263.gif)
where  is the mean particle number of the ith species. The molecular brightness is an important parameter in FCS measurements as it controls the signal-to-noise ratio of the measurements. This parameter depends on several molecular intrinsic properties of the conjugated fluorophore under study (absorption cross-section and fluorescence quantum yield) as well as on the detection efficiency of the confocal microscope.
 ,
,  , weighted by the square of its molecular brightness,
  [4]:
[4]:![$$ G(\tau )={{{\sum\limits_{i=1}^n {B_i^2N_i^2{G_i}(\tau )} }} \left/ {{{{{\left[ {\sum\limits_{i=1}^n {{B_i}{N_i}} } \right]}}^2}}} \right.} $$](/wp-content/uploads/2017/03/A299540_1_En_26_Chapter_Equ00263.gif)
(3)
 is the mean particle number of the ith species. The molecular brightness is an important parameter in FCS measurements as it controls the signal-to-noise ratio of the measurements. This parameter depends on several molecular intrinsic properties of the conjugated fluorophore under study (absorption cross-section and fluorescence quantum yield) as well as on the detection efficiency of the confocal microscope.
Considering that  , Eq. 3 can be rewritten as

with  and
and  .
.  is the ratio between the brightness of the ith component relatively to a given component chosen as a reference.
 , Eq. 3 can be rewritten as
(4)
 and
and  .
.  is the ratio between the brightness of the ith component relatively to a given component chosen as a reference.
1.1 Determination of Partition Coefficients by FCS (Two-Component Model M2)
The determination of partition coefficients of proteins/peptides to lipid vesicles is usually the first step in any lipid-protein/peptide interaction study. For the determination of this parameter, several spectroscopic techniques, including different fluorescence methods [5], have often been employed. Since the pioneer work of Rusu et al. in 2004 [6], FCS has emerged as an important alternative option. FCS produces reliable partition measurements using nanomolar peptide/protein concentrations; these are between 10 and 100 times lower than those required for other techniques, such as circular dichroism (CD) and fluorescence spectroscopy. In addition, FCS measurements can be carried out rapidly and therefore a series of AC curves that allows for statistical analysis of the partition behavior can be collected within a short period after first mixing the conjugated protein/peptide and the vesicles together. In order to carry out FCS measurements, however, it is necessary to label the protein/peptide with an adequate fluorescent dye that has low triplet-state excitation, a high quantum yield, and high photostability.
Fluorescence correlation spectroscopy depends on molecular mobilities, enabling to identify molecular interactions based on a change of diffusion times. In a single-color FCS partition study, the only species in solution that can be distinguished according to this parameter are the fast-diffusing free fluorescently labeled protein/peptide (index P) and the much slower-diffusing lipid vesicles containing one or more bound fluorescently labeled proteins/peptides (index ves) (Fig. 1c). The contribution of each of these fluorescent species to the AC function is strongly biased by its brightness as it is shown by Eq. 3 (i.e., a liposome with two fluorescently labeled proteins/peptides is exactly twice as bright as a lipid vesicle with a single protein/peptide, but it will contribute four times as much to the two-component AC curve) (Fig. 2). The way this problem affects the analysis of FCS partition data was addressed in detail in a previous study by considering the statistical (Poissonian) distribution of the fluorescently labeled protein/peptide among the lipid vesicles [7]. The model derived in that work was based on the following assumptions:
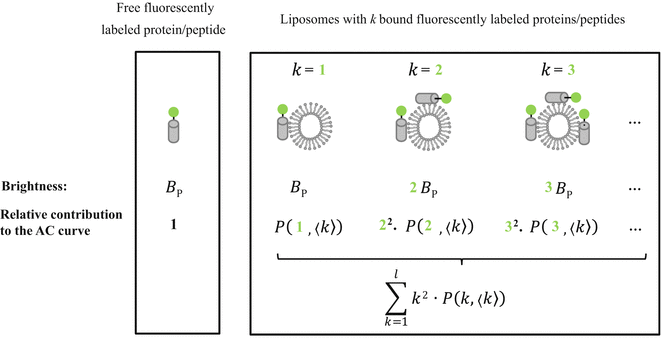

Fig. 2
To accurately determine partition coefficients by FCS, the statistical distribution of fluorescently labeled proteins/peptides per lipid vesicle must be considered in order to take into account the effect of variable liposome brightness at low lipid concentrations.  is the Poisson probability of finding a liposome with
  bound proteins/peptides
 is the Poisson probability of finding a liposome with
  bound proteins/peptides
1.
Protein/peptide partition to lipid vesicles is a noncooperative process. The mole fraction of the fluorescently labeled bound species to the liposomes,  , can be calculated from
![$$ {x_{\mathrm{ m}}}=\frac{{{K_{\mathrm{ P}}}\cdot {[L]_{\mathrm{ ac}}}}}{{[W]+{K_{\mathrm{ P}}}\cdot {[L]_{\mathrm{ ac}}}}} $$](/wp-content/uploads/2017/03/A299540_1_En_26_Chapter_Equ00265.gif)
where  is the mole fraction partitioning coefficient [5],
 ![$$ [W] $$](/wp-content/uploads/2017/03/A299540_1_En_26_Chapter_IEq002627.gif) is the water concentration, and
is the water concentration, and ![$$ {[L]_{\mathrm{ ac}}} $$](/wp-content/uploads/2017/03/A299540_1_En_26_Chapter_IEq002628.gif) is the accessible lipid concentration. This last parameter is half of total lipid concentration, when the peptide/protein binds only to the outer leaflet of the membrane.
is the accessible lipid concentration. This last parameter is half of total lipid concentration, when the peptide/protein binds only to the outer leaflet of the membrane.
 , can be calculated from
![$$ {x_{\mathrm{ m}}}=\frac{{{K_{\mathrm{ P}}}\cdot {[L]_{\mathrm{ ac}}}}}{{[W]+{K_{\mathrm{ P}}}\cdot {[L]_{\mathrm{ ac}}}}} $$](/wp-content/uploads/2017/03/A299540_1_En_26_Chapter_Equ00265.gif)
(5)
 is the mole fraction partitioning coefficient [5],
 ![$$ [W] $$](/wp-content/uploads/2017/03/A299540_1_En_26_Chapter_IEq002627.gif) is the water concentration, and
is the water concentration, and ![$$ {[L]_{\mathrm{ ac}}} $$](/wp-content/uploads/2017/03/A299540_1_En_26_Chapter_IEq002628.gif) is the accessible lipid concentration. This last parameter is half of total lipid concentration, when the peptide/protein binds only to the outer leaflet of the membrane.
is the accessible lipid concentration. This last parameter is half of total lipid concentration, when the peptide/protein binds only to the outer leaflet of the membrane.2.
The number of fluorescently labeled protein/peptide molecules bound per vesicle follows a Poisson distribution [8]. Therefore the probability of finding a liposome with  bound proteins/peptides (Fig. 2), is described by

where  is the average number of membrane-bound proteins/peptides per liposome. In addition, the number of lipid vesicles with one or more fluorescently conjugated protein/peptide bound,
  , can be calculated:

where  and
and  are the total number of lipid vesicles and the probability of finding liposomes without membrane-bound protein/peptide, respectively.
 bound proteins/peptides (Fig. 2), is described by
(6)
 is the average number of membrane-bound proteins/peptides per liposome. In addition, the number of lipid vesicles with one or more fluorescently conjugated protein/peptide bound,
  , can be calculated:
(7)
 and
and  are the total number of lipid vesicles and the probability of finding liposomes without membrane-bound protein/peptide, respectively.
3.
The liposome population is monodisperse and its morphology is not affected by protein/peptide partition, so  will be
![$$ \langle k\rangle =\frac{{{x_{\mathrm{ m}}}{[P]_{\mathrm{ t}}}\mu }}{{{[L]_{\mathrm{ t}}}}} $$](/wp-content/uploads/2017/03/A299540_1_En_26_Chapter_Equ00268.gif)
where ![$$ {[P]_{\mathrm{ t}}} $$](/wp-content/uploads/2017/03/A299540_1_En_26_Chapter_IEq002635.gif) and
and ![$$ {[L]_{\mathrm{ t}}} $$](/wp-content/uploads/2017/03/A299540_1_En_26_Chapter_IEq002636.gif) are the total protein/peptide and lipid concentrations, respectively, and
are the total protein/peptide and lipid concentrations, respectively, and  is the average number of lipid molecules in a liposome.
 will be
![$$ \langle k\rangle =\frac{{{x_{\mathrm{ m}}}{[P]_{\mathrm{ t}}}\mu }}{{{[L]_{\mathrm{ t}}}}} $$](/wp-content/uploads/2017/03/A299540_1_En_26_Chapter_Equ00268.gif)
(8)
![$$ {[P]_{\mathrm{ t}}} $$](/wp-content/uploads/2017/03/A299540_1_En_26_Chapter_IEq002635.gif) and
and ![$$ {[L]_{\mathrm{ t}}} $$](/wp-content/uploads/2017/03/A299540_1_En_26_Chapter_IEq002636.gif) are the total protein/peptide and lipid concentrations, respectively, and
are the total protein/peptide and lipid concentrations, respectively, and  is the average number of lipid molecules in a liposome.
4.
The bound fluorescently labeled protein/peptide does not dissociate from a liposome during its diffusion through the confocal volume (frozen exchange regime) [9].
5.
The brightness of the labeled proteins/peptides is not affected by its partition to the liposomes.
According to the previous assumptions, and using Eq. 4, the absolute amplitudes of the AC associated to each diffusing species present in a FCS partition experiment are given by

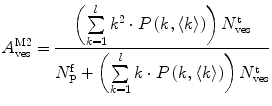
where  is the mean number of free conjugated proteins/peptides in solution.

(9)

(10)
 is the mean number of free conjugated proteins/peptides in solution.
The membrane-bound fraction of the fluorescently labeled protein/peptide,  , can then be directly calculated using the absolute amplitude of the AC curve associated with the fast-diffusing species,
  . In fact, Eq. 9 shows that
  is equal to the mole fraction of free protein/peptide in solution,
  , as its denominator is equal to
  , the total number of protein/peptide molecules present in each sample. Consequently,
  . It should also be noted that
  because
  is weighted by the factor
  on its numerator.
 , can then be directly calculated using the absolute amplitude of the AC curve associated with the fast-diffusing species,
  . In fact, Eq. 9 shows that
  is equal to the mole fraction of free protein/peptide in solution,
  , as its denominator is equal to
  , the total number of protein/peptide molecules present in each sample. Consequently,
  . It should also be noted that
  because
  is weighted by the factor
  on its numerator.
However, the fitting equations most commonly available in commercial software programs to analyze the experimental AC curves make use of fractional,  , instead of absolute amplitudes,
  , as weighting factors:

with  and
and  .
.
 , instead of absolute amplitudes,
  , as weighting factors:
(11)
 and
and  .
.In this case, and according to Eqs. 9, 10, and 11, the fractional amplitudes of the AC curve associated to each species can be calculated from

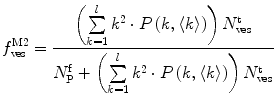

(13)

(14)
Equations 13 and 14 show that both fractional amplitudes,  and
and  , are now different from the free- and membrane-bound molar fractions of the conjugated protein/peptide, respectively, again due to the presence of the weighting factor
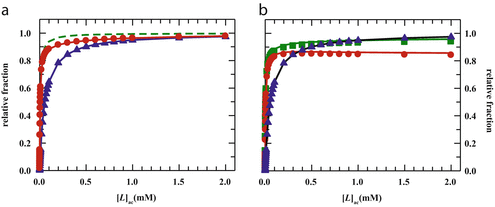
  on their numerator and/or denominator. This is an important observation frequently overlooked in the literature that can lead to an overestimation of the partition coefficients determined by FCS [7]. Figure 3a shows that
  converges to
  only when very high lipid concentrations are used in the partition experiment (infinite dilution regime, i.e., when each lipid vesicle contains no more than one membrane-bound protein on average). These two parameters are substantially different at lower lipid concentrations due to the high average number of membrane-bound proteins/peptides per liposome obtained under these experimental conditions
  . This effect causes the fitted K p to the data of
  versus accessible lipid concentration to be much larger than the input value used in the simulation (Fig. 3a).
 and
and  , are now different from the free- and membrane-bound molar fractions of the conjugated protein/peptide, respectively, again due to the presence of the weighting factor
  on their numerator and/or denominator. This is an important observation frequently overlooked in the literature that can lead to an overestimation of the partition coefficients determined by FCS [7]. Figure 3a shows that
  converges to
  only when very high lipid concentrations are used in the partition experiment (infinite dilution regime, i.e., when each lipid vesicle contains no more than one membrane-bound protein on average). These two parameters are substantially different at lower lipid concentrations due to the high average number of membrane-bound proteins/peptides per liposome obtained under these experimental conditions
  . This effect causes the fitted K p to the data of
  versus accessible lipid concentration to be much larger than the input value used in the simulation (Fig. 3a).
Fig. 3
(a) Two-component model, M2: the fractional amplitude calculated for the slow-diffusing species using Eq. 14 ( , filled circle) converges to the bound mole fraction of fluorescently labeled proteins/peptides [
 , filled triangle (Eq. 5 with
  )] only at saturating lipid concentrations. The K p obtained from fitting directly Eq. 5 to the data of
  versus
 ![$$ {[L]_{\mathrm{ ac}}} $$](/wp-content/uploads/2017/03/A299540_1_En_26_Chapter_IEq002664.gif) (dashed green curve,
(dashed green curve,  ) was almost tenfold higher than the input value used in the simulation. (b) Three-component model, M3: the presence of a vestigial amount of a very bright free dye in solution causes an apparent maximal protein bound fraction lower than 1.0. The variation of (a)
  (filled circle) and (b)
  (filled square and filled circle) as a function of accessible lipid concentration was calculated considering the Poisson distribution of 10 nM fluorescently labeled proteins/peptides among lipid vesicles using μ = 100,000 and
  . (b) The additional presence of 5 % of free dye (non-binding fluorescent component) with
  (filled square) and
  (filled circle) was also included in the simulation (b) (Reprinted from Melo et al., 2011 with permission. Copyright from Elsevier)
 , filled circle) converges to the bound mole fraction of fluorescently labeled proteins/peptides [
 , filled triangle (Eq. 5 with
  )] only at saturating lipid concentrations. The K p obtained from fitting directly Eq. 5 to the data of
  versus
 ![$$ {[L]_{\mathrm{ ac}}} $$](/wp-content/uploads/2017/03/A299540_1_En_26_Chapter_IEq002664.gif) (dashed green curve,
(dashed green curve,  ) was almost tenfold higher than the input value used in the simulation. (b) Three-component model, M3: the presence of a vestigial amount of a very bright free dye in solution causes an apparent maximal protein bound fraction lower than 1.0. The variation of (a)
  (filled circle) and (b)
  (filled square and filled circle) as a function of accessible lipid concentration was calculated considering the Poisson distribution of 10 nM fluorescently labeled proteins/peptides among lipid vesicles using μ = 100,000 and
  . (b) The additional presence of 5 % of free dye (non-binding fluorescent component) with
  (filled square) and
  (filled circle) was also included in the simulation (b) (Reprinted from Melo et al., 2011 with permission. Copyright from Elsevier)
Accordingly, a correct quantitative analysis of FCS partition data obtained as fractional amplitude of the bound species versus accessible lipid concentration requires using a nonlinear iterative least-squares procedure that takes into account the statistical (Poissonian) distribution of the fluorescently labeled protein among the ensemble of liposomes to not overestimate the recovered K p values (see Subheading 3.5).
1.2 Determination of Partition Coefficients by FCS in the Presence of a Non-binding Fluorescent Component (Free Dye) (Three-Component Model M3)
The vestigial presence of free unreacted dye in solution is often detected in FCS binding studies [10–13]. This situation can be particularly problematic in FCS partition experiments carried out with negatively charged liposomes because some fluorophores are anionic (e.g., Alexa 488). Therefore, strong electrostatic repulsive interactions between these two components produce a non-binding fluorescent species in solution. In order to evaluate how this non-binding component can affect the FCS partition curves, the model derived in the previous section was extended by including the presence of a third species in solution, namely, unconjugated free dye (three-component model M3) [7].
Stay updated, free articles. Join our Telegram channel

Full access? Get Clinical Tree


