Fig. 18.1
Building blocks of quality by design
Table 18.1
Descriptions of the building blocks of quality by design
Building block | Description |
|---|---|
Critical quality attributes (CQAs) | The critical process output measurements linked to patient needs. |
Critical process parameters (CPPs) | The process inputs (active pharmaceutical ingredient and excipients), control, and environmental factors that have major effects on the CQAs. |
Raw-materials factors | Include the stability and capability of raw-material manufacturing processes that affect process robustness, process capability, and process stability. |
Process model | A quantitative picture of the process based on fundamental and statistical relationships that predict the CQA results. |
Design space | The combinations of input variables and process parameters that provide quality assurance. |
Process and measurement capability | Tracks process performance relative to CQA specifications and provides measurement repeatability and reproducibility regarding CQAs. |
Process and measurement robustness | The ability of the process and measurement system to perform when faced with uncontrolled variation in process, input, and environmental variables. |
Process and measurement control | Control procedures, including statistical process control, that keep the process and the measurement system on target and within the desired variation. |
Failure-modes-and-effects analysis (FMEA) of the CPPs | Examines raw-material variables, identifies how the process can fail, and, reveals after appropriate controls and fixes are in place, the areas of the process that remain at greatest risk of failing. |
Risk level | A function of the design space, FMEA results, and process and measurement capability, control, and robustness. |
The QbD building blocks that enable the QTPP to be realized are outlined below:
Identify critical quality attributes (CQAs)
Characterize raw-material variation
Identify critical process parameters (CPPs)
Characterize design space
Ensure process capability, control, and robustness
Identify analytical method capability, control, and robustness
Create process-model monitoring and maintenance
Offer risk analysis and management
Implement Life cycle management: Continuous improvement and continued process verification.
Attention must be paid to the product formulation, manufacturing process, and analytical methods. Measurement is a process that needs to be designed, improved, and controlled just as any other process. The QbD building blocks provide a picture of the critical elements of the roadmap. It is critical to success to recognize how the building blocks are linked and sequenced over time. Figure 18.1 provides a roadmap for implementing QbD telling us that QbD builds as the product and process is developed; hence QbD is a sequential approach. The building blocks are created and assembled using the principles of Statistical Engineering (Hoerl and Snee 2010) which provides a framework for approaching large initiatives such as QbD.
18.3 Process Understanding: Critical to Process Development, Operation and Improvement
Process understanding is fundamental to the QbD approach. Indeed process understanding is an integral part of the definition of QbD. Regulatory flexibility comes from showing that a given process is well understood. According to FDA (2004), a process is generally considered to be well understood when the following conditions are met:
1.
All critical sources of variability are identified and explained
2.
Variability is managed by the process
3.
Product-quality attributes can be accurately and reliably predicted within the design space established for the materials used, process parameters, manufacturing, environmental and other conditions.
Process understanding is needed not only for product and process development, but also for successful technology transfer from development to manufacturing and from site-to-site, which includes transfer to contract manufacturing organizations (Alaedini et al. 2007; Snee 2006; Snee et al. 2009a). It is very difficult, if not impossible, to successfully and effectively create, operate, improve, or transfer a process that is not understood.
The importance of process understanding is illustrated by the following case. A new solid-dose, 24-hour controlled-release product for pain management had been approved but not yet validated because it had encountered wide variations in its dissolution rate. The manufacturer did not know whether the dissolution problems were related to the active pharmaceutical ingredient (API), the excipients, or to variables in the manufacturing process—or to some combination of these factors.
Frustrated with the lack of process understanding, the manufacturer narrowed the range of possible causes of the unacceptable dissolution rate to nine potential variables—four properties of the raw material and five process variables. The team used a designed experiment (DOE) to screen out irrelevant variables and to find the best operating values for the critical variables (Snee et al. 2009b).
The analysis showed that one process variable exerted the greatest influence on dissolution and that other process and raw material variables and their interactions also played a key role. The importance of the process variable with the largest effect had been unknown prior to this experiment even after more than 8 years of development work. This enhanced process understanding enabled the company to define the design space and the product was successfully validated and launched.
This example illustrates the criticality of process understanding. The FDA noted the importance of process understanding when they released “Guidance for Industry: PAT – A Framework for Pharmaceutical Development, Manufacturing and Quality Assurance”, (FDA 2004). The FDA was responding to the realities of the pharmaceutical and biotech industries; namely that Pharma/Biotech needs to improve operations and speed up product development. Compliance continues to be an issue and risks must be identified, quantified and reduced. The root causes of many compliance issues relate to processes that are neither well understood nor well controlled.
Prediction of process and product performance requires some form of a model, Y = f(X). In this conceptual model, Y is the process outputs such as Critical Quality Attributes (CQAs) of the product and X denotes the various process and environmental variables that have an effect of the process outputs, often referred to as Critical Process Parameters (CPPs). Models may be empirical, developed from data, or mechanistic, based on first principles.
In developing process understanding it is helpful to create a process schematic such as the one for a compression process shown in Fig. 18.2. Here we see the process outputs (Ys), Process inputs (Xs), Process control variables (Xs) and environmental variables (Xs). The goal is to produce a process model of the form Y = f (Xs) that will accurately predict process performance as measured by the Ys (CQAs).
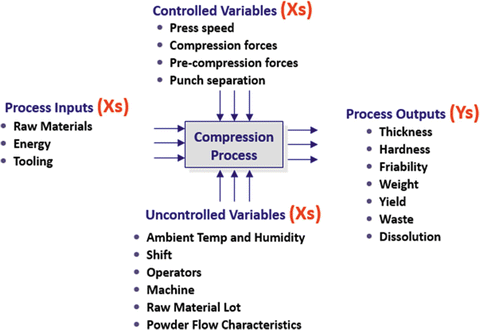

Fig. 18.2
Process schematic showing process inputs, control variables environmental variables and outputs. Developing the model Y = f(X) enables prediction of future process performance
McCurdy et al. (2010) provide an example of such models developed for a roller compaction process. Among the models reported was a model in which tablet potency relative standard deviation (RSD) was increased by increasing mill screen size (SS) and decreased with increasing roller force (RF) and gap width (GW). They reported a quantitative model for the relationship:
 Process understanding summarized and codified in the form of the process model, conceptually represented as Y = f(X), can contain any number of variables (Xs). These models typically include linear, interaction and curvature terms as well as other types of mathematical functions.

At a strategic level, a way to assess process understanding is to observe how the process is operating. When process understanding is adequate the following will be observed:
Stable processes (in statistical control) are capable of producing product that meets specifications
Little firefighting and heroic efforts required to keep the process on target
Processes are running at the designed speed with little waste
Processes are operating with the expected efficiency and cost structure
Employee job satisfaction and customer satisfaction is high
Process performance is predictable
To assess the state of process understanding at an operational level we need a list of desired characteristics. A list for assessing process understanding is discussed in the following sections along with the identification of process problems that frequently result from lack of process understanding and how to develop process understanding including what tools to use.
18.3.1 Assessing Process Understanding
The FDA definition of process understanding is useful at a high level but a more descriptive definition is needed; a definition that can be used to determine if a process is understood at an operational level.
Table 18.2 lists the characteristics that are useful in determining when process understanding exists for a given process. First it is important that the critical variables (Xs) that drive the process are known. Such variables are typically called critical process parameters (CPP). It is helpful to broaden this definition to include both input and environmental variables as well as process variables; sometimes referred as the “knobs” on the process.
Table 18.2
Characteristics of process understanding
• Critical process parameters (Xs) that drive the process are known and used to construct the process design space and process control approach. |
• Critical environmental and uncontrolled (noise) variables that affect the critical quality attributes (Ys) are known and used to design the process to be insensitive to these uncontrolled variations (robustness) |
• Robust measurement systems are in place and the measurement repeatability and reproducibility is known for all critical quality attributes (Ys) and critical process parameters (Xs) |
• Process capability is known |
• Process failure modes are known and removed or mitigated |
• Process control procedures and plans are in place |
It is important to know the critical environmental variables (uncontrolled noise variables), such as ambient conditions and raw material lot variation, can have a major effect on the process output (Ys). Designing the process to be insensitive to these uncontrolled variations results in a “robust” process.
Measurement systems are in place and the amount of measurement repeatability and reproducibility is known for both output (Y) and input (X) parameters. The measurement systems need to be robust to minor and inevitable variations in how the procedures are used to implement the methods on a routine basis. This critical aspect or process understanding is often overlooked in the development process. Gage Repeatability and Reproducibility studies and method robustness investigations are essential to proper understanding of the measurement systems.
Process capability studies involving the estimation of process capability and process performance indices (Cp, Cpk, Pp and Ppk) are useful in establishing process capability. Sample size is a critical issue here. From a statistical perspective 30 samples is the minimum for assessing process capability; much more useful indices are developed from samples on 60–90 observations. In Chap. 20 the authors recommend sample sizes of 100–200 for reasonable size confidence intervals.
In assessing the various sources of risk in the process, it is essential that the potential process failure modes be known. This is greatly aided by performing a failure modes and effects analysis at the beginning of the development process and as part of the validation of the product formulation and process selected for commercialization.
Process control procedures and plans should be in place. This will help assure that the process remains on target at the desired process settings. This control procedure should also include a periodic verification of the process model, Y = f(X), used to develop the design space. This is also recommended by the FDA’s Process Validation Guidance (FDA 2011).
18.3.2 Process Problems Are Typically due to Lack of Process Understanding
Although it is “a blinding flash of the obvious”, it often overlooked that when you have a process problem it is due to a lack of process understanding. When a process problem occurs you often hear “Who did it; who do we blame”? Or “How do we get it fixed as soon as possible?” Juran emphasized that 85 % of the problems are due to the process and the remaining 15 % are due to the people who operate the process (Juran and DeFeo 2010).
While a sense of urgency in fixing process problems is appropriate some better questions to ask are “How did the process fail?” and “What do we know about this process; do we have adequate understanding of how this process works”?
Table 18.3 summarizes some examples of process problems and how new process understanding lead to significant improvements; sometimes in unexpected areas. Note that these examples cover a wide range of manufacturing and non-manufacturing issues including capacity shortfalls, defective batches, process interruptions, batch release time and report error rates. All were significant problems in terms of both financial and process performance. The increased process understanding resulted in significant improvements.
Table 18.3
Descriptions of tools used for developing process understanding
Tool | Description |
|---|---|
Process map | A schematic of a process showing process steps and process inputs and outputs. |
Cause-and-effect matrix | A prioritization matrix that enables one to select those process input variables that have the greatest effect on the process output variables. |
Measurement systems analysis | A study of the measurement system, typically using Gage R&R* studies, to quantify the measurement of repeatability and reproducibility. |
Capability study | An analysis of process variation versus process specifications to assess the ability of the process to meet specifications. |
Failure-mode-and-effects analysis | An analytical approach for identifying process problems by prioritizing failure modes and their causes. |
Multivariate study | A study that samples the process as it operates and, by statistical and graphical analysis, that identifies the important controlled and uncontrolled (i.e., noise) variables. |
Design of experiments | A method of experimentation that identifies, with minimum testing, how key process input variables affect the output of the process. |
Control plan | A document that summarizes the results of a Six-Sigma project and aids the operator in controlling the process. |
18.3.3 How Do We Develop Process Understanding?
Consistent with the FDA (2004) definition of process understanding noted previously in this chapter, we see in Fig. 18.3 that a critical first step in developing process understanding is to recognize that process understanding is related to process variation. As you analyze process variation and identify root causes of the variation, you increase your understanding of the process. Process risk is an increasing function of process variation and a decreasing function of process understanding. Increasing process understanding reduces process risk and increases compliance.
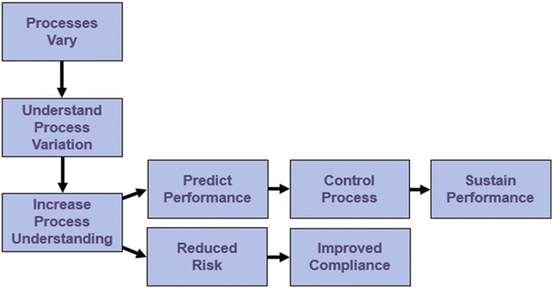

Fig. 18.3
Developing and using process understanding
In Fig. 18.4 we see that analyzing the process by combining process theory and data (measurements and observations, experiments and tribal knowledge in the form of what the organization knows about the process). Science and engineering theory when interpreted in the light of data enhances process understanding and results in more science and engineering being used in understanding, improving and operating the process.
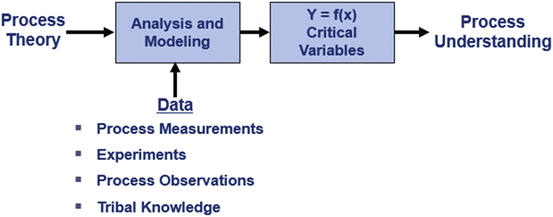

Fig. 18.4
Routes to process understanding
The integration of theory and data produces a process model, Y = f(X), and identifies the critical variables that have a major effect on process performance. Fortunately there are typically only 3–6 critical variables. This finding is based on the Pareto principle (80 % of the variation is due to 20 % of the causes) and experience of analyzing numerous processes in a variety of environments by many different investigators (Juran and DeFeo 2010).
18.3.4 What Tools Do We Use to Develop Process Understanding?
Process analysis is strongly data based, creating the need for data-based tools for the collection and analysis of data and knowledge-based tools that help us collect information on process knowledge (Fig. 18.5 and Table 18.4). We are fortunate that all the tools needed to develop process understanding described above are provided by QbD and Process Analytical Technology (FDA 2004) and Lean Six Sigma methodologies (Snee and Hoerl 2003; Snee 2007).
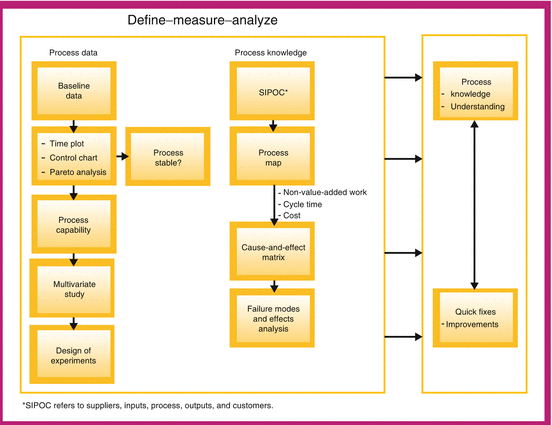

Fig. 18.5
Tools for developing process understanding
Table 18.4
Process understanding leads to improved process performance: some examples
Problem | New process understanding | Result of improvements based on new process understanding |
|---|---|---|
Batch release takes too long | Batch record review system flow improved. Source of review bottleneck identified. | Batch release time reduced 35–55 % resulting in inventory savings of $5MM and $200 k/year cost reduction |
Low capacity not able to meet market demand | Yield greatly affected by media lot variation. New raw material specifications needed. | Yield Increased 25 % |
Batch defect rate too high | Better mixing operation needed including: methods and rate of ingredient addition, revised location of mixing impeller, tighter specs for mixing speeds and times and greater consistency is blender set-up. | Defect rate significantly reduced saving $750 k/year |
Process interruptions too frequent | Root cause was Inadequate supporting systems including, lack of spare parts, missing batch record forms and lack of standard operating procedures. | Process interruptions reduced 67 % saving $1.7MM/year |
Report error rate too high | Report developer not checking spelling, fact accuracy and grammar. | Error rate reduced 70 % |
It all starts with a team which includes a variety of skills including formulation science, process engineering, data management and statistics. In my experience Improvement teams often have limited formulation science and data management skills. Process knowledge tools include the process flow chart, value stream map, cause and effect matrix and failure modes and effects analysis (FMEA).
The data-based tools include design of experiments, regression analysis, analysis of variance, measurement system analysis and statistical process control. The DMAIC (Define, Measure, Analyze, Improve and Control) process improvement framework and its tools are particularly useful for solving process problems. A natural by-product of using DMAIC is the development of process knowledge and understanding, which flow from the linking and sequencing of the DMAIC tools. Development of process understanding is built into the method (Fig. 18.5).
18.4 Design Space
Although all the building blocks of QbD are important, the creation and use of the design space is arguably the most important aspect of QbD. The design space is the
Multidimensional combination and interaction of input variables (e.g., material attributes) and process parameters that have been demonstrated to ensure quality.
The relation between the knowledge, design and control spaces are shown schematically in Fig. 18.6. A process can have more than one control space. The Control Space is the region or point in the design space at which the process is operated. This space is also sometimes referred to as the Normal Operating Region (NOR). A process can have more than one control space within the design space.
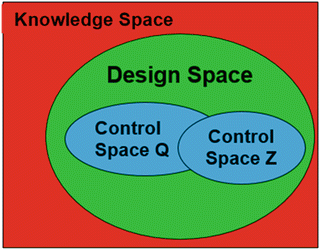

Fig. 18.6
Predictor variable spaces—knowledge, design and control
A key question is how to create the design space, particularly when products are often locked into a design space before the process is well understood. The following two-phase approach is recommended:
Create the design space during the development phase by focusing on minimizing risk and paying close attention to collecting the data that are most critically needed to speed up development and to understand the risk levels involved
After the process has been moved into manufacturing, collect data during process operation to refine the process model, design space, and control space as additional data become available over time.
Continued Process Verification (CPV) from Stage 3 of the FDA Process Validation Guidance (FDA 2011) is very effective in implementing the second phase of this approach. CPV and process monitoring is an important building block of QbD and will be discussed in greater detail later in this chapter.
The following examples illustrate the concepts behind the design space. Fundamental to the construction of the design space is having a quantitative model, Y = f(X), for the product or process being studied. Figure 18.7 shows a contour plot for dissolution (spec > 80 %) and friability (spec < 2 %) as a function of two process parameters. We find the combination of process parameters that will satisfy both the dissolution and friability specifications simultaneously by overlaying the contour plots as shown in Fig. 18.8. This approach, referred to as the Overlapping Means Approach (OMA) by Peterson and Lief (2010) will be discussed later in further detail. The location of the desired control space can also be found using mathematical optimization techniques (Derringer and Suich 1980).
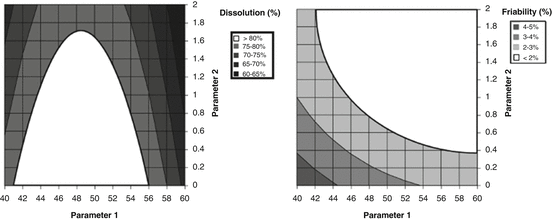
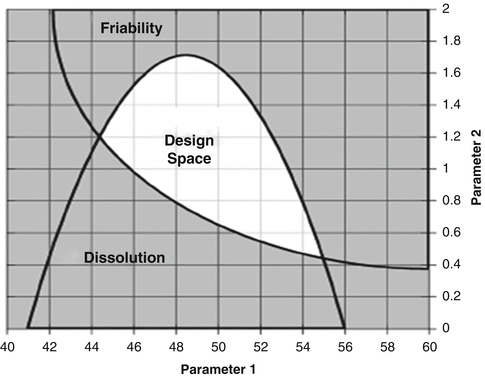

Fig. 18.7
Contour plots of dissolution and friability as a function of process parameters 1 and 2

Fig. 18.8
Design space comprised of the overlap region of ranges for friability and dissolution
Figure 18.9 shows another example of overlaid contour plots being used to identify the combinations of particle size and excipient concentration that will meet the dissolution specifications. This plot makes it easy to see how the design space (white area) relates to the variation in the process variables. The design space has more flexibility with respect to excipient concentration than particle size.
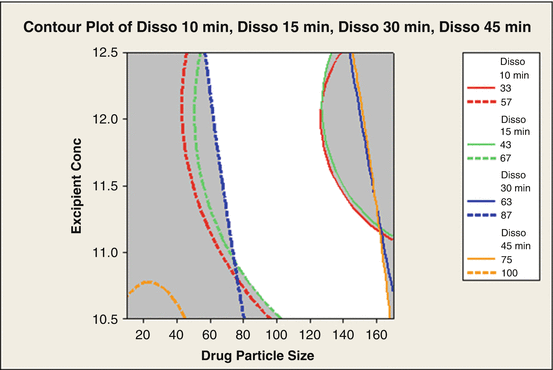

Fig. 18.9
Design space region where product will be in specifications
18.4.1 Finding the Critical Variables
Product and process understanding are fundamental to QbD and the development of the model
 which is used to create the design space and create the process control methodology. The question is how to create the process model quickly without missing any important variables. Getting the right set of variables (i.e., critical process parameters, input variables such as raw-material characteristics and environmental variables) in the beginning is critical. Sources of variability and risk can be obtained in several ways. Interactions between raw-material characteristics and process variables are ever-present and more easily understood with the use of statistically designed experiments.

Figure 18.10 contains the critical elements of the approach. Identifying the critical variables often begins what is called “tribal knowledge,” meaning what the organization knows about the product and process under study. This information is combined with the knowledge gained in development and scale-up, a mechanistic understanding of the chemistry involved, literature searches, and historical experience. The search for critical variables is a continuing endeavor throughout the life of the product and process. Conditions change, and new knowledge is developed, thereby potentially creating a need to refine the process model and its associated design and control spaces.
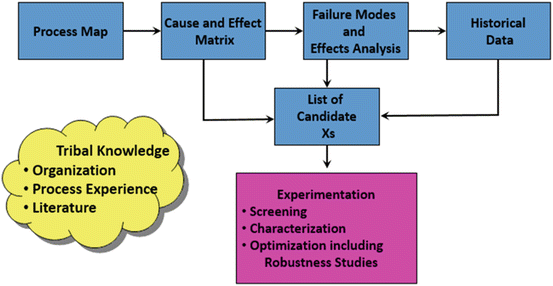

Fig. 18.10
Developing the list of candidate variables (Xs)
The resulting set of variables are subsequently analyzed using a process map to round out the list of candidate variables, the cause-and-effect matrix to identify the high-priority variables, and the FMEA to identify how the process can fail. This work will identify those variables that require measurement system analysis and those variables that require further experimentation (Hulbert et al. 2008).
Identifying potential variables typically results in a long list of candidate variables, so a strategy for prioritizing the list is needed. In the author’s experience and that of others, the DOE-based strategy-of-experimentation approach (see Fig. 18.11), developed at DuPont Company in Wilmington, DE, is a very effective approach (Pfeiffer 1988). Developing an understanding of the experimental environment and matching the strategy to the environment is fundamental to this approach. A three-phase strategy (i.e., screening, characterization, and optimization) and two-phase strategy (i.e., screening followed by optimization and characterization followed by optimization) are the most effective. In almost all cases, an optimization experiment is run to develop the model for the system that will be used to define the design space and the control space.
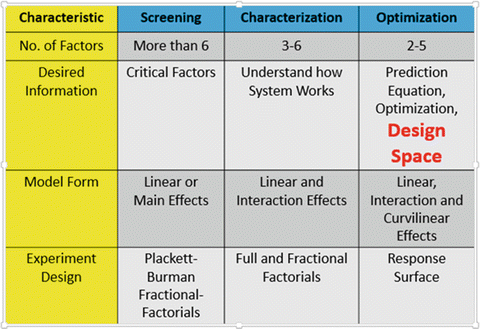

Fig. 18.11
Comparison of experimental environments
The confirmation (i.e., validity check), through the experimentation model used to construct the design space and control space is fundamental to this approach. Confirmation experiments are conducted during the development phase. The model is confirmed periodically as the process operates over time. This ongoing confirmation is essential to ensure that the process has not changed and that the design and control spaces are still valid. The ongoing confirmation of the model happens during the second phase of the development process, as previously described.
The screening—characterization—optimization (SCO) strategy is illustrated by the work of Yan and Le-he (2007) who describe a fermentation optimization study that uses the screening followed by optimization strategy. In this investigation 12 process variables were optimized. The first experiment used a 16-run Plackett-Burman screening design (1946) to study the effects of the 12 variables. The four variables with the largest effects were studied subsequently in a 16-run optimization experiment. The optimized conditions produced an enzyme activity that was 54 % higher than the operations produced at the beginning of the experimentation work.
< div class='tao-gold-member'>
Only gold members can continue reading. Log In or Register to continue
Stay updated, free articles. Join our Telegram channel

Full access? Get Clinical Tree


