FIGURE 34-1 Pulmonary vein ectopic foci. Twelve-lead ECG of a patient in SR with intermittent ectopy from the LSPV (blue arrows).
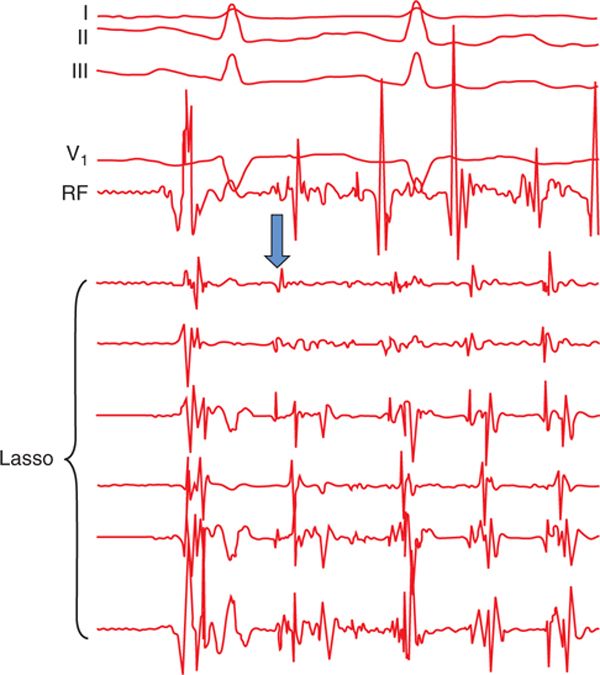
FIGURE 34-2 Pulmonary vein foci initiating AF. After the first beat of SR, a firing PV ectopic focus is observed in the Lasso catheter (blue arrow). This PV signal is early compared to the other intracardiac signals, and subsequently initiates AF. The PVs in patients with AF have distinctive electrophysiological properties such as short effective refractory periods, with decremental and slow conduction properties compared with the LA and patients without AF, which explain their arrhythmogenic role in AF.2
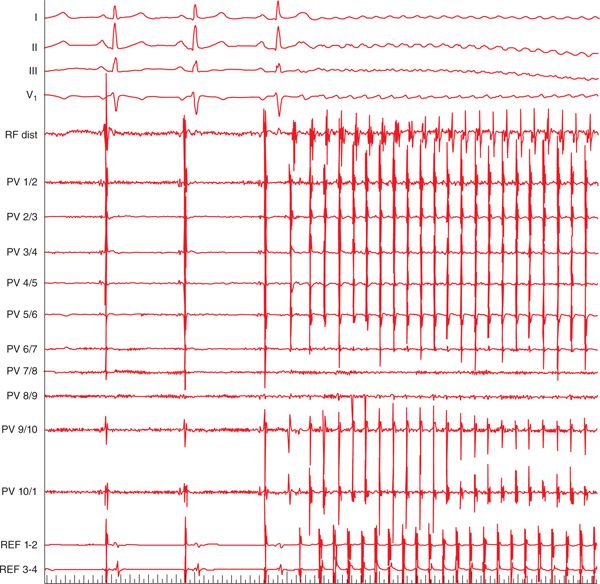
FIGURE 34-3 PV foci initiating AF in a patient with previous incomplete PV isolation. In the first three beats of SR, large and sharp PV potentials are seen following the smaller and blunt atrial signals in the PV catheter and P wave, indicative of persisting LA and PV connection. Immediately after the third sinus beat, a continuous burst of PV activity is observed, revealing it as the source of tachycardia and initiation of AF. The earliest signal during ectopic activity is seen in the PV catheter, followed by the RF distal electrode and coronary sinus catheter. Abbreviations: REF, reference (coronary sinus), speed 25 mm/s.
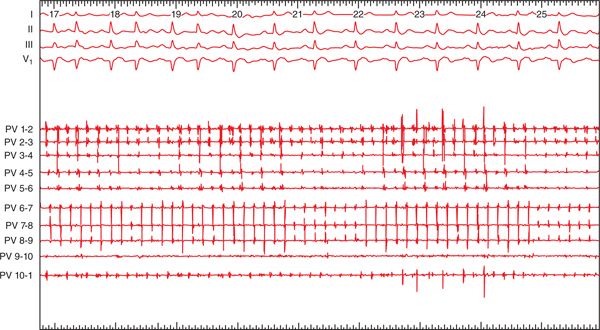
FIGURE 34-4 PV tachycardia from the LSPV. Note the broad and notched P-wave morphology in V1.6 The Lasso catheter positioned in the LSPV recorded PV ectopic activity at a much faster rate compared to the surface ECG. Ablation and isolation of the LSPV led to conversion of the tachycardia to SR (speed 25 mm/s).
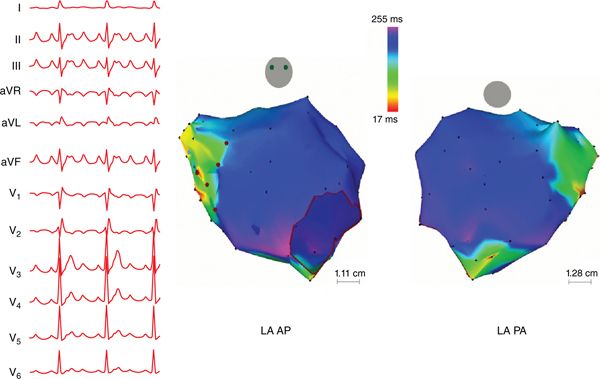
FIGURE 34-5 PV tachycardia from the RSPV. This patient presented for a repeat ablation for recurrent AT. (Left) Twelve-lead ECG of the tachycardia demonstrates tall and narrow P waves in leads II, III, and aVF without any notching in lead II, an amplitude ratio in lead III<II, and a short duration of positive phase in V1, consistent with a tachycardia originating from the RSPV. (Right) A focal source with centrifugal activation was detected from CARTO 3-dimensional electroanatomical mapping (Biosense Webster, Diamond Bar, CA), emanating from the RSPV, which had reconnected despite previous isolation.
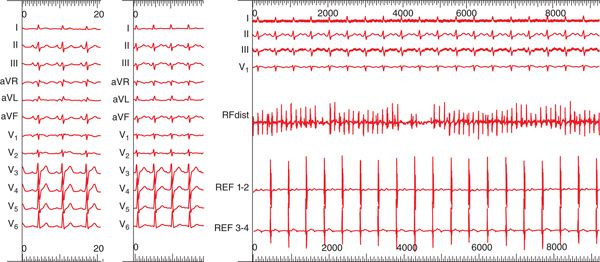
FIGURE 34-6 Pseudosinus rhythm. (Left) Twelve-lead ECG of the patient in SR. (Middle) Twelve-lead ECG of the patient in tachycardia. (Right) “Pseudosinus rhythm” on surface ECG due to underlying PV tachycardia originating from the RSPV. Rapid activity is observed in the RF distal electrode positioned in the RSPV, with delayed conduction to the LA (REF = reference, coronary sinus), giving the appearance of a regular rhythm. The P-wave morphology of tachycardias arising from the RSPV can be similar to that in SR or from the crista terminalis (however, most RSPV tachycardias change in configuration from a biphasic P wave in SR to positive in tachycardia);9 hence these tachycardias could potentially masquerade as SR. Speed 25 mm/s for all figures.
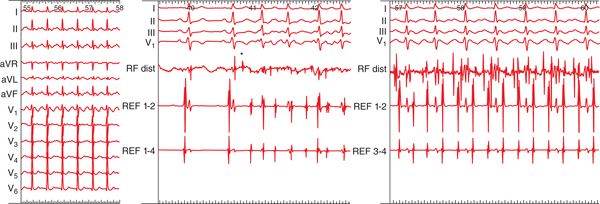
FIGURE 34-7 PV tachycardia from the LSPV. (Left) Twelve-lead ECG of the LSPV tachycardia. Note the P waves are upright in leads II, III, and aVF, negative in aVL, and are broad and notched in lead II, speed 25 mm/s. (Middle) Burst of rapid ectopic activity in the LSPV initiating tachyarrhythmia (black asterisk), speed 50 mm/s. (Right) Intracardiac recordings of the PV tachycardia with rapid activity seen in the distal RF catheter positioned in the LSPV. Delayed and regular activity is seen in the reference catheter (REF = reference, coronary sinus) and surface ECG recordings, speed 50 mm/s.
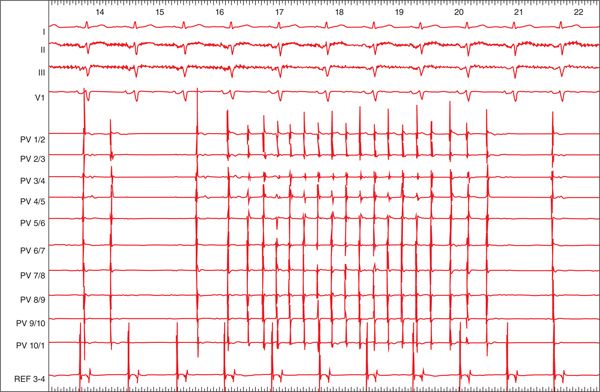
FIGURE 34-8 RIPV tachycardia. Following isolation of the RIPV in this patient with PV tachycardia, a burst of activity is seen within the RIPV, but does not conduct to the LA. Dissociated PV potentials are also observed, speed 25 mm/s.
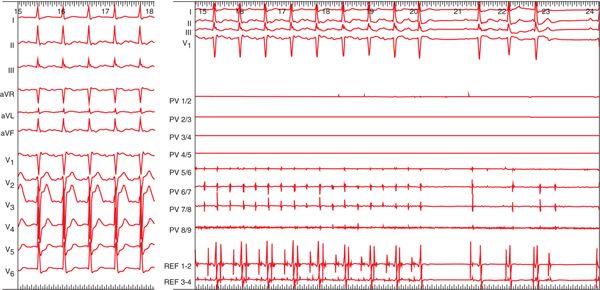
FIGURE 34-9 “Pseudo-flutter.” This patient presented with AT following previous AF ablation with extensive defragmentation in both atria and linear ablation in the roof, mitral isthmus, and cavotricuspid isthmus. (Left) Twelve-lead ECG of the “pseudo-flutter.” Upright P waves are seen inferiorly and are biphasic in V1. (Right) A rapid signal is detected in electrodes PV 5-6. Ablation of the RSPV terminated the tachycardia, speed 25 mm/s. This case illustrates the importance of identifying and targeting the initiating foci and complete isolation of the PVs.
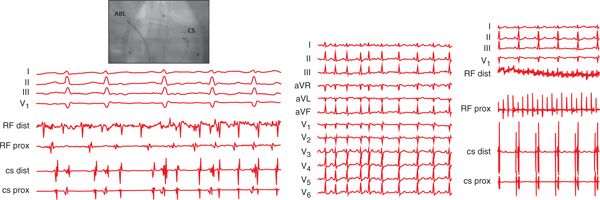
FIGURE 34-10 Focal source of AF. AF due to focal sources such as the PVs, right atrium and coronary sinus ostium have been described.10
Stay updated, free articles. Join our Telegram channel

Full access? Get Clinical Tree


