FIGURE 10-1. The flow-volume curve and volume-time curve from an effort meeting ATS acceptability criteria. The flow-volume curve has a deep inspiratory effort with a sharp complete expiratory flow. The volume-time curve demonstrates both a plateau and an exhalation time of greater than 6 seconds.
Spirometry is recommended in patients over the age of 40 years with any of the following characteristics: presence of risk factors including cigarette smoking or exposure to occupational dust or chemicals, symptoms of breathlessness, chronic sputum production, or chronic cough.2 Once diagnosed with COPD, spirometry can be used on an annual basis to monitor disease state severity. Use of spirometry for asthma is recommended at the time of diagnosis, after the initiation of medications and stabilization of symptoms, during periods of uncontrolled asthma, and at least every 1–2 years to monitor asthma control.3
Spirometry Measurements
Spirometry routinely assesses the following:
- Forced vital capacity (FVC)
- Forced expiratory volume in 1 second (FEV1)
- FEV1/FVC
Forced Vital Capacity
The forced vital capacity (FVC) is the total volume of air, measured in liters, forcefully and rapidly exhaled in one breath (from maximum inhalation to maximum exhalation). When the full inhalation-exhalation procedure is repeated slowly—instead of forcefully and rapidly—it is called the slow vital capacity (SVC). This value is the maximum amount of air exhaled after a full and complete inhalation. In patients with normal airway function, FVC and SVC are usually similar and constitute the vital capacity (VC). In patients with diseases such as COPD, the FVC may be lower than the SVC due to collapse of narrowed or floppy airways during forced expiration. Because of this, some guidelines recommend using the FEV1/SVC ratio to determine the presence of airway obstruction.
Forced Expiratory Volume in 1 Second
The full, forced inhalation-exhalation procedure was already described as the FVC. During this maneuver, the computer can discern the amount of air exhaled at specific time intervals of the FVC. By convention, FEV0.5, FEV1, FEV3, and FEV6 are the amounts of air exhaled after 0.5, 1, 3, and 6 seconds, respectively. Usually, a patient’s value is described in liters and as a percentage of a predicted value based on population normal values adjusted for age, height, and gender.
Of these measurements, FEV1 has the most clinical relevance, primarily as an indicator of airway function. A value greater than 80% of the predicted normal value is considered normal. Normal values are often seen in patients with reversible airway obstruction when the disease is mild or well controlled. Values less than or equal to 80% are abnormal and may indicate airway obstruction.
When the postbronchodilator FEV1/FVC is low, the postbronchodilator FEV1 is used to determine the severity of airway obstruction in COPD. Mild airway obstruction is a FEV1 greater than 80% of the predicted value, moderate airway obstruction is a FEV1 of 50% to 80%, severe is 30% to 50% and very severe is less than 30% of the predicted value.2,4 Both intermittent and mild persistent asthma have a FEV1 greater than 80% the predicted value for the patient. Moderate and persistent asthma have a FEV1 between 60% and 80% of the predicted value; and severe persistent asthma has a FEV1 less than 60% of the predicted value.
FEV6 is a useful and validated measure comparable to FVC. In patients without airway obstruction, FEV6 and FVC would be the same. FEV6 is especially useful for those patients with severe airway obstruction that may take more than double the normal amount of time to exhale a full breath. For patients with severe airway obstruction, using the FEV1/FVC instead of the FEV1/FEV6 may underestimate the severity of airway obstruction. Therefore, many newer spirometers incorporate the FEV1/FEV6 into the report.
FEV1/FVC
The ratio of FEV1 to the FVC is used to estimate the presence and amount of obstruction in the airways. This ratio indicates the amount of air mobilized in 1 second as a percentage of the total amount of movable air. Normal, healthy individuals can exhale approximately 50% of their FVC in the first 0.5 second, about 80% in 1 second, and about 98% in 3 seconds. Patients with obstructive disease usually show a decreased ratio, and the actual percentage reduction varies with the severity of obstruction. In COPD, the American Thoracic Society (ATS)/European Respiratory Society (ERS) and the Global Initiative for Chronic Obstructive Lung Disease (GOLD) define chronic airway obstruction as an FEV1/FVC ratio of less than 70%.
For asthma, the National Asthma Education Prevention Program (NAEPP) evaluates both FEV1/FVC and FEV1 in assessing asthma severity. In children 5–11 years of age, FEV1/FVC greater than 85% predicted is consistent with intermittent asthma, greater than 80% is mild or well-controlled asthma, 75% to 80% is moderate or not well-controlled asthma and less than 75% is severe or very poorly controlled asthma. In children older than 12 and adults, a normal FEV1/FVC can be seen in intermittent and mild persistent disease. In children older than 12 and adults, a reduction in the measured FEV1/FVC of 5% from normal is consistent with moderate persistent asthma. A reduction in the measured FEV1/FVC of greater than 5% from normal is consistent with severe persistent asthma using the following as normal FEV1/FVC values: age 8–19 years is 85%; 20–39 years is 80%; 40–59 years is 75%; and 60–80 years is 70%. However, pulmonary function alone is not sufficient to diagnose or assess asthma severity. Frequency of asthma symptoms and “quick relief” medication use is also necessary to assess asthma severity.
Generally, the FEV1/FVC is normal (or high) in patients with restrictive diseases. In mild restriction the FVC alone may be decreased resulting in a high ratio. Oftentimes in restrictive lung disease, both the FVC and FEV1 are similarly reduced from normal resulting in a normal ratio. The effects of pulmonary disease on some common PFT measures are presented in Table 10-3.
There have been discussions in the pulmonary community to abandon the set cutoff of 70% in favor of using an FEV1/FVC ratio compared to the lower limit of normal to define obstruction. The lower limit of normal is statistically defined as the lower 5th percentile of a reference population and is age corrected. The FEV1/FVC ratio decreases with age and the set cutoff of 70% may overdiagnose COPD in the elderly population who may have age appropriate normal FEV1/FVC ratios of less than 70%. In fact the ATS/ERS endorse this in the interpretation of pulmonary function testing guidelines, separate from the COPD guidelines.8 General acceptance of the lower limit of normal to define COPD is a possibility in the near future.
Forced expiratory flow (FEF) measures airflow rate during forced expiration. While FEV measures the volume of air per specific unit of time at the beginning of expiration, FEF measures the rate of air movement during a later portion. The FEF from 25% to 75% of VC is known as FEF25–75. This test is thought to measure the flow rate of air in the medium and small airways (bronchioles and terminal bronchioles). The FEF25–75 was used as a measure of small airways obstruction, but this relationship has fallen out of favor due to its limited utility.
The flow from 75% to 100% of VC (i.e., the end of expiration) is called alveolar airflow. This parameter may markedly diminish as airways collapse with increased intrathoracic pressure. Such pressure occurs in severe acute asthma when large obstructions are present in terminal bronchioles.
Flow-Volume Curves
Figure 10-2 shows several flow-volume curves where the expiratory flow is plotted against the exhaled volume. As explained earlier, these curves are graphic representations of inspiration and expiration. The shape of the curve indicates both the type of disease and the severity of obstruction.
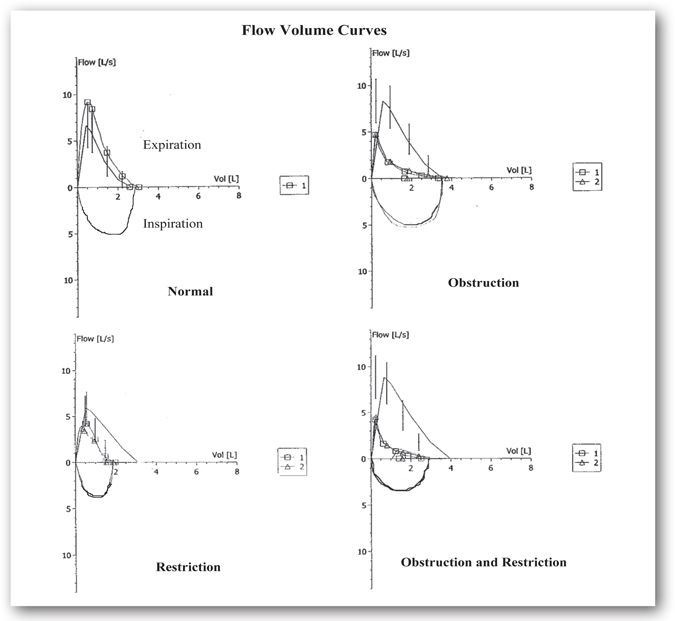
FIGURE 10-2. Flow-volume curves seen with obstructive and restrictive pulmonary diseases. This figure illustrates the flow-volume curves observed for normal adults, obstructive, restrictive, and mixed disease. Flow-volume curve number 1 represents baseline spirometry. Flow-volume curve number 2, if present, is a repeat of the spirometry after a bronchodilator is administered. (Refer to bronchodilator studies under Airway Reactivity Tests.) The curve with the vertical lines represents the predicted normal values. In these examples, there is no improvement in the flow-volume curves after bronchodilator administration. The normal flow-volume curve shows that the curve is larger than expected based on predicted values and is, therefore, normal. Concavity of the expiratory portion of the curve, consistent with limitation in flow compared to the predicted, is illustrated in the obstruction flow-volume curve. The restriction flow-volume curve shows a FVC that is smaller than expected. The predicted volume is approximately 3 L; however, the patient’s FVC is 2 L. In restriction, although the forced expiratory flows are often decreased, there is no concavity such as seen in the obstruction curve. It is important to note that spirometry does not diagnose restriction. The flow-volume loop will demonstrate findings such as this consistent with restriction; however, lung volumes are needed to define restriction. Concavity in the expiratory phase and a decreased FVC volume is consistent with a combination of an obstruction and restriction flow-volume curve.
Obstructive changes result in decreased airflow at lower lung volumes, revealing a characteristic concave appearance. In obstructive cases, the loop size is similar to that of a healthy individual unless there is severe, acute obstruction. Restrictive changes result in a shape similar to that of a healthy individual, but the size is considerably smaller. The flow-volume loop also reveals mixed obstructive and restrictive disease by a combination of the two patterns.
Standardization of Spirometry Measurements
Spirometry is performed by having a person breathe into a tube (mouth piece) connected to a machine (spirometer) that measures the amount and flow of inhaled and/or exhaled air. Prior to performing spirometry, the appropriate technique is explained and demonstrated to the patient. Spirometry results are highly dependent on the completeness and speed of the patient’s inhalation and exhalation, so the importance of completely filling and emptying the lungs of air during the test is emphasized. During spirometry, nose clips are worn to minimize air loss through the nose. The patient is seated comfortably without leaning or slumping and any restrictive clothing (such as ties or tight belts) are loosened or removed. The patient is instructed to take a full deep breath in and then blast the air out as quickly and forcefully as possible and to keep blowing the air out until all the air is exhaled. In general, the effort should last for 6 seconds.
Like most medical tests, spirometry has seen changes over the years in equipment, computer support, and recommendations for standardization. In an effort to maximize the usefulness of spirometry results, the ATS, in conjunction with the ERS developed and updated recommendations for the standardization of spirometry.5,6 These recommendations are intended to decrease the variability of spirometry testing by improving the performance of the test. The recommendations cover equipment, quality control, training and education of people conducting the test, and training of patients performing the test. The recommendations also provide criteria for acceptability and reproducibility of the patient’s spirometry efforts and guidelines on interpreting the spirometry test results. Because the results of spirometry depend on the patient’s effort, at least three acceptable efforts are obtained with a goal of having the two highest measurements of FVC and FEV1 vary by less than 0.15 L.6
Other acceptability criteria include
- Satisfactory start of test (no excessive hesitation or false start)
- No coughing during the first second of the effort
- No early termination of the effort
- No interruption in airflow (e.g., glottic closure)
- No evidence of a leak (mouth not tightly sealed around mouthpiece)
- No evidence of an obstructed mouthpiece (tongue, false teeth)
Spirometry and the Pediatric Population
Children 2–6 years of age are able to perform spirometry with specific equipment and personnel trained to work with this population.7 Although clinical application remains debatable, spirometry for this age population is becoming more prominent in clinical research. Adult criterion for testing is not applicable to this age group. For instance, at this age full exhalation is complete prior to 1 second and therefore the FEV0.5, (forced expiratory volume in 0.5 second) may be more appropriate to measure than the FEV1. Repeatability of two flow curves for the FVC and FEV1 is defined as two measurements within 0.1 L or 10% of each other. Flexibility because of poor repeatability is recommended with the young child. Reference data equations for this age group have not been endorsed by ATS or ERS.
Peak Expiratory Flow Rate
The peak expiratory flow rate (PEFR), or peak flow, occurs within the first milliseconds of expiratory flow and is a measure of the maximum airflow rate. The PEFR can be measured with simple hand-held devices (peak flow meters) and is easily and inexpensively measured at a patient’s home, in the clinician’s office, or in the emergency department. Therefore, PEFR is widely used as an indicator of large airway obstruction and to determine the severity of an asthma exacerbation. PEFR is likely to be used during an acute exacerbation of asthma in the emergency department over the use of spirometry as most patients are unable to perform spirometry during an exacerbation.
The NAEPP recommends using peak flow and/or symptom-based home monitoring plans for asthma patients.3 Long-term, peak flow monitoring is useful to assess asthma medication changes and to identify worsening asthma control. Peak flow monitoring is patient- and clinician-specific and is less useful in preschool and elderly populations. Patients with moderate-to-severe persistent asthma, a history of severe asthma exacerbations, or those who are unable to detect symptoms of worsening asthma are encouraged to check peak flow measurements. For asthma patients not meeting the previous criteria, a symptom-based asthma action plan is sufficient.
Peak flow meters must measure PEFR within an accuracy of ±10% of a reading or ±20 L/min, whichever is greater.3 Peak flow meters are designed for both pediatric and adult patients with PEFR between 60–400 L/min for children and between 60–850 L/min for adults. Because the calibration of peak flow meters cannot be checked, the package insert for a specific device should provide the average life span of the instrument and cleaning and maintenance instructions. Like FEV1, the PEFR has a wide normal range and is based on the patient’s age, height, gender, and race. Ethnicity may also influence PEFR, similar to FEV1, but it is not currently factored into the predicted values for PEFR or FEV1. The charts showing normal values that are included with the peak flow meter are based on population normal values and are not reflective of peak flow readings of a typical asthma patient. Therefore, establishing the patient’s personal best peak flow reading and using this value to monitor and change asthma medications are the most appropriate uses of the peak flow readings. Minicase 1 demonstrates the use of the peak flow meter and establishing a patient’s personal best peak flow value.
Peak Flow Monitoring in a Patient with Asthma
JOEY C. IS A 7-YEAR-OLD BOY with asthma. He is at the pharmacy with his mother to pick up a peak flow meter and a refill of his albuterol. Joey C.’s mother has a hard time telling when Joey C. needs to take his albuterol for worsening asthma symptoms. His doctor would like Joey C. and his mother to learn how to use a peak flow meter and an asthma action plan.
Question: How should Joey C. check his peak flow reading? How can Joey C.’s mother use the readings to help her monitor his asthma control?
Discussion: Peak flow meters are useful objective indicators of large airway function. Peak flow meters are used to monitor (not diagnose) airway obstruction. It is important to provide Joey C. with a pediatric or low range peak flow meter and not an adult or full range meter. By instructing Joey C. on the proper use of the peak flow meter, his mother is able to objectively determine worsening asthma.
Instructions for using a peak flow meter:
- Stand up.
- Move the indicator on the peak flow meter to the end nearest the mouthpiece.
- Hold the meter and avoid blocking the movement of the indicator and the holes on the end of the meter.
- Take a deep breath in and then seal mouth around the mouthpiece.
- Blow out into the meter as hard and as fast as possible without coughing into the meter (like blowing out candles on a cake).
- Examine the indicator on the meter to identify the number corresponding to the peak flow measurement.
- Repeat the test two more times remembering to move the indicator to the base of the meter each time.
- Record the highest value of the three measurements in a diary.
Joey C. demonstrated the proper use of the peak flow meter at the pharmacy and obtained values of 150 L/min, 145 L/min, and 145 L/min.
Establishing the patient’s personal best peak flow:
- Measure the peak flow over a 2-week period of time when asthma symptoms and treatment are stable.
- Readings in the morning and afternoon are ideal.
- The highest value over the 2-week period of time is the personal best.
Joey C. recorded his peak flow for 2 weeks ranging from 120–150 L/min. So, his personal best is identified as 150 L/min.
Using an asthma action plan with peak flow readings:
All patients with asthma need an asthma action plan. An asthma action plan provides directions based on the patient’s symptoms and peak flow readings so the patient knows when to use a quick-relief medication, when to call the doctor, and when to go to the emergency department. Patients are instructed to follow the directions of the plan for the worst indicator, either the peak flow reading or the asthma symptoms. See Figure 10-3 for Joey C.’s asthma action plan.
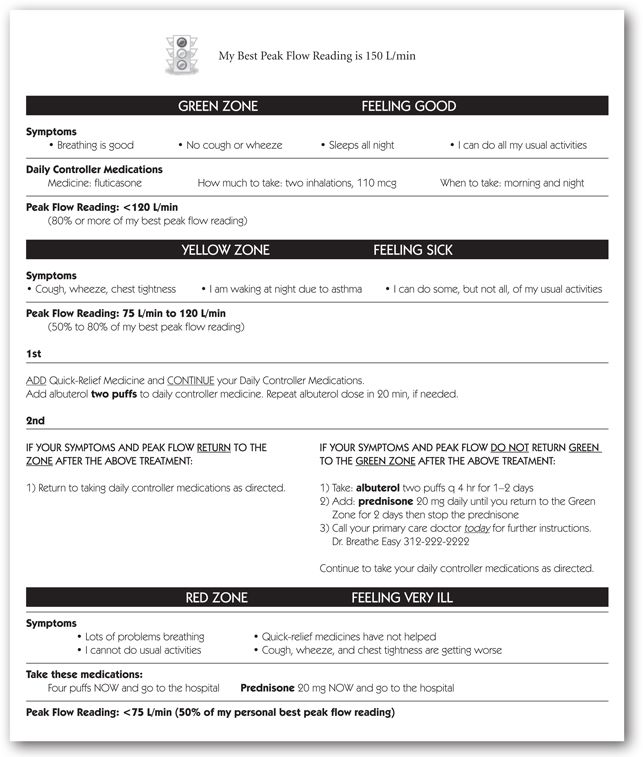
FIGURE 10-3. Asthma self-management action plan.
Body Plethysmography
Body plethysmography is a method used to obtain lung volume measures. Lung volume tests indicate the amount of gas contained in the lungs at the various stages of inflation. The lung volumes and capacities may be obtained by several methods, including body plethysmography, gas dilution, and imaging techniques.9 Different methods can have small but significant effects on the values reported. Gas dilution methods only measure ventilated areas, whereas body plethysmography measures both ventilated and nonventilated areas. Therefore, body plethysmography values may be larger in patients with nonventilated or poorly ventilated lung areas. Computed tomography and magnetic resonance can estimate lung volumes with additional detail of the lung tissue. As body plethysmography is the most commonly used method, this technique will be discussed in more detail.
In body plethysmography, a patient sits in an airtight box and is told to inhale and exhale against a closed shutter. Inside, a mouthpiece contains a pressure transducer. This is done to measure the change in pressure within the box during respiration. It senses the intrathoracic pressure generated when the patient rapidly and forcefully puffs against the closed mouthpiece. These data are then placed into Boyle’s law:
P1 × V1 =P2 × V2
where
P1 = pressure inside the box where the patient is seated (atmospheric pressure)
V1 = volume of the box
P2 = intrathoracic pressure generated by the patient
V2 = calculated volume of the patient’s thoracic cavity
Because temperature (T1 and T2) is constant throughout testing, it is not included in the calculations.
By applying Boyle’s law, this test will provide a measure of the functional residual capacity (FRC) or the volume of gas remaining at the end of a normal breath. Once the FRC is determined, the other lung volumes and capacities can be calculated based on this FRC and volumes obtained in static spirometry. After these data are generated, the patient’s plethysmography results are usually compared to references from a presumed normal population. This comparison necessitates the generation of predicted values for that patient if he or she were completely normal and healthy. Through complex mathematical formulas, sitting and standing height, age, gender, race, barometric pressure, and altitude are factored in to give predicted values for the pulmonary functions being assessed.6 The patient’s results are compared to the percentage of predicted values based on the results of these calculations.
Body Plethysmography and Lung Volumes
Lung volumes include the following:
- Tidal volume (TV)
- Inspiratory reserve volume (IRV)
- Expiratory reserve volume (ERV)
- Residual volume (RV)
These four volumes in various combinations make up lung capacities, which include the following:
- Inspiratory capacity (IC)
- Vital capacity (VC)
- Functional residual capacity (FRC)
- Total lung capacity (TLC)
Tidal Volume, Residual Volume, and Inspiratory and Expiratory Reserve Volumes
The tidal volume (TV) is the amount of air inhaled and exhaled at rest in a normal breath. It is usually a very small proportion of the lung volume and is infrequently used as a measure of respiratory disease. The volume measured from the “top” of the TV (i.e., initial point of normal exhalation) to maximal inspiration is known as the inspiratory reserve volume (IRV). During exhalation, the volume from the “bottom” of the TV (i.e., initial point of normal inhalation) to maximal expiration is referred to as the expiratory reserve volume (ERV). The residual volume (RV) is the volume of air left in the lungs at the end of forced expiration to the bottom of ERV. Without the RV, the lungs would collapse like deflated balloons. In diseases characterized by obstructions that trap air in the lungs (e.g., COPD), the RV increases; the patient is less able to mobilize air trapped behind these obstructions. These four volumes are depicted graphically in Figure 10-4.
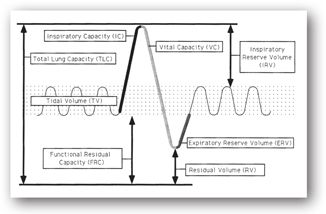
FIGURE 10-4. Lung volumes and capacities—a schematic representation of various lung compartments based on a typical spirogram. (Graphic artwork by Michele Betterton.)
Inspiratory Capacity, Functional Residual Capacity, Slow Vital Capacity, and Total Lung Capacity
The volume measured from the point of the TV where inhalation normally begins to maximal inspiration is known as the inspiratory capacity (IC) and is a summation of TV and IRV. The functional residual capacity (FRC) is the summation of the ERV and RV. It is the volume of gas remaining in the lungs at the end of the TV. It also may be defined as a balance point between chest wall forces that increase volume and lung parenchymal forces that decrease volume. An increased FRC represents hyperinflation of the lungs and usually indicates airway obstruction. The FRC may be decreased in diseases that affect many alveoli (e.g., pneumonia) or by restrictive changes, especially those due to fibrotic pulmonary tissue changes. The slow vital capacity (SVC) is the volume of air that is exhaled as much as possible after inhaling as much as possible. It is a summation of the IRV, TV, and ERV and was described in more detail under spirometry measurements. The total lung capacity (TLC) is the summation of all four lung volumes (IRV+TV+ERV+RV). It is the total amount of gas contained in the lungs at maximal inhalation.
Lung Flow Tests
Compliance, Resistance, and Conductance
Compliance and resistance of the lungs are measures that are currently not commonly used but are important in understanding pulmonary function. The elasticity of the lungs and/or thorax is measured by pulmonary compliance. Compliance is the change in volume divided by the change in pressure. Pulmonary compliance varies with the amount of air contained in the lungs. Therefore, compliance is often normalized relative to the FRC (the ratio of compliance to the FRC). This ratio is also helpful in comparing patients with normal lung function to those with disease. Pressure is related to the effort needed to expand the lungs. When blowing up a balloon, more effort is needed initially when the balloon is deflated and at the end when the balloon is almost fully inflated. This is also true of the lungs as compliance is the lowest at very low or very high lung volumes, more pressure is needed to produce the same change in volume compared to moderate lung volumes where the compliance is the greatest. As the pulmonary tissue nears its maximal elastic stretch, greater pressure is needed to stretch farther.
Decreased compliance is observed in patients with pulmonary fibrosis, edema, atelectasis, and some pneumonia. Decreased compliance is also seen with the loss of pulmonary surfactant (e.g., hyaline membrane disease). Pulmonary compliance increases in conditions where less pressure is needed to inflate the lungs. Because patients with emphysema have obstructed and damaged small airways, the functional RV increases resulting in the appearance of a barrel chest. This is an example of increased pulmonary compliance compared to normal lungs.
When the change in pressure is divided by the change in flow, the result is airway resistance. This value may be useful in differentiating obstructive from restrictive pulmonary disease or from normal pulmonary function. In obstructive diseases, resistance related to blockage of airflow increases. The magnitude of this increase is related to the amount and severity of the obstruction and, because of airway narrowing, resistance may increase during acute asthma attacks. Increases also may be seen in emphysema and bronchitis due to obstructive changes. Decreased resistance is rarely clinically meaningful.
Some clinicians prefer to speak in terms of conductance rather than resistance. Conductance is the inverse of resistance. To compare resistance or conductance from one time or patient to another, the value is divided by the lung volume when the measurement was made. These new normalized values are referred to as the specific airway resistance or specific airway conductance.
Diffusion Capacity Tests
Tests of gas exchange measure the ability of gases to cross (diffuse) the alveolar-capillary membrane and are useful in assessing interstitial lung disease.10 (See Minicase 2.) Typically, these tests measure the per minute transfer of a gas, usually carbon monoxide (CO), from the alveoli to the blood. Carbon monoxide is used because it is a gas that is not normally present in the lung, has a high affinity for Hgb in red blood cells, and is easily delivered and measured. The diffusion capacity may be lessened following losses in the surface area of the alveoli or thickening of the alveolar-capillary membrane. Membrane thickening may be due to infiltration of inflammatory cells or fibrotic changes.
Using Pulmonary Function Tests to Evaluate a Patient with Interstitial Lung Disease
JACOB K. IS A 55-YEAR-OLD MAN who presents to the medicine clinic with complaints of progressive dyspnea on exertion and minimal dry cough for the past 3 months. He has a history of rheumatoid arthritis and was started on methotrexate 4 months ago. The CT of the chest shows diffuse ground glass opacities consistent with active inflammation and some minimal fibrosis at the bases. Jacob K. had a PFT performed over a year ago that was completely normal. A repeat PFT was ordered and included spirometry, lung volumes, and diffusion capacity.
Jacob K.’s PFT reveals the following results and the flow-volume curve in Figure 10-2 labeled Restriction.
Question: How are these PFTs useful in the diagnosis, evaluation, and management of Jacob K.?
Discussion: Looking at Jacob K.’s spirometry in the table below, the FVC is 63.6% of predicted (reduced), FEV1 is 61.6% of predicted (reduced), and FEV1/FVC ratio is 82.2% (normal). This is consistent with a restrictive pattern. A TLC was 55% of predicted (reduced) verifying a restrictive pulmonary defect and the DLCO was only 29% of predicted (normal range is 70% of predicted). These findings are helpful in the diagnosis of interstitial lung disease in the setting of an abnormal CT scan and change from previous normal spirometry. The severity of restriction can also be determined by the amount of decrease in TLC.
Jacob K. was diagnosed with methotrexate-induced lung disease. The methotrexate was discontinued, and he was treated with prednisone. A repeat PFT was performed after 3 months of therapy. The FVC was 75% of predicted, FEV1 was 72% of predicted, and the FEV1/FVC ratio was 80%. The TLC increased to 65%, and the DLCO increased to 40% of predicted. The repeat PFT shows that Jacob K. is responding to pharmacotherapy. He reports improvement in his symptoms. The followup PFT is used to help evaluate the response to discontinuing the offending medication and to establish a new pulmonary function status.
| Prebronchodilator | Postbronchodilator | ||||
| PFT | Predicted | Measured | % Predicted | Measured | % Change |
| FVC | 3.09 | 1.97 | 63.58 | 1.87 | –4.99 |
| FEV1 | 2.62 | 1.62 | 61.60 | 1.53 | –5.45 |
| FEV1/FVC | 82.20 | 81.80 | –0.49 | ||
| TLC | 4.57 | 2.54 | 55.58 | ||
| VC | 3.09 | 1.83 | 59.09 | ||
| RV | 1.50 | 0.71 | 47.74 | ||
| FRC | 2.56 | 1.64 | 64.00 | ||
| DLCO | 22.95 | 6.66 | 29.01 | ||
Stay updated, free articles. Join our Telegram channel

Full access? Get Clinical Tree


