Introduction
The principal physiologic role of the lungs is to make oxygen available to tissues for metabolism and to remove the main byproduct of that metabolism, carbon dioxide. The lungs perform this function by moving inspired air into close proximity to the pulmonary capillary bed to enable gas exchange by simple diffusion. This is accomplished at a minimal workload, is regulated efficiently over a wide range of metabolic demand, and takes place with close matching of ventilation to lung perfusion. The extensive surface area of the respiratory system must also be protected from a broad variety of infectious or noxious environmental insults.
Humans possess a complex and efficient respiratory system that satisfies these diverse requirements. When injury to components of the respiratory system occurs, the integrated function of the whole is disrupted. The consequences can be profound. Airway injury or dysfunction results in obstructive lung diseases, including bronchitis and asthma, whereas parenchymal lung injury can produce restrictive lung disease or pulmonary vascular disease. To understand the clinical presentations of lung disease, it is necessary first to understand the anatomic and functional organization of the lungs that determines normal function.
Checkpoint
1. What are the two principal physiologic roles of the lungs?
2. What are the requirements for successful lung function?
Normal Structure & Function of the Lungs
The mature respiratory system consists of visceral pleura-covered lungs contained by the chest wall and diaphragm, the latter serving under normal conditions as the principal bellows muscle for ventilation. The lungs are divided into lobes, each demarcated by intervening visceral pleura. Each lung possesses an upper and lower lobe; the middle lobe and lingula are the third lobes in the right and left lungs, respectively. At end expiration, most of the volume of the lungs is air (Table 9–1), whereas almost half of the mass of the lungs is accounted for by blood volume. It is a testament to the delicate structure of the gas-exchanging region of the lungs that alveolar tissue has a total weight of only 250 g but a total surface area of 75 m2.
Connective tissue fibers and surfactant serve to maintain the anatomic integrity of this large and complex surface area. The connective tissue fibers are highly organized collagen and elastic structures that radiate into the lungs. These fibers divide segments, invest airways and vessels, and support alveolar walls with a delicate, elastic fibrous network. The multidirectional elastic support provided by this network allows the lung, from alveoli to conducting airways, to support itself and retain airway patency despite large changes in volume.
Surfactant is a complex material produced by type II alveolar cells and composed of multiple phospholipids and specific associated proteins. The physiologic function of surfactant is to enhance the anatomic stability of the lungs. The presence of surfactant covering the alveolar epithelial surface reduces surface tension, allowing expansion of alveoli with a transpulmonary distending pressure of less than 5 cm H2O. In the absence of this surface-active layer, increasing surface tension associated with a reduction of alveolar volume during expiration would collapse alveoli. The distending pressure required to reexpand these alveoli would be greater than normal ventilatory effort could produce.
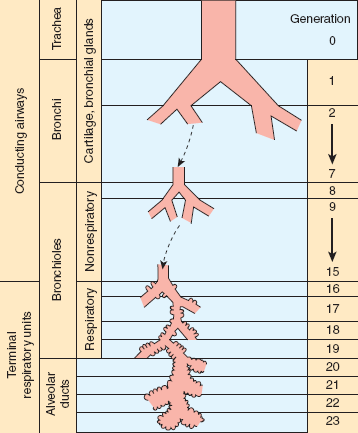
Further anatomic division of the lungs is based primarily on the separation of the tracheobronchial tree into conducting airways, which provide for movement of air from the external environment to areas of gas exchange, and terminal respiratory units, or acini, the airways and associated alveolar structures participating directly in gas exchange (Figure 9–1). The proximal conducting airways are lined by ciliated pseudostratified columnar epithelial cells, are supported by a cartilaginous skeleton in their walls, and contain secretory glands in the epithelial wall. The ciliated epithelium has a uniform orientation of cilia that beat in unison toward the pharynx. This ciliary action, together with the mucus layer produced by submucosal mucous secretory glands, provides a mechanism for the continuous transport of contaminating or excess material out of the lungs. Circumferential airway smooth muscle is also present but, as with secretory glands, is reduced and then lost as the airways branch farther into the lung and diminish in caliber. The smallest conducting airways are nonrespiratory bronchioles. They are characterized by a loss of smooth muscle and cartilage but retention of a cuboidal epithelium that may be ciliated and is not a site of gas exchange. The lobes of the lung are divided into less distinct lobules, defined as collections of terminal respiratory units incompletely bounded by connective tissue septa. Terminal respiratory units are the final physiologic and anatomic unit of the lung, with walls of thin alveolar epithelial cells that provide gas exchange with the alveolar-capillary network.
Figure 9–1
Subdivision of conducting airways and terminal respiratory units. This schematic illustration demonstrates the subdivisions of both the conducting airways and the respiratory airways. Successive branching produces increasing generations of airways, beginning with the trachea. Note that gas-exchanging segments of the lung are encountered only after extensive branching, with concomitant decrease in airway caliber and increase in total cross-sectional area (see Figures 9–2 and 9–3). (Redrawn, with permission, from Weibel ER. Morphometry of the Human Lung. Springer, 1963.)
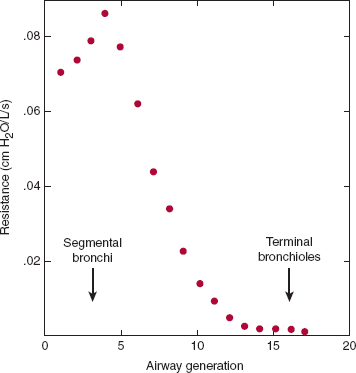
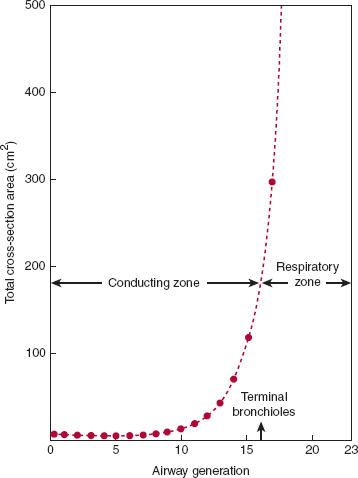
The principal site of resistance to airflow in the lungs is in medium-sized bronchi (Figure 9–2). This seems counterintuitive because one would expect smaller caliber airways to be the major site of resistance. Repetitive branching of the small airways leads to a profound increase in cross-sectional area that does not contribute significantly to airway resistance in healthy individuals (Figure 9–3). Under pathologic conditions such as asthma, in which smaller bronchi and bronchioles become narrowed, airway resistance can increase dramatically.
Figure 9–2
Location of the principal site of airflow resistance. The second- through fifth-generation airways include the segmental bronchi and larger bronchioles. They present the greatest resistance to airflow in normal individuals. The smaller airways contribute relatively little despite their smaller caliber because of the enormous number arranged in parallel. Compare with Figure 9–3. (Adapted, with permission of Elsevier, from Pedley TJ et al. The prediction of pressure drop and variation of resistance within the human bronchial airways. Respir Physiol. 1970;9(3):387.)
Figure 9–3
Airway generation and total airway cross-sectional area. Note the extremely rapid increase in total cross-sectional area in the respiratory zone (compare with Figure 9–1) and the fall in resistance as a consequence of the increase in cross-sectional area increase (compare with Figure 9–2). As a result, the forward velocity of gas during inspiration becomes very low at the level of the respiratory bronchioles, and gas diffusion becomes the chief mode of ventilation. (Redrawn, with permission, from West JB. Respiratory Physiology: The Essentials, 4th ed. Williams & Wilkins, 1990.)
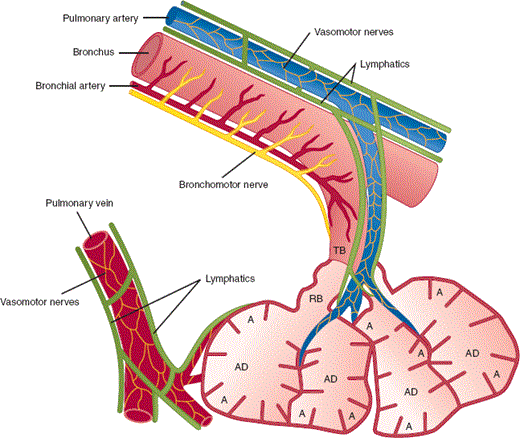
The pulmonary arteries are found in close association with the branching bronchial tree in the lungs (Figure 9–4). Both arterial blood flow and bronchial airflow are actively regulated by changing vessel or airway caliber. The anatomic relationship between arteries and bronchi provides an ideal setting for the continuous matching of ventilation and perfusion to different lung segments.
Figure 9–4
Airway, vascular, and lymphatic anatomy of the lung. This schematic diagram demonstrates the general anatomic relationships of the airways and terminal respiratory units with the vascular and lymphatic systems of the lung. Important points are as follows: (1) The pulmonary arterial system runs adjacent to the bronchial tree, while the draining pulmonary veins are found distant from the airways; (2) the bronchial wall blood supply is provided by bronchial arteries, branches of systemic arterial origin; (3) lymphatics are found adjacent to both the arterial and venous systems and are very abundant in the lung; and (4) lymphatics are found as far distally as the terminal respiratory bronchioles, but they do not penetrate to the alveolar wall. (A, alveolus; AD, alveolar duct; RB, respiratory bronchiole; TB, terminal bronchiole.) (Redrawn, with permission, from Staub NC. The physiology of pulmonary edema. Hum Pathol. 1970;1:419.)
The pulmonary vascular system includes two distinct circuits that distribute blood through the lungs, the pulmonary and bronchial circulations. The right ventricle pumps its entire output of mixed venous blood through pulmonary arteries toward alveolar capillaries. Pulmonary arteries and arterioles are smooth muscle–invested vessels located adjacent to bronchi within the pulmonary bronchovascular bundle. Pulmonary arterioles are very sensitive to alveolar PO2, with a prominent vasoconstrictor response to hypoxia. Hypoxic pulmonary vasoconstriction allows matching of alveolar perfusion to ventilation (see below). Pulmonary veins arise from alveolar capillaries to form vessels that traverse the intralobular septa to return oxygenated blood to the left atrium.
Bronchial arteries that arise from the aorta and intercostal arteries deliver oxygenated blood at systemic pressures to nearly all of the intrapulmonary structures proximal to the terminal bronchioles, including the bronchial tree, hilar structures, pulmonary arteries and veins, pulmonary nervous system and lymphatics, connective tissue septa, and visceral pleura. Most lung tumors receive their blood supply from the bronchial circulation. There are abundant bronchopulmonary anastomoses at the arteriolar and capillary levels that are silent in health but may enlarge in disease to contribute to hemoptysis. Drainage of the bronchial circulation occurs both to the right atrium via the azygos vein and to the left atrium via the pulmonary veins. The latter represents an anatomic shunt of deoxygenated blood, typically representing less than 5% of cardiac output.
Pulmonary lymphatics arise in connective tissue spaces beneath the visceral pleura and in deep plexuses at the junction of the terminal bronchioles and alveoli. Lymphatics do not enter the alveolar peri-interstitial space (Figure 9–4). As a result, fluid in the alveolar interstitium must move to the region of terminal bronchioles to gain access to draining lymphatics. Lymphatic ducts travel principally in the peribronchovascular sheath back to hilar and mediastinal lymph nodes before entering the left thoracic duct or right lymphatic duct. Lymphatic drainage of the pleural space occurs through plexuses investing the costal, diaphragmatic, and mediastinal parietal pleura that are anatomically separate from pulmonary lymphatics.
The lungs are richly innervated with neural fibers from parasympathetic (vagal), sympathetic, and the so-called nonadrenergic, noncholinergic (NANC) systems. Efferent fibers include the following: (1) parasympathetic fibers, with muscarinic cholinergic efferents that mediate bronchoconstriction, pulmonary vasodilation, and mucous gland secretion; (2) sympathetic fibers, whose stimulation produces bronchial smooth muscle relaxation, pulmonary vasoconstriction, and inhibition of secretory gland activity; and (3) the NANC system, with multiple transmitters implicated, including adenosine triphosphate (ATP), nitric oxide (NO), and peptide neurotransmitters such as substance P and vasoactive intestinal peptide (VIP). The NANC system participates in inhibitory events, including bronchodilation, and may function as the predominant reciprocal balance to the excitatory cholinergic system.
Pulmonary afferents consist principally of the vagal sensory fibers. These include the following:
Fibers from bronchopulmonary stretch receptors, located in the trachea and proximal bronchi. Stimulation of these fibers by lung inflation results in bronchodilation and an increased heart rate.
Fibers from irritant receptors, which are also found in proximal airways. Stimulation of these fibers by diverse nonspecific stimuli elicits efferent responses, including cough, bronchoconstriction, and mucus secretion.
C fibers, or fibers from juxtacapillary (J) receptors, are unmyelinated fibers ending in lung parenchyma and bronchial walls and respond to mechanical and chemical stimuli. The reflex responses associated with stimulation of C fibers include a rapid shallow breathing pattern, mucus secretion, cough, and heart rate slowing with inspiration.
Lung Volumes, Capacities, and the Normal Spirogram
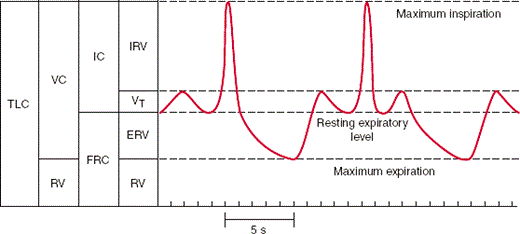
The volume of gas in the lungs is divided into volumes and capacities as shown in the bars to the left of the figure below. Lung volumes are primary: They do not overlap each other. Tidal volume (VT) is the amount of gas inhaled and exhaled with each resting breath. A normal tidal volume in a 70-kg person is approximately 350–400 mL. Residual volume (RV) is the amount of gas remaining in the lungs at the end of a maximal exhalation. Lung capacities are composed of two or more lung volumes. The vital capacity (VC) is the total amount of gas that can be exhaled after a maximal inhalation. The vital capacity and the residual volume together constitute the total lung capacity (TLC), or the total amount of gas in the lungs at the end of a maximal inhalation. The functional residual capacity (FRC) is the amount of gas in the lungs at the end of a resting tidal breath. (IC, inspiratory capacity; IRV, inspiratory reserve volume; ERV, expiratory reserve volume).
The spirogram at the right in the figure is drawn in real time. The first tidal breath shown takes 5 seconds, indicating a respiratory rate of 12 breaths/min. The forced vital capacity (FVC) maneuver begins with an inhalation from FRC to TLC (lasting about 1 second) followed by a forceful exhalation from TLC to RV (lasting about 5 seconds). The amount of gas exhaled during the first second of this maneuver is the forced expiratory volume in 1 second (FEV1). Normal subjects expel approximately 80% of the FVC in the first second. The ratio of the FEV1 to FVC (referred to as the FEV1/FVC or FEV1%) is diminished in patients with obstructive lung disease and increased in patients with restrictive lung disease.
Of all the body’s organs, the lungs have a unique exposure to environmental insults. Nonexertional ventilation in an adult totals about 7500 L of air per day, an amount that is increased substantially with activity. This exposure to an open, nonsterile environment imposes an ongoing risk of toxic, infectious, and inflammatory insults. Furthermore, the pulmonary circulation contains the only capillary bed through which the entire circulating blood volume must flow in each cardiac cycle. As a consequence, the lung is an obligatory vascular sieve and functions as a principal site of defense against hematogenous spread of infection or other noxious influences. Protection of the lungs from environmental and infectious injury involves a set of complex responses capable of providing timely and successful defense against attack via the airways or the vascular bed. As outlined in Table 9–2, it is convenient for discussion purposes to separate these responses into two major categories—nonspecific physical and chemical protections and specific immune structures and actions—all functioning to prevent injury to or microbial invasion of the very large epithelial and vascular area of the lung.
|
Checkpoint
3. What are the roles of the connective tissue and surfactant systems in lung function?
4. What is the role of ciliary action of the respiratory epithelium?
5. Why are medium-sized bronchi rather than small airways the major site of resistance to airflow in the lungs?
6. What are the physiologic functions of the efferent parasympathetic, sympathetic, and NANC neural systems of the lung?
7. What are the categories of afferent vagal sensory receptors?
8. What are the different roles of the pulmonary and bronchial arteries?
9. What sensitive mechanism do the pulmonary arteries have for matching alveolar perfusion with ventilation?
10. What are the components of the nonspecific defense system of the lungs?
11. What are the humoral and cellular components of the specific immune defense system of the lungs?
At rest, the lungs take 4 L/min of air and 5 L/min of blood, direct them within 0.2 μm of each other, and then return both to their respective pools. With maximal exercise, flow may increase to 100 L/min of ventilation and 25 L/min of cardiac output. The lungs thereby perform their primary physiologic function of making oxygen available to the tissues for metabolism and removing the major byproduct of that metabolism, carbon dioxide. The lungs perform this task largely free of conscious control while maintaining PaCO2 within 5% tolerance. It is a magnificent feat of evolutionary plumbing and neurochemical control.
The lung maintains its extremely thin parenchyma over an enormous surface area by means of an intricate supporting architecture of collagen and elastin fibers. Anatomically, as well as physiologically and functionally, the lung is an elastic organ.
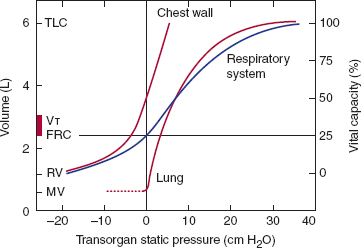
The lungs inflate and deflate in response to changes in volume of the semirigid thoracic cage in which they are suspended. An analogy would be to inflate a blacksmith’s bellows by pulling the handles apart, thus increasing the volume of the bellows, lowering pressure, and causing inflow of air. Air enters the lungs when pressure in the pleural space is reduced by the expansion of the chest wall. The volume of air entering the lungs depends on the change in pleural pressure and the compliance of the respiratory system. Compliance is an intrinsic elastic property that relates a change in volume to a change in pressure. The compliance of both the chest wall and the lungs contribute to the compliance of the respiratory system (Figure 9–5). The compliance of the chest wall does not change significantly with thoracic volume, at least within the physiologic range. The compliance of the lungs varies inversely with lung volume. At functional residual capacity (FRC), the lungs are normally very compliant, approximately 200 mL/cm H2O. Thus, a reduction of only 5 cm H2O pressure in the pleural space will draw a breath of 1 L.
Figure 9–5
Interaction of the pressure-volume properties of the lungs and the chest wall. Resting lung volume (FRC) represents the equilibrium point where the elastic recoil of the lung (tendency to collapse inward) and the chest wall (tendency to spring outward) are exactly balanced. Other lung volumes can also be defined by reference to this diagram. Total lung capacity (TLC) is the point where the inspiratory muscles cannot generate sufficient force to overcome the elastic recoil of the lungs and chest wall. Residual volume (RV) is the point where the expiratory muscles cannot generate sufficient force to overcome the elastic recoil of the chest wall. Compliance is calculated by taking the slope of these pressure-volume relationships at a specific volume. Note that the compliance of the lungs is greater at low lung volumes but falls considerably above two thirds of vital capacity. (Modified from Staub NC. Basic Respiratory Physiology. Churchill Livingstone, 1991.)
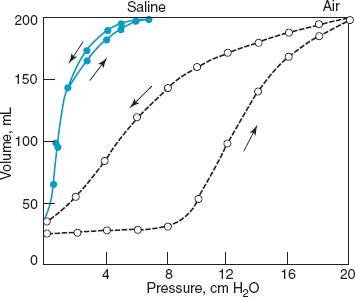
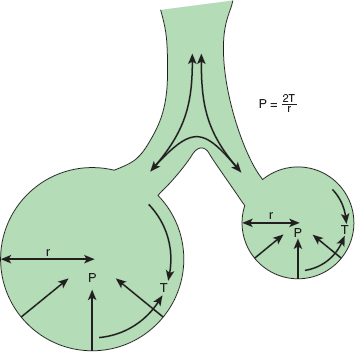
The tendency of a deformable body to return to its baseline shape is its elastic recoil. The elastic recoil of the chest wall is determined by the shape and structure of the thoracic cage. Lung elastic recoil is determined by two factors, tissue elasticity and the forces needed to change the shape of the air-liquid interface of the alveolus (Figure 9–6). Expanding the lungs requires overcoming local surface forces that are directly proportionate to alveolar surface tension. Surface tension is a physical property that reflects the greater attraction between molecules of a liquid than between molecules of that liquid and adjacent gas. At the air-liquid interface of the lung, molecules of water at the interface are more strongly attracted to each other than they are to the air above. This creates a net force drawing water molecules together in the plane of the interface. If the interface is stretched over a curved surface, that force acts to collapse the curve. The law of Laplace quantifies this force: The pressure needed to keep open the curve (in this case represented by a sphere) is directly proportionate to the surface tension at the interface and inversely proportionate to the radius of the sphere (Figure 9–7).
Figure 9–6
Effect of surface forces on lung compliance: a simple experiment demonstrating the effect of surface tension at the air-liquid interface of excised cat lungs. When inflated with saline, there are no surface forces to overcome and the lungs are both more compliant and show no difference (hysteresis) between the inflation and deflation curves. When inflated with air, the pressure required to distend the lung is greater at every volume. The difference between the two curves represents the contribution of surface forces. There is also a pronounced hysteresis to lungs inflated with air that reflects surfactant recruited into the alveolar liquid during inflation (upward arrow), where it further reduces surface forces during deflation (downward arrow). (Reproduced, with permission, from Clements JA, Tierney DF. Alveolar instability associated with altered surface tension. In: Handbook of Physiology, Respiration. Sect. 3, Vol II, Chapt. 69. Washington, DC: American Physiological Society; 1965:1565–1584.)
Figure 9–7
The importance of surface tension. If two connected alveoli have the same surface tension, then the smaller the radius, the greater the pressure tending to collapse the sphere. This could lead to alveolar instability, with smaller units emptying into larger ones. Alveoli typically do not have the same surface tension, however, because surface forces vary according to surface area as a result of the presence of surfactant: the relative concentration of surfactant in the surface layer of the sphere increases as the radius of the sphere falls, augmenting the effect of surfactant at low lung volumes. This tends to counterbalance the increase in pressure needed to keep alveoli open at diminished lung volume and adds stability to alveoli, which might otherwise tend to collapse into one another. Surfactant thus protects against regional collapse of lung units, a condition known as atelectasis, in addition to its other functions. (r, radius of alveolus; T, surface tension; P, gas pressure.)
Surfactant is a mixture of phospholipid (predominantly dipalmitoylphosphatidylcholine [DPPC]) and specific surfactant proteins. These hydrophobic molecules displace water molecules from the air-liquid interface, thereby reducing surface tension. This reduction has three physiologic implications. First, it reduces the elastic recoil pressure of the lungs, thereby reducing the pressure needed to inflate them. This results in reduced work of breathing. Second, it allows surface forces to vary with alveolar surface area, thereby promoting alveolar stability and protecting against atelectasis (Figure 9–7). Third, it limits the reduction of hydrostatic pressure in the pericapillary interstitium caused by surface tension. This reduces the forces promoting transudation of fluid and the tendency to accumulate interstitial edema.
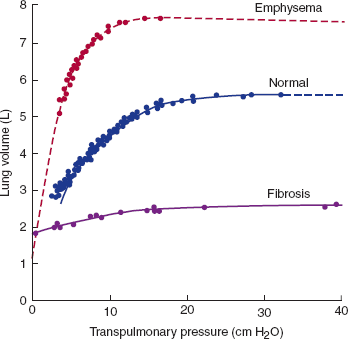
Pathologic states may result from changes in lung elastic recoil related to an increase in compliance (emphysema), a decrease in compliance (pulmonary fibrosis), or a disruption of surfactant with an increase in surface forces (infant respiratory distress syndrome [IRDS]) (Figure 9–8).
Figure 9–8
Static expiratory pressure-volume curves in normal subjects and patients with emphysema and pulmonary fibrosis. The underlying physiologic abnormality in emphysema is a dramatic increase in lung compliance. Such patients tend to breathe at very high lung volumes. Patients with pulmonary fibrosis have very noncompliant lungs and breathe at low lung volumes. (Redrawn, with permission, from Pride NB et al. Lung mechanics in disease. In: Fishman AP, ed. Vol III, Part 2, of Handbook of Physiology. Section 3. Respiratory. American Physiological Society, 1986.)
Inflation of the lungs must overcome three opposing forces: elastic recoil, including surface forces; inertia of the respiratory system; and resistance to airflow. Since inertia is negligible, the work of breathing can be divided into work to overcome elastic forces and work to overcome flow resistance.
Increased elastic forces predominate in two common disorders, diffuse parenchymal fibrosis and obesity. The reduction in lung compliance in fibrotic lung disease, and in chest wall and respiratory system compliance in obesity, increases the work of breathing. Obese subjects also experience increased airflow resistance, largely though not entirely because of their tendency to breathe at lower lung volumes.
Flow resistance depends on the nature of the flow. Under conditions of laminar or streamlined flow, resistance is described by the Poiseuille equation: Resistance is directly proportionate to the length of the airway and the viscosity of the gas, and inversely proportionate to the fourth power of the radius. A reduction by one half of airway radius leads to a 16-fold increase in airway resistance. Airway caliber is, therefore, the principal determinant of airway resistance under laminar flow conditions. Under conditions of turbulent flow, the driving pressure needed to achieve a given flow rate is proportionate to the square of the flow rate. Turbulent flow is also dependent on gas density and not on gas viscosity.
Most of the resistance to normal breathing arises in medium-sized bronchi and not in smaller bronchioles (Figure 9–2). There are three main reasons for this counterintuitive finding. First, airflow in the normal lung is not laminar but turbulent, at least from the mouth to the small peripheral airways. Thus, where flow is highest (in segmental and subsegmental bronchi), resistance is dependent chiefly on flow rates. Second, in small peripheral airways, where airway caliber is the principal determinant of resistance, repetitive branching creates a very large number of small airways arranged in parallel. Their resistance is reciprocally additive, making their contribution to total airway resistance minor under normal conditions. Third, there is a transition to laminar flow approaching the terminal bronchioles as a consequence of increased cross-sectional area and decreased flow rates (Figure 9–3). In the respiratory bronchioles and alveoli, bulk flow of gas ceases and gas movement occurs by diffusion.
Airway resistance is determined by several factors. Many disease states affect bronchial smooth muscle tone and cause bronchoconstriction, producing an abnormal narrowing of the airways. Airways may also be narrowed by hypertrophy (chronic bronchitis) or infiltration (sarcoidosis) of the airway mucosa. Physiologically, the radial traction of the lung interstitium supports the airways and increases their caliber as lung volume increases. Conversely, as lung volume decreases, airway caliber also decreases and resistance to airflow increases. Patients with airflow obstruction often breathe at large lung volumes because higher volumes tend to increase elastic lung recoil, maximize airway caliber, and minimize flow resistance.
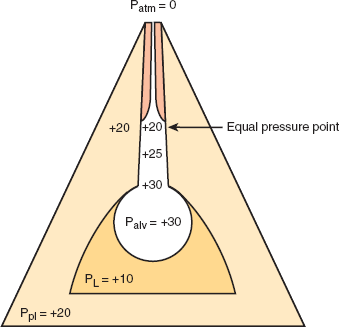
Analysis in terms of laminar and turbulent flow assumes that airways are rigid tubes. In fact, they are highly compressible. The compressibility of the airways underlies the important phenomenon of effort-independent flow; airflow rates during expiration can be increased with effort only up to a certain point. Beyond that point, further increases in effort do not increase flow rates. The explanation for this phenomenon relies on the concept of an equal pressure point. Pleural pressure is generally negative (sub-atmospheric) throughout quiet breathing. Peribronchiolar pressure, the pressure surrounding small, noncartilaginous conducting airways, is closely related to pleural pressure. Hence, during quiet breathing, conducting airways are surrounded by negative pressure that helps to keep them open. Pleural and peribronchiolar pressure becomes positive during forced expiration, subjecting distensible conducting airways to positive pressure. The equal pressure point occurs where the surrounding peribronchiolar pressure equals or exceeds pressure inside the airway, causing dynamic compression of the airways, which leads to instability and potential airway collapse (Figure 9–9).
Figure 9–9
The concept of the equal pressure point. For air to flow through a tube, there must be a pressure difference between the two ends. In the case of forced expiration with an open glottis, this driving pressure is the difference between alveolar pressure (the sum of pleural pressure and lung elastic recoil pressure) and atmospheric pressure (assumed to be zero). Frictional resistance causes a fall in this driving pressure along the length of the conducting airways. At some point, the driving pressure may equal the surrounding peribronchial pressure; in this event, the net transmural pressure is zero. This defines the equal pressure point. Downstream (toward the mouth) from the equal pressure point, pressure outside the airway is greater than the driving pressure inside the airway. This net negative pressure tends to collapse the airway, resulting in dynamic compression. The more forcefully one expires, the more the pressure surrounding collapsible airways increases. Flow becomes effort independent. (Ppl, pleural pressure; PL, lung elastic recoil pressure; Palv, alveolar pressure; Patm, atmospheric pressure.)
The equal pressure point is not an anatomic site but a functional result that helps to clarify different mechanisms of airflow obstruction. Because the driving pressure of expiratory airflow is principally lung elastic recoil pressure, a loss of lung elasticity that reduces recoil pressure without changing pleural or peribronchiolar pressure will lead to dynamic compression at higher lung volumes. The resultant air trapping contributes to symptomatic dyspnea in patients with obstructive lung disease. Patients with emphysema lose lung elastic recoil and may have severely impaired expiratory flow even with airways of normal caliber. The presence of airway disease will increase the drop in driving pressure along the airways and may generate an equal pressure point at even higher lung volumes. Conversely, an increase in recoil pressure will oppose dynamic compression. Patients with pulmonary fibrosis may have abnormally high flow rates despite severely reduced lung volumes.
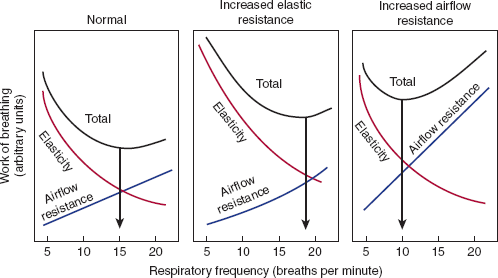
A constant minute ventilation can be achieved through multiple combinations of respiratory rate and tidal volume. The two components of the work of breathing—elastic forces and resistance to airflow—are affected in opposite ways by changes in frequency and depth of breathing. Elastic resistance is minimized by frequent, shallow breaths; resistive forces are minimized by fewer, larger tidal volume breaths. Figure 9–10 shows how these two components can be summed to provide a total work of breathing for different frequencies at a fixed minute ventilation. The set point for basal respiration is that point at which the total work of breathing is minimized. In normal humans, this occurs at a frequency of approximately 15 breaths/min. In different diseases, this pattern is altered to compensate for the underlying physiologic abnormality.
Figure 9–10
Minimizing the work of breathing. These diagrams divide the total work of breathing at the same minute ventilation into elastic and resistive components. In disease states that increase elastic forces (eg, pulmonary fibrosis), total work is minimized by rapid, shallow breathing; with increased airflow resistance (eg, chronic bronchitis), total work is minimized by slow deep breathing. (Redrawn, with permission, from Nunn JF. Nunn’s Respiratory Physiology, 4th ed. Butterworth-Heinemann, 1993.)
The amount of energy needed to maintain the respiratory muscles during quiet breathing is small, approximately 2% of basal oxygen consumption. In patients with lung disease, the energy requirements are greater at rest and increase dramatically with exercise. Patients with emphysema may not be able to increase their ventilation by more than a factor of 2 because the oxygen cost of breathing exceeds the additional oxygen made available to the body.
Oxygen is poorly soluble in blood. At a temperature of 37°C and an oxygen partial pressure of 100 mm Hg (PaO2 = 100), total oxygen dissolved in 100 mL of whole blood is approximately 0.3 mL. Because basal oxygen consumption in the average adult human is approximately 250 mL/min, dissolved oxygen content would be inadequate to meet metabolic demands. Instead, the high oxygen needs of complex internal organs are met by a soluble protein that binds oxygen rapidly, reversibly, and with a high storage capacity, namely, hemoglobin.
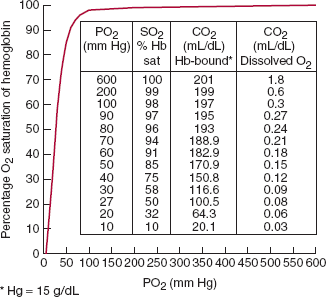
Hemoglobin is a complex tetramer of two alpha and two beta polypeptide chains, each of which contains a heme group with an iron atom in the ferrous form (Fe2+) at its center capable of binding molecular oxygen (O2). Each molecule of hemoglobin can bind four oxygen molecules. Under physiologic conditions, 1 g of fully saturated hemoglobin can carry approximately 1.34 mL of oxygen. Therefore, 100 mL of blood containing 15 g/dL of saturated hemoglobin contains 20.1 mL of O2, nearly 70 times the amount in solution. The conventional way to represent oxygen bound to hemoglobin is the hemoglobin saturation (SO2), the ratio of oxygen bound to hemoglobin divided by the total oxygen binding capacity, typically expressed as a percentage. Note that SO2 alone does not determine oxygen content. Blood oxygen content is the sum of two terms, dissolved oxygen and oxygen bound to hemoglobin. Dissolved oxygen is a linear function of the oxygen partial pressure (PO2) and solubility, while oxygen bound to hemoglobin is the product of three terms, oxygen-carrying capacity, hemoglobin concentration, and hemoglobin saturation (SO2):
CO2 = (0.003 × PO2) + (1.34 × [Hemoglobin] × SO2)
This equation explains why oxygen content and tissue oxygen delivery may be low despite 100% SO2 if hemoglobin concentration is markedly reduced.
Because of its physical chemistry, hemoglobin saturation has a complex relationship with the partial pressure of oxygen. Interactions among the four polypeptide chains in the heme molecule increase overall affinity for oxygen as each oxygen binding site is filled. If we graph PO2 against SO2 to represent the oxyhemoglobin dissociation curve, we see that the relationship is not linear but S-shaped or sigmoidal (Figure 9–11). The curve is very steep in the physiologic range, between 10 and 70 mm Hg PO2, at which point it flattens out. This relationship explains the suitability of hemoglobin for its primary physiologic role, the reversible binding to oxygen with uptake in the lungs and release in the tissues. Above 70 mm Hg, PO2 may vary widely with illness or altitude with minimal effect on oxygen content. From 70 to 40 mm Hg, a fall in PO2 is associated with a proportionally larger increase in the release of oxygen while retaining a relatively high end-capillary PO2 to promote oxygen diffusion into tissues. Below 40 mm Hg, small changes in PO2 continue to release oxygen to tissues, down to very low PO2 levels encountered in some capillary beds.
Inhaled air and pulmonary arterial blood flow are not distributed equally to all lung regions. In healthy individuals, heterogeneous distribution is due principally to two factors: the effects of gravity and the fractal geometry of repetitive branching of airways and vessels.
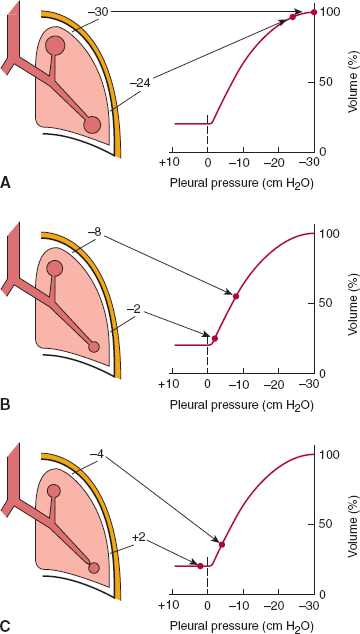
Pleural pressure varies from the top to the bottom of the lung by approximately 0.25 cm H2O/cm. It is more negative at the apex and more positive at the base. The effect is shifted to an anteroposterior distribution in the supine position and is greatly diminished (although not abolished) at zero gravity. Regional ventilation is dependent on regional pleural pressure (Figure 9–12). More negative pleural pressure at the lung apex causes greater expansion of apical alveoli. Because lung compliance is higher at lower lung volumes, ventilation is preferentially distributed to the lower lobes at FRC.
Figure 9–12
Distribution of ventilation at different lung volumes. The effect of gravity and the weight of the lung cause pleural pressure to become more negative toward the apex of the lung. The effect of this change in pressure is to increase the expansion of apical alveoli. A: Total lung capacity. At high lung volumes, the compliance curve of the lung is flat; alveoli are almost equally expanded because pressure differences cause small changes in lung volume. B: Functional residual capacity. During quiet breathing, the lower lobes are on the steep part of the pressure-volume curve. This increased compliance at lower volumes is why ventilation at FRC is preferentially distributed to the lower lobes. C: Residual volume. Below functional residual capacity (FRC), there may be dependent lung units that are exposed to positive pleural pressures. These units may collapse, leading to areas of lung that are perfused but not ventilated. (Reprinted, with permission, from Hinshaw HC et al. Diseases of the Chest, 4th ed. WB Saunders, 1979.)
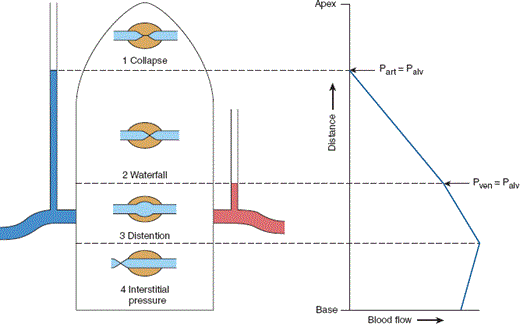
Pulmonary blood flow is a low-pressure system that functions in a gravitational field across 30 vertical centimeters. In the upright position, there is a nearly linear increase in blood flow from the top to the bottom of the lung. Within any horizontal (isogravitational) plane, however, there is significant heterogeneity of blood flow because of the fractal geometry of repetitive branching of vessels, resulting in heterogeneous resistance. Details of distribution are portrayed in Figure 9–13.
Figure 9–13
Effect of changing hydrostatic pressure on the distribution of pulmonary blood flow. Capillary blood flow in different regions of the lung is governed by three pressures: pulmonary arterial pressure, pulmonary venous pressure, and alveolar pressure. Pulmonary arterial pressure must be greater than pulmonary venous pressure to maintain forward perfusion; there are, therefore, three potential arrangements of these variables. Zone 1: Palv > Part > Pven. There is no capillary perfusion in areas where alveolar pressure is greater than the capillary perfusion pressure. Because alveolar pressure is normally zero, this only occurs where mean pulmonary arterial pressure is less than the vertical distance from the pulmonary artery. Zone 2: Part > Palv > Pven. Pulmonary arterial pressure exceeds alveolar pressure, but alveolar pressure exceeds pulmonary venous pressure. The driving pressure along the capillary is dissipated by resistance to flow until the transmural pressure is negative and compression occurs. This zone of collapse then regulates flow, which is intermittent and dependent on fluctuating pulmonary venous pressures. Zone 3: Part > Pven > Palv. Flow is independent of alveolar pressure because the pulmonary venous pressure exceeds atmospheric pressure. Zone 4: Zone of extra-alveolar compression. In dependent lung regions, lung interstitial pressure may exceed pulmonary arterial pressure. In this event, capillary flow is determined by compression of extra-alveolar vessels. The right side of the diagram shows a near-continuous distribution of blood flow from the top of the lung to the bottom, demonstrating that in the normal lung there are no discrete zones. The normal human lung at FRC spans 30 vertical centimeters, half of which distance is above the pulmonary artery and left atrium, and representative pulmonary arterial pressures are 33/11 cm H2O with a mean of 19 cm H2O. There is, therefore, no physiologic zone 1 in upright humans except perhaps in late diastole. Left atrial pressure averages 11 cm H2O and is sufficient to create zone 3 conditions two thirds of the distance from the heart to the apex. However, in patients undergoing positive-pressure mechanical ventilation, or in patients with airway disease creating lung units that fail to empty during the normal respiratory cycle, alveolar pressure is no longer atmospheric. Under conditions of positive end-expiratory pressure (PEEP), Palv may be as high as 15–20 cm H2O. This potentially shifts the entire distribution of pulmonary blood flow. (Adapted and reprinted with permission, from Hughes JM et al. Effect of lung volume on the distribution of pulmonary blood flow in man. Respir Physiol. 1968;4(1):58–72.)
One additional factor that regulates blood flow is hypoxic pulmonary vasoconstriction. The smooth muscle cells of pulmonary arterioles are sensitive to alveolar PO2 (much more so than to arterial PO2). As alveolar PO2 falls, there is arteriolar constriction, an increase in local resistance to flow, and redistribution of flow to regions of higher alveolar PO2. When regionalized, this is an effective mechanism to diminish local blood flow without a significant increase in mean pulmonary arterial pressure. When it affects more than 20% of the pulmonary circulation, such as in the setting of global alveolar hypoxia, widespread pulmonary vasoconstriction increases mean pulmonary arterial pressure and may result in pulmonary hypertension.
The functional role of the lungs is to place ambient air in close proximity to circulating blood to permit gas exchange by simple diffusion. To accomplish this, air and blood flow must be directed to the same place at the same time. Optimum functioning of the respiratory system requires that ventilation be matched to perfusion.
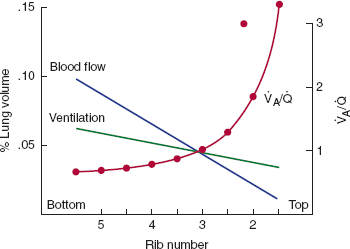
In the normal individual, typical resting alveolar ventilation is approximately 4 L/min, whereas pulmonary artery blood flow is 5 L/min. This yields an overall ratio of ventilation to perfusion of 0.8. As noted above, ventilation and perfusion are both preferentially distributed to dependent regions at rest, although the increase in gravity-dependent flow is more marked with perfusion than with ventilation. Hence, the ratio of ventilation to perfusion is highest at the apex and lowest at the base (Figure 9–14).
Figure 9–14
Changing distribution of ventilation and perfusion down the upright lung. The two straight lines reflect the progressive increases in ventilation and perfusion. The slope is steeper for perfusion. The ratio of ventilation to perfusion is, therefore, lowest at the base and highest at the apex. (Redrawn, with permission, from West JB. Ventilation/Blood Flow and Gas Exchange, 5th ed. Blackwell, 1990.)
Regional alterations in this overall distribution of ventilation and perfusion are referred to as V̇/Q̇ mismatch and are an extremely important phenomenon that underlies the functional impairment of many disease states. A distribution may favor high V̇/Q̇ ratios, with the limiting case being alveolar dead space (ventilation without perfusion, or V̇/Q̇ = ∞) or it may favor low V̇/Q̇ ratios, with the limiting case being a shunt (perfusion without ventilation, or V̇/Q̇ = 0). These two types of V̇/Q̇ mismatch affect respiratory function very differently.
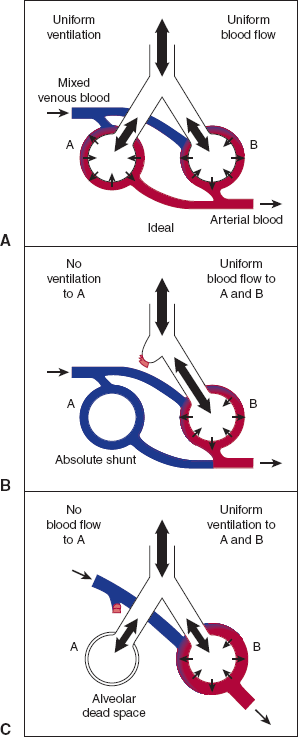
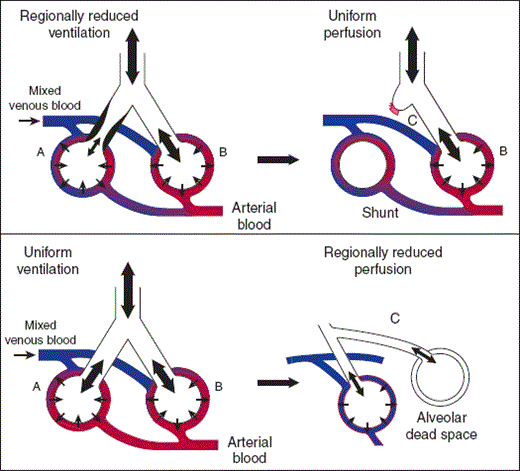
In the normal individual, approximately one third of resting minute ventilation fills the main conducting airways. This is the anatomic dead space; it represents ventilation to areas that do not participate in gas exchange. If participating gas-exchanging regions of the lung are ventilated but not perfused, as may occur in pulmonary embolism, pulmonary vascular disease, or emphysema, these regions will also fail to function in gas exchange. Distributions shifted toward high V̇/Q̇ ratios are referred to as alveolar dead space or wasted ventilation (Figure 9–15, lower panel). Functionally, a shift toward high V̇/Q̇ ratios means that more work of breathing supports ventilation that does not participate in gas exchange, reducing the overall efficiency of ventilation.
Figure 9–15
Three models of the relationship of ventilation to perfusion. In this schematic representation, the circles represent respiratory units, with tubes depicting the conducting airways. The colored channels represent the pulmonary blood flow, which enters the capillary bed as mixed venous blood (blue) and leaves it as arterialized blood (red). Large arrows show distribution of inspired gas; small arrows show diffusion of O2 and CO2. In the idealized case (A), the PO2 and PCO2 leaving both units are identical. See B and C. See text for details. (Redrawn, with permission, from Comroe J. Physiology of Respiration, 2nd ed. Year Book, 1974.)
In the absence of respiratory compensation, the primary effect of a shift toward high V̇/Q̇ ratios will be a rise in arterial PCO2; PaO2 may fall slightly as well. Because the respiratory control center is exquisitely sensitive to small changes in PaCO2, however, the most common integrated response to increasing wasted ventilation is to increase total minute ventilation, thereby maintaining PaCO2 nearly constant. PaO2 remains normal or may be reduced if the fraction of wasted ventilation is large. The A-a ΔPO2 is increased (discussed below). This adaptive response may be done unconsciously, but it presents a clinical problem when the individual can no longer sustain an increased minute ventilation, as in the patient with advanced emphysema.
A shift toward low V̇/Q̇ ratios occurs when regional ventilation is reduced or eliminated but perfusion persists, as might happen with atelectatic lung or in areas of lung consolidation where alveoli are filled with fluid or infected debris (Figure 9–15, mid panel). A shunt is the limiting case of a low V̇/Q̇ area where ventilation is absent and the ratio goes to zero. Pulmonary arterial (mixed venous) blood will then pass to the systemic arterial circulation without coming into contact with alveolar gas. The primary physiologic effect of such a right-to-left shunt is to reduce arterial PO2.
Ventilation/perfusion mismatching commonly occurs between the limiting cases of true shunts and alveolar dead space. The effect on arterial blood gases of shifts in the distribution of V̇/Q̇ ratios can be predicted from the discussion of the limiting cases (Figure 9–16). At the top of Figure 9–16 is a respiratory unit where on one side (B) ventilation has been reduced but perfusion maintained. This defines an area of low V̇/Q̇ ratio. The effect on lung function can be understood by dividing it into an area with a normal V̇/Q̇ ratio (A) and an area of shunted blood (C). The physiologic effect of low V̇/Q̇ areas is similar to the effect of shunts: hypoxemia without hypercapnia. The difference between low V̇/Q̇ areas and true shunts can also be seen in this schematic. Shunted blood comes into no contact with inspired air; therefore, no amount of additional oxygen supplied to inspired air will reverse the fall in systemic arterial PO2. A low V̇/Q̇ area does come in contact with inspired air and can be reversed with increased inspired oxygen.
At the bottom of Figure 9–16 is a respiratory unit where on one side blood flow has been decreased (B) but ventilation maintained. This defines an area of high V̇/Q̇ ratio. The effect on lung function can be understood by dividing the unit into an area with a normal V̇/Q̇ ratio (A) and an area of dead space or wasted ventilation (C). The physiologic effect of high V̇/Q̇ ratios is to increase PCO2, typically leading to increased respiration to return PaCO2 to normal.
Hyperventilation of unaffected lung regions can compensate for the increase in PCO2 from alveolar dead space but cannot compensate for the decrease in PO2 from areas of shunt. The reason is due to the different ways that oxygen and carbon dioxide are carried in blood, and the different relationships between the content and partial pressure of these gases. Because PCO2 and CO2 content are linearly related within the normal physiologic range, increased ventilation to one respiratory unit will reduce the PCO2 and the CO2 content of blood leaving that unit. Overall CO2 content will be the mean of affected and unaffected units. Because PCO2 is proportionate to the CO2 content, the reduced CO2 content of hyperventilated lung regions compensates for elevated content from areas of wasted ventilation. The PCO2 and CO2 content of the mixture track together.
Hyperventilation or increasing inspired oxygen to unaffected lung regions does not compensate for the decrease in PO2 from areas of true shunt. The O2 content of blood is not linearly related to PO2 (Figure 9–11). The sigmoidal shape of the oxyhemoglobin dissociation curve indicates that hemoglobin is nearly maximally saturated at a PO2 of 60. Increasing PO2 from 60 to 600 increases partial pressure 10-fold but O2 content by only 10%. Increasing ventilation or increasing alveolar PO2 to unaffected respiratory units can increase end-capillary PO2 but will not change the O2 content of blood leaving those units. Overall O2 content will be the mean of normal blood oxygen content and shunted, desaturated blood. The reduced oxygen content of the mixture tends to lie on the steep portion of the oxyhemoglobin dissociation curve, with the result that modest decreases in oxygen content lead to large decreases in the PO2.
Arterial blood gases detect major disturbances in respiratory function. One attempt to assess more subtle abnormalities of gas exchange is to calculate the difference between the alveolar and arterial PO2. This is referred to as the A-a ΔPO2 or A-a DO2. The alveolar-capillary membrane permits full equilibration of alveolar and end-capillary oxygen tension under normal V̇/Q̇ matching. There is nonetheless a small A-a ΔPO2 in normal individuals as a result of right-to-left shunting through the bronchial veins and the thebesian veins of the left heart. This accounts for approximately 2–5% of resting cardiac output and leads to an A-a ΔPO2 of 5–8 mm Hg in healthy young adults breathing ambient air at sea level. Increasing the fractional inspired concentration of oxygen (FiO2) increases this value: A normal A-a ΔPO2 breathing 100% oxygen is approximately 100 mm Hg. Normal values increase with age, presumably as a result of closure of dependent airways with consequent shift toward low V̇/Q̇ ratios. Further increases in the A-a ΔPO2 reflect areas of low V̇/Q̇ ratio, including shunting.
The lungs inflate and deflate passively in response to changes in pleural pressure. Therefore, control over respiration lies in control of the striated muscles—chiefly the diaphragm but also the intercostals and abdominal wall—that change pleural pressure.
These muscles are under both automatic and voluntary control. The rhythm of spontaneous breathing originates in the brainstem, specifically in several groups of interconnected neurons in the medulla. Research into the generation of the respiratory rhythm has identified that it originates in the neurons in the pre-Bötzinger complex. Respiratory neurons are either inspiratory or expiratory and may fire early, late, or in an accelerating fashion during the respiratory cycle. Their integrated output is an efferent signal via the phrenic nerve (diaphragm) and spinal nerves (intercostals and abdominal wall) to generate rhythmic contraction and relaxation of the respiratory musculature. The result is spontaneous breathing without conscious input. However, by attending to breathing, the reader may alter this pattern. Eating, speaking, singing, swimming, and defecating all rely on voluntary control over automatic breathing.
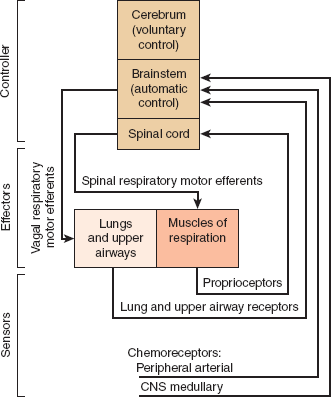
The frequency, depth, and timing of spontaneous breathing are modified by information provided to the respiratory center from both chemical and mechanical sensors (Figure 9–17).
Figure 9–17
Schematic representation of the respiratory control system. The interrelationships among the CNS controller, effectors, and sensors are shown as are the connections among these components. (Redrawn, with permission, from Berger AJ et al. Regulation of respiration. N Engl J Med. 1977;297:92, 138, 194.)
There are chemoreceptors in the peripheral vasculature and in the brainstem. The peripheral chemoreceptors are the carotid bodies, located at the bifurcation of the common carotid arteries and the aortic bodies near the arch of the aorta. The carotid bodies are particularly important in humans. They function as sensors of arterial oxygenation. There is a graded increase in firing of the carotid body in response to a fall in the PaO2. This response is most marked below 60 mm Hg. An increase in the PaCO2 or a fall in arterial pH potentiates the response of the carotid body to decreases in the PaO2.
In humans, the carotid bodies are solely responsible for the increased ventilation seen in response to hypoxia. Bilateral carotid body resection, which has been performed to treat disabling dyspnea and may happen as an unintended consequence of carotid thromboendarterectomy, results in a complete loss of this hypoxic ventilatory drive while leaving intact the response to changes in PaCO2. Central chemoreceptors mediate the response to changes in PaCO2. There is growing evidence that these chemoreceptors are widely dispersed throughout the brainstem. They are separate from the neurons that generate the respiratory rhythm. The increased ventilatory response to elevation in PaCO2 is mediated through changes in chemoreceptor pH. The blood-brain barrier permits free diffusion of CO2 but not hydrogen ions. CO2 is hydrated to carbonic acid, which ionizes and lowers brain pH. Central chemoreceptors probably respond to these changes in intracellular hydrogen ion concentration.
There are a variety of pulmonary stretch receptors located in airway smooth muscle and mucosa whose afferent fibers are carried in the vagus nerve. They discharge in response to lung distention. Increasing lung volume decreases the rate of respiration by increasing expiratory time. This is known as the Hering-Breuer reflex. There are unmyelinated C fibers located near the pulmonary capillaries (hence juxtacapillary [J] receptors). These fibers are quiet during normal breathing but can be directly stimulated by intravenous administration of irritant chemicals such as capsaicin. They appear to stimulate the increased respiratory drive in interstitial edema and pulmonary fibrosis. Skeletal movement transmitted by proprioceptors in joints, muscles, and tendons causes an increase in respiration and may have some role in the increased ventilation of exercise. Finally, there are muscle spindle receptors in the diaphragm and intercostals that provide feedback on muscle force. They may be involved in the sensation of dyspnea when the work of breathing is disproportionate to ventilation.
Under normal conditions in healthy adults, the hydrogen ion concentration in the region of the central chemoreceptors determines the drive to breathe. Changes in chemoreceptor pH are largely determined by the PaCO2. The PaO2 is not an important part of the baseline respiratory drive under normal conditions.
Breathing is stimulated by a fall in the PaO2, a rise in the PaCO2, or an increase in the hydrogen ion concentration of arterial blood (fall in arterial pH).
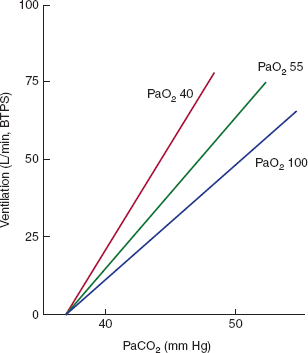
Ventilation increases approximately 2–3 L/min for every 1 mm Hg rise in PaCO2. This response (Figure 9–18) occurs first through sensitization of the carotid body receptor. The carotid body will increase its firing in response to an increased PaCO2 even in the absence of changes in the PaO2. This accounts for approximately 15% of the ventilatory response to hypercapnia. The majority of the response is mediated through pH changes in the region of the central chemoreceptors. Changes in arterial pH are additive to changes in PaCO2. CO2 response curves under conditions of metabolic acidosis have an identical slope but are shifted to the left. The ventilatory response to an increased PaCO2 falls with age, sleep, and aerobic conditioning and with increased work of breathing.
Figure 9–18
Ventilatory response to CO2. The curves represent changes in minute ventilation plotted against changes in inspired PCO2 at different values of alveolar PO2. There is a linear increase in ventilation with increasing PCO2. The rate of increase is greater at lower PO2 values, but the curves begin from a common point where ventilation should cease in response to lowered PCO2. In awake humans, arousal maintains ventilation even when the PCO2 falls below this level; when lightly anesthetized, apnea does occur. In the case of metabolic acidosis, this x-intercept is shifted to the left but the slope of the lines remains virtually unchanged. This indicates that the effects of metabolic acidosis are separate from and additive to the effects of respiratory acidosis. (BTPS, body temperature and pressure, saturated with water vapor.) (Redrawn, with permission, from Ganong WF. Review of Medical Physiology, 22nd ed. McGraw-Hill, 2005.)
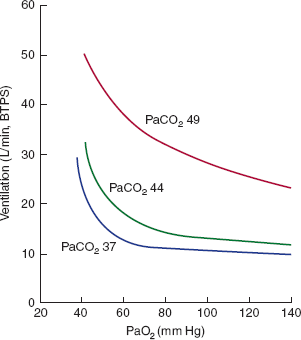
The individual response to hypoxemia is extremely variable. Normally, there is little increase in ventilation until the PaO2 falls below 50–60 mm Hg. At this point, there is a rapid increase in ventilation that reaches its maximum at approximately 32 mm Hg. Below this level, further decreases in PaO2 lead to depression of ventilation. The response to hypoxia is affected by the PaCO2. An increase in the alveolar PCO2 will shift the isocapnic O2 response curve upward and to the right (Figure 9–19).
Figure 9–19
Isocapnic ventilatory response to hypoxia. These curves represent changes in minute ventilation plotted against changes in alveolar PO2 when the alveolar PCO2 is held constant at 37, 44, or 49 mm Hg. When PCO2 is in the normal range (37–44 mm Hg), there is little increase in ventilation until the PO2 is reduced to between 50 and 60 mm Hg. The ventilatory response to hypoxia is augmented at elevated PCO2 levels. The response to hypoxia is not linear, as is the response to an increased PCO2, but resembles a rectangular hyperbola asymptotic to infinite ventilation (at a PO2 in the low 30s) and ventilation without tonic stimulation from the carotid bodies (which occurs above a PO2 of 500 mm Hg). Not shown is the fall in minute ventilation that occurs with extreme hypoxia (PO2 values below 30 mm Hg) as a result of depression of the respiratory center. (Redrawn, with permission, from Ganong WF. Review of Medical Physiology, 22nd ed. McGraw-Hill, 2005.)
A fall in arterial hydrogen ion concentration increases minute ventilation. This response results chiefly from stimulation of the carotid bodies and is independent of changes in PaCO2. There is a response to severe metabolic acidosis in the absence of carotid bodies. It is assumed that this response is mediated by central chemoreceptors; it may represent breakdown of the blood-brain barrier.
Chronic hypercapnia—In patients with chronic hypercapnia, brain pH is returned toward normal by compensatory changes in serum and tissue bicarbonate levels. As a result, central chemoreceptors become less sensitive to further changes in PaCO2. In this instance, a patient’s basal minute ventilation may depend on tonic stimuli from the carotid bodies. If such a patient were given high concentrations of inspired oxygen, carotid body output may be depressed, leading to a fall in minute ventilation. The change in minute ventilation does not fully account for the hypercapnia in response to supplemental oxygen, suggesting that ablation of hypoxic pulmonary vasoconstriction also plays a role.
Chronic hypoxia—Long-term residence at high altitude—or sleep apnea with repeated episodes of severe oxygen desaturation—may blunt the hypoxic ventilatory response. In such individuals, the development of lung disease and hypercapnia may attenuate all endogenous stimuli to breathing. This pattern is seen in patients with obesity-hypoventilation syndrome.
Exercise—Exercise may increase minute ventilation up to 25 times the resting level. Strenuous but submaximal exercise in a healthy individual typically causes no change or only a slight rise in PaO2 as a result of increased pulmonary blood flow and better matching of ventilation and perfusion, with no change or a slight fall in PaCO2. Changes in arterial oxygenation are, therefore, not a factor behind the increased ventilatory response to exercise. The reason for the increased ventilatory response is not known with certainty. Two contributing factors are the increased production of carbon dioxide and increased afferent discharge from joint and muscle proprioceptors.
Checkpoint
12. What are the components of lung elastic recoil? What is the role of surfactant?
13. What three opposing forces must be overcome normally to inflate the lungs?
14. What are four factors affecting airway resistance?
15. What are the components of the work of breathing?
16. What factors regulate ventilation, and what factors regulate perfusion?
17. How are ventilation and perfusion normally matched?
18. What are the effects of changing CO2 and O2 levels on respiratory control?
Pathophysiology of Selected Lung Diseases
Stay updated, free articles. Join our Telegram channel

Full access? Get Clinical Tree


