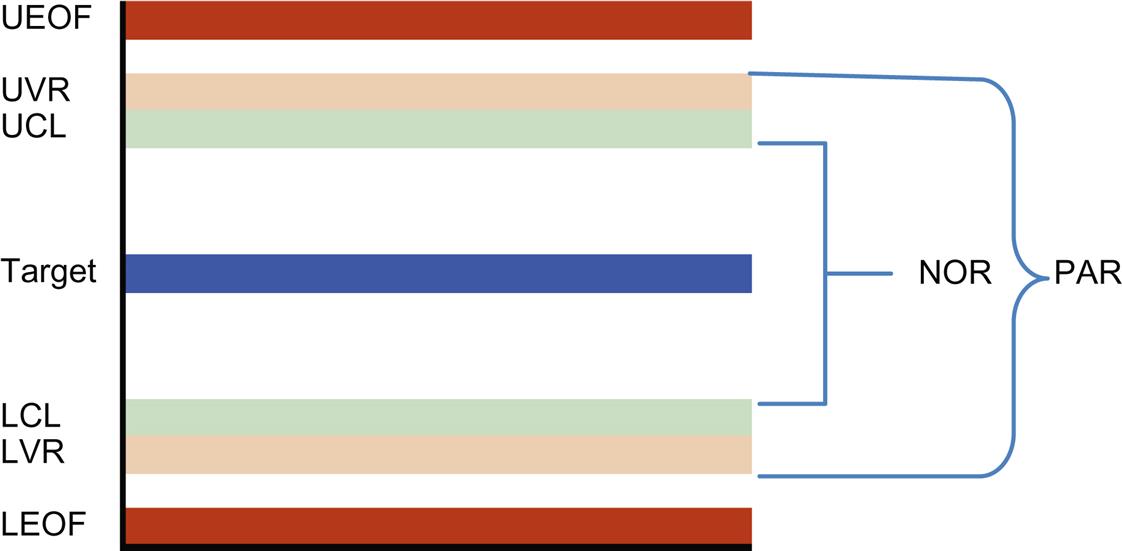
Notice in Fig. 8.1 the Normal Operation Range falls within the Proven Acceptable Range that falls within the Edge of Failure. The target, at the top of the pyramid is in the center of all of the ranges. Fig. 8.2 shows this graphically.
In the past it has been the practice of the industry to run three batches at what is known as the target value. Target is the middle point of all the ranges (Figs. 8.2 or 8.3). Proving the process runs correctly at the midpoint is good but only a small part of what is needed. As discussed by Chapman2 the proven acceptable range or the validation range also needs to be clearly addressed in the protocol.
Stay updated, free articles. Join our Telegram channel

Full access? Get Clinical Tree


