- what prognosis is and what one can use to measure it;
- what a prognostic risk factor is;
- what methods we use to display and quantify prognostic risk factors;
- what makes a good prognostic study and what biases are important.
What is prognosis
Prognosis begins at diagnosis. It concerns ‘the expected course of a disease’ – derived from the Greek ‘knowledge beforehand’ or ‘foretelling’. Prognosis is an essential activity of medicine – as outlined by Sir James Mackenzie in his book Diseases of the Heart (1913):I am rather afraid that our profession as a body does not recognize sufficiently its responsibility in regard to prognosis. When an individual submits himself for an opinion he does so with such implicit confidence that the verdict given may alter the whole tenor of his life (cited in White,)
What outcomes can be used for prognosis?
The outcome of interest will be disease specific – depending on the natural history of the disease and potential alternative outcomes that may arise or develop. For instance, prognosis could relate to the likelihood of:
- mortality/ risk of death – survival;
- recovery or clearance of symptoms of disease or infection – that may be measured clinically or through other investigations (serological, biochemical or radiological);
- recurrence or relapse of disease;
- quality of life – a summary measure based on a quantitative scale that attempts to capture the impact of illness on both physical, psychological and social aspects of well-being;
- physical or other complication of disease – such as disability, dependency and loss of physical/mental function.
For example, as a doctor you may be presented with the following:
| Patient | What will happen |
| An 18-year-old student who develops schizophrenia | What is the likelihood of recovery or relapse – will she be able to complete her degree? |
| A 62-year-old man has moderately severe rheumatoid arthritis | How long will it be before he is bedridden? |
| A 65-year-old woman has localised breast cancer | How long will she live for? Will she die of her cancer or some other cause? |
What is a prognostic risk factor?
Whether the course of disease is accelerated, worsened, or improved may depend on other factors – prognostic risk factors. This is not to be confused with aetiological risk factors (often just called risk factors) that are factors that may increase or decrease the risk of developing disease onset. The key difference is that prognostic factors influence disease progression – whether or not an outcome (outlined above) associated with the disease occurs – and may guide or interact with management; whereas aetiological factors influence whether disease itself occurs. In some diseases risk factors may operate both on disease progression and onset e.g. age, sex, persistent smoking and obesity can influence onset and progression of heart disease; alcohol can cause liver disease and hasten the progression of liver disease in people with chronic hepatitis infections; cannabis is known to increase the risk of relapse in patients with schizophrenia and is hypothesised to increase the risk of schizophrenia like illness developing.
Other risk factors may influence only one of these dimensions e.g. unprotected sexual intercourse effects HIV disease onset but not progression and CD4 count at diagnosis effects progression only.
Displaying, summarising and quantifying prognostic factors
Time is a critical component of prognosis. Therefore, the outcome may be described in terms of a risk over a specified period of time. For example, in cancer epidemiology the risk of death or survival is often described in terms of the proportion of people with a specific cancer that survive or die over a five-year period. This is called either the case fatality rate or the survival rate. These are essentially the same measure so if the annual case fatality rate is 10% then the equivalent survival rate is 90%. This measure should not be confused with the mortality rate which is calculated as the number of deaths from a specific cause divided by the number of individuals at risk of dying (whether or not they already have the cancer). Hence the case fatality rate will always be greater than the mortality rate which is a function of both the incidence of the disease (risk of developing it unless you can present with sudden death) multiplied by the risk of dying.
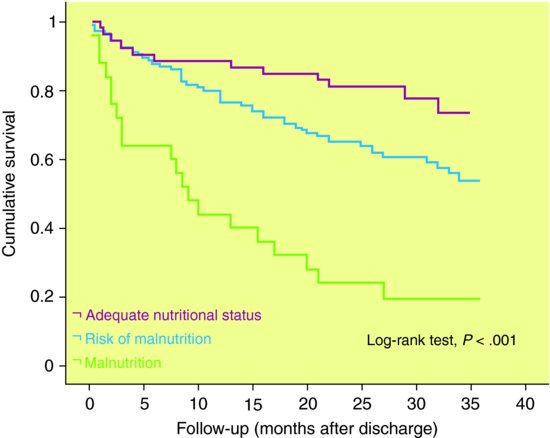
Displaying and comparing time to event data – such as survival or mortality, recovery or relapse – involves a special set of techniques (often collectively known as survival analysis) that take account of how the risk of an event develops and may vary over time. A Kaplan-Meier graph is a traditional method of displaying time to event or survival data and follows a step function – where if there is no outcome at a specific time the line is horizontal and whenever there is a change in survival this is shown as a vertical drop (see Figure 10.1). The advantage of a Kaplan-Meier graph is that patients lost to follow-up (or censored) can also contribute information (up to the point in time they are no longer in the study). This means they are included in the denominator (patients at risk) up to that point. Survival time data are often highly skewed, so conventionally median rather than mean survival is a better summary central measure. The median survival is time by which 50% of the sample has achieved the outcome (survival, recovery, relapse). In Figure 10.1, 50% of the most malnourished sample with heart failure have died by 10 months after discharge; whereas survival for patients assessed as of adequate nutritional status was 89% at 12 months and 74% at 32 months.
Figure 10.1 Kaplan-Meier survival curves for patients diagnosed with heart failure according to nutritional status.
Source: Bonilla-Palomas JL, Gámez-López AL, Anguita-Sánchez MP et al. () Impact of malnutrition on long-term mortality in hospitalized patients with heart failure. Rev Esp Cardiol 64: 752–8.
Whilst mean and median survival may often be very similar, the former is very sensitive to outliers (extreme values). For example, Stephen Hawkings the eminent physicist has had motor neurone disease, a rapidly fatal neurological disorder, for over 40 years, despite the fact that survival after 5 years is usually very rare. Including his data in any analysis would make the mean survival appear much better than the median survival.
In studies where 50% of the sample are unlikely to experience the outcome other summary measures are used – e.g. 80% survival or survival at 5 or 10 years. For example, a study may report that at 5 years 70% of the cohort are still alive or 30% have died. To represent uncertainty around these estimates one can present ranges such as the interquartile range (25th–75th percentile) or best case and worst case scenarios (minimum to maximum).
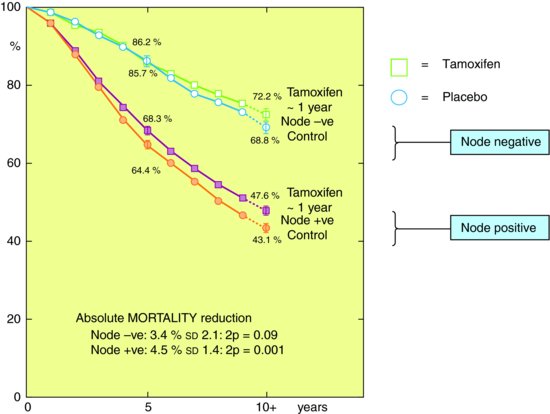
Figure 10.2 shows results from Early Breast Cancer Trialist’s collaborative group subdividing mortality risk by duration of Tamoxifen treatment and nodal status (whether cancer extends to lymph nodes). The figure shows that survival of early breast cancer is worse if axillary nodes are involved, and that Tamoxifen improves survival. In this case the researchers have presented differences in survival by prognostic factors (node status, tamoxifen therapy) in absolute terms though as you will see below it is usually more common to express this in relative terms. Hence the absolute benefit of tamoxifen therapy compared to control was larger (4.5% or 4.5 women for every 100 treated) if you had a positive lymph node than if you didn’t (3.4%). Though overall node positive women are more likely to die.
Figure 10.2 Kaplan-Meier graph for women with breast cancer stratified by whether they had a positive lymph node and whether they received tamoxifen from randomised controlled trials.
Source: From Anon. () Tamoxifen for early breast cancer: an overview of the randomised trials. Early Breast Cancer Trialists’ Collaborative Group. Lancet (1998) 351: 1451–67, with permission from Elsevier.
Stay updated, free articles. Join our Telegram channel

Full access? Get Clinical Tree


