Principles of Molecular Diagnostics in Thyroid Samples
Principles of Molecular Diagnostics in Thyroid Samples
Marina N. Nikiforova
GENERAL PRINCIPLES OF MOLECULAR BIOLOGY
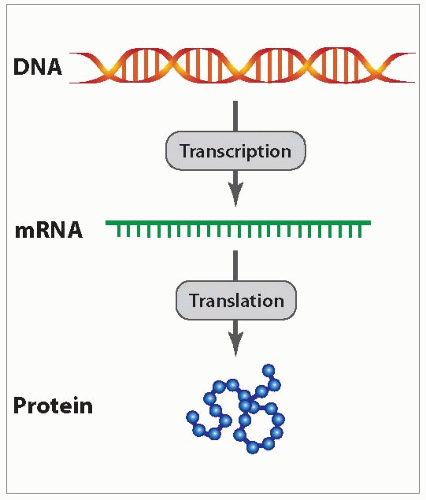
Molecular diagnostics utilize the basic dogma of molecular biology that describes the relationship among DNA, RNA, and protein (Fig. 20.1). All genetic information in human cells is encoded in DNA, which is located in the nucleus of the cell. In order to decode genetic information and translate it into proteins, the DNA is copied (transcribed) into messenger RNA (mRNA) and then translated into protein.
DNA
DNA is a double-stranded molecule consisting of two complimentary strands of linearly arranged nucleotides: adenine (A), guanine (G), thymine (T), and cytosine (C). Two strands of DNA are held together through base pairing between adenine and thymine (A:T pairing) and guanine and cytosine (G:C pairing). As a result, the nucleotide sequence of one DNA strand is complementary to the nucleotide sequence of the other DNA strand.1
FIGURE 20.1 Basic dogma of molecular biology.
The human genome contains approximately three billion base pairs of DNA, which are compactly packed into chromatin by accessory proteins and divided among chromosomes. Each normal somatic cell contains two copies of 22 different chromosomes (one from each parent) and a combination of two sex chromosomes (X and Y).
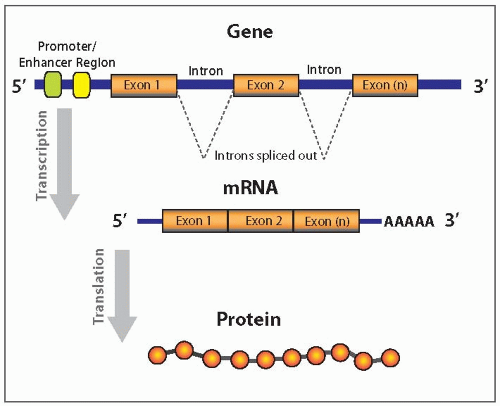
Only a small portion of DNA (<5%) encodes a functional product, such as protein, transfer RNA (tRNA), ribosomal RNA (rRNA), microRNA (miRNA), and other small nuclear RNAs (snRNAs).2 Most of human genome (>95%) is composed of noncoding DNA sequences that are mostly repetitive sequences either randomly repeated (minisatellites and microsatellites) or interspersed (short interspersed nuclear elements (SINEs) and long interspersed nuclear elements (LINEs)). Genes are segments of genomic DNA that encode functional products. Currently, around 25,000 distinct genes have been identified for a haploid genome. Each gene consists of protein-coding sequences, exons, and noncoding sequences, introns, which are located between the coding regions (Fig. 20.2).3 In addition, genes also include regulatory regions, such as promoters and enhancers, which are used to facilitate processes of transcription or gene silencing.
RNA
RNA is a single-stranded molecule that is generally similar to DNA and consists of linearly arranged nucleotides on a sugarphosphate backbone. However, the sugar in RNA is ribose rather than deoxyribose, and thymine is replaced by uracil. Owing to the irregular structure and additional hydroxyl group at the 2′ carbon of ribose, RNA is more vulnerable to chemical and enzymatic hydrolysis and is less stable than DNA.4
There are several types of RNA that are different in their structure, function, and location. Messenger RNA (mRNA) composes 1% to 5% of the total RNA. Each mRNA represents a copy of the genetic information from a specific gene and transfers this information from nucleus to cytoplasm, then serving as a “blueprint” for protein synthesis. The gene sequence is first transcribed into the primary RNA transcript by RNA polymerase. This transcript is an exact complimentary copy of the gene, including all exons and introns. Then, intron portions are spliced out from the primary RNA transcript, which is processed into mRNA and serves as a template for protein synthesis (Fig. 20.2).5 Ribosomal RNA (rRNA) and transfer RNA (tRNA) compose up to 90% of the total cellular RNA. They are predominantly located in the cytoplasm and have important functions in protein synthesis. Other types of RNA include heterogeneous RNA (hnRNA) and small nuclear RNA (snRNA). Recently, several classes of short RNAs have been discovered, one of which is microRNAs (miRNAs). miRNAs are short (19 to 22 nucleotides), single-stranded molecules that function as negative regulators of the coding gene expression.6,7
Protein
Proteins are synthesized on ribosomes in the cell cytoplasm. mRNAs transfer genetic information from nucleus to cytoplasm and bind to the ribosomes. Ribosomes then direct the assembly of polypeptide chains by reading a three-letter genetic code on the mRNA and pairing it with a complementary tRNA that is linked to an amino acid. The three-nucleotide code, called codon, defines which specific amino acid is to be added by the tRNA to the growing polypeptide chain. Following the process of translation, the protein undergoes posttranslational modification, including chain cleavage, chain joining, addition of nonprotein groups, and folding into a complex, tridimensional structure.
FIGURE 20.2 Gene structure and modifications during the process of transcription and translation. Genes consist of protein-coding regions (exons), noncoding regions (introns), and regulatory regions (promoter, enhancer). Mature mRNA has only protein-coding parts of the gene, which are used to build the protein.
Genetic Variations
Although DNA is highly conserved, the possibility of variation still exists. Allelic sequence variation (genetic polymorphism) is a difference in DNA sequences between individuals found in the general population at a frequency >1%. Polymorphism may be associated with a single nucleotide change, known as single nucleotide polymorphism (SNP), or with variation in several repetitive DNA sequences, such as minisatellites or microsatellites, which is known as length polymorphism. Usually, polymorphism is not a cause of the disease, but it results in subtle changes in the function of the protein as therefore is a predisposing factor.
A mutation is a permanent alteration of the DNA sequence of a gene and can be either germline, that is, present in all cells of the body, or somatic, that is, found in tumor cells only. Somatic mutations may provide a selective advantage for cell growth and initiate cancer development, but they are not transmitted to offsprings. In contrast, germline mutations will be passed on to the next generation. Mutations located in a coding sequence of a gene, in the regulatory elements of a gene, or at the intron-exon boundaries may affect transcription and/or translation and result in alteration of the protein structure and function. The sequencing of cancer genomes has revealed that most mutations occur in genes whose products affect signaling pathways that control important cell functions.8 It is estimated that most mutations (90%) result in activation of the gene, typically forming an oncogene (such as RET and RAS), and smaller proportion of mutations (10%) lead to loss of function of a tumor suppressor gene (such as TP53).8
Current list of somatic mutations in cancer can be viewed at the Catalogue of Somatic Mutations in Cancer (COSMIC) database, which documents somatic cancer mutations reported in the literature and identified during Cancer Genome Project (http://www. sanger.ac.uk/genetics/cgp/cosmic/). Not all somatic mutations have a clear biologic effect. Mutations that increase cell growth and survival and positively selected for tumor development are called “driver” mutations. Conversely, genetic alterations that do not confer a selective growth advantage to the cell and do not have functional consequences are defined as “passenger” mutations. They may be coincidently present in a cell that acquires a driver mutation and are carried along during clonal expansion, or occur during clonal expansion of a tumor. It is generally believed that only a small fraction of all mutations in a given tumor is represented by driver mutations. Thus, it has been estimated that a typical human tumor carries on average approximately 80 mutations that change the amino acid sequences of proteins, of which <15 are driver mutations.9
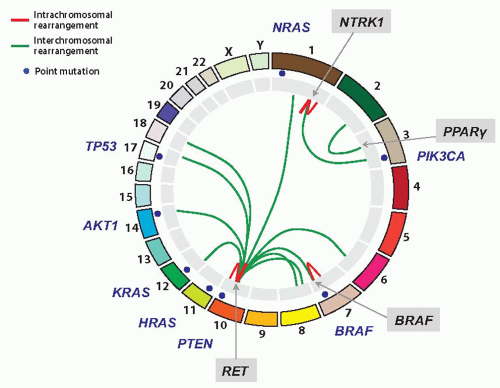
Finally, based on mutation size and structure, mutations can be classified into small-scale mutations (sequence mutations) and large-scale mutations (chromosomal alterations) (Table 20.1). Point mutations in coding sequences are termed nonsynonymous when they produce missense (altered amino acid) or nonsense (premature stop codon) changes. Point mutations that do not lead to amino acid change are termed synonymous or translationally silent mutations. Chromosomal rearrangements are generally less common than point mutations but similarly important in tumorigenesis. They lead to the fusion of DNA fragments from different chromosomal regions, either creating an abnormal fusion protein or leading to aberrant expression of a normal gene. Genetic alterations in thyroid cancer including well-characterized point mutations (such as BRAF, RAS, PIK3CA, TP53, AKT, CTNNB1, and RET) and chromosomal rearrangements (such as RET/PTC, TRK, BRAF/AKAP9, and PAX8/PPARγ), which are known to activate or inactivate important signaling pathways, therefore, are driver mutations. They are depicted in Figure 20.3. As of September 2011, the COSMIC database contains records of 29 genes with somatic mutations and rearrangements detected in different types of thyroid cancer.
Table 20.1 Classification of Mutations Based on Size and Structure
Mutation Type
Description
Small-scale mutations (sequence mutations)
Point mutation
Single nucleotide substitution
Synonymous mutations:
Silent mutation
Substitution of nucleotide(s) that does not change the amino acid
Nonsynonymous mutations:
Missense mutation
Substitution of nucleotide(s) that leads to amino acid change and results in production of abnormal protein
Nonsense mutation
Substitution of a single nucleotide that results in a stop codon leading to truncated protein
In-frame deletion or insertion mutation
Addition or deletion of nucleotides divisible by three, which results in a changed number of amino acids
Frame-shift mutation
Addition or deletion of nucleotide(s) that is not divisible by three and cause a shift in the reading frame of the gene and eventually creating a premature stop codon
Large-scale mutations (chromosomal alterations)
Numerical chromosomal abnormalities
Loss or gain of single or multiple chromosomes or large chromosomal regions
Chromosomal rearrangements (translocations and inversions)
Exchange of chromosome segments between two nonhomologous chromosomes or within the same chromosome, which frequently result in activation of specific genes located at the fusion point
Amplification
Multiplication of chromosomal region leading to increased dosage of the genes located within the region
LOH
Deletion of discrete chromosomal region with the loss of tumor suppressor genes residing in this area
FIGURE 20.3 Ideogram of most common mutations in thyroid cancer. Chromosomes are shown and numbered in the outer ring. Point mutations (blue dots), intrachromosomal rearrangements (red lines), and interchromosomal rearrangements (green lines) are shown.
SAMPLES FOR MOLECULAR ANALYSIS
Molecular diagnosis of thyroid cancer can be performed on various clinical samples, such as fresh or snap-frozen tissue, formalin-fixed paraffin embedded (FFPE) tissue, fine needle aspiration (FNA) samples, blood or buccal swabs. Peripheral blood lymphocytes or cells from buccal swabs are typically used for the detection of germline mutations, for example, RET mutations in familiar medullary carcinoma. For the detection of somatic mutations, fresh or snap-frozen tumor specimens and freshly collected FNA specimens offer an ideal template, providing an advantage over fixed tissue or fixed cells due to the superior quality of isolated nucleic acids.
Detection of point mutations (i.e., BRAF and RAS), loss of heterozygosity (LOH) analysis, and clonality assays require the isolation of DNA. DNA is more stable than RNA and could be easily isolated from various specimens. Although fresh or frozen tissues are always preferable, FFPE specimens could be successfully used and will provide an acceptable quality and quantity of DNA. Ten percent neutral-buffered formalin (NBF) is a fixative that is most widely used. Formalin fixation leads to fragmentation of DNA, and therefore, molecular assays need to be optimized for the amplification of short DNA fragments (250 to 300 bp in length). However, prolonged (>24 to 48 h) fixation in 10% NBF adversely affects the quality of nucleic acids; therefore, specimens should preferably not be fixed for long time. Thyroid and other tissue specimens that were processed using bone decalcifying solution cannot be used for molecular analysis due to extensive DNA fragmentation.10 Similarly, specimens exposed to fixatives containing heavy metals (e.g., Zenker, B5, acid zinc formalin) cannot be used for molecular testing due to inhibition of DNA polymerases and other enzymes essential for molecular assays.
When selecting a sample for molecular testing, a representative H&E slide of the tissue must be reviewed by a pathologist to identify a target and determine the purity of the tumor, that is, proportion of tumor cells and benign stromal and inflammatory cells in the area selected for testing. Manual or laser capture microdissection can be performed using unstained tissue sections under the guidance of an H&E slide to enrich the tumor cell population. The minimum percentage of tumor cells required for molecular testing depends on the methodology being used for analysis. In general, a minimum tumor cellularity of 50% and at least 300 to 500 tumor cells are required for Sanger sequencing.
Thyroid FNA specimens, either freshly collected or fixed, provide a good quality of DNA and are acceptable for testing. Additional information on collecting of thyroid FNA samples is provided in Chapter 21.
RNA is required for the detection of chromosomal rearrangements (i.e., RET/PTC and PAX8/PPARγ), gene expression profiling, and miRNA profiling. It is a less stable molecule than DNA and is easily degraded by various ribonuclease enzymes that are replete within the cell and environment. Therefore, freshly collected or frozen tissue and nonfixed FNA samples are considered to be reliable specimens for these techniques. RNA isolated from FFPE tissue is of poor quality and has to be used with great caution for clinical testing. The best alternative for the detection of rearrangements in FFPE tissue is of fluorescent in situ hybridization (FISH) technique, which provides reliable detection in most cases.
Conventional cytogenetic analysis requires fresh tissue. FISH can be performed on various specimens including fresh tissue sections, touch preps, paraffin-embedded tissue sections, and cytology slides.
COMMON TECHNIQUES FOR MOLECULAR ANALYSIS
Polymerase Chain Reaction
PCR amplification is the most commonly utilized technology in molecular diagnostics. It is a quick, sensitive, and reliable technique for the analysis of a DNA sequence of interest. The principle of PCR is based on exponential and bidirectional amplification of short DNA sequences through the use of oligonucleotide primers.11
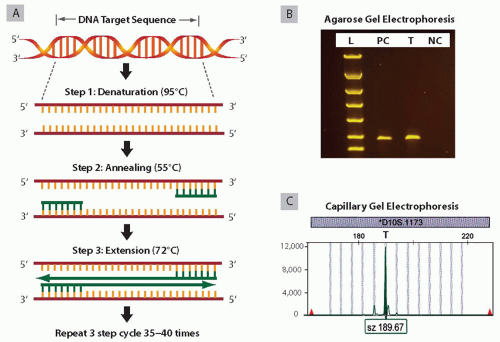
The components of each PCR reaction are the DNA template to be amplified, two primers complementary to the target sequence, four deoxynucleotide triphosphates (dATP, dCTP, dGTP, and dTTP), thermostable DNA polymerase, and MgCl2 mixed in the reaction buffer. The PCR primers are short (20 to 25 nucleotides), single-stranded DNA sequences that hybridize to the 5′-ends of the target DNA. Primers have to be completely complementary to the target DNA sequence in order to achieve sensitive and specific PCR amplification. There are three steps in the PCR cycle (Fig. 20.4A). The first step is DNA denaturation, where the reaction is heated to a high temperature (95°C) to separate the double-stranded DNA into single strands. The second step is the annealing of primers, where the reaction is cooled to 55°C (or a temperature in the range of 50°C to 65°C) to allow primers to attach to their complimentary sequences. The third step is DNA extension, where the reaction is heated to 72°C and DNA polymerase adds specific nucleotides to the attached primers and builds a new DNA strand. These three steps are repeated 35 to 40 times, and each newly synthesized DNA strand serves as a template for further DNA synthesis. This results in the production of 107 to 1011 copies of the DNA region of interest from a single DNA molecule. The PCR product can be visualized by standard gel electrophoresis (i.e., agarose and polyacrylamide) or by capillary gel electrophoresis if the PCR product is labeled with fluorescent dye (Fig 20.4B,C).
Efficiency of PCR amplification depends on the quality of the template, optimal primer design, and conditions for amplification, such as annealing temperature and Mg2+ concentration. PCR amplification of DNA isolated from fresh, frozen tissues allows amplification of long products (up to 3 to 5 kb). However, when dealing with DNA from fixed tissues, reliable amplification can be achieved of only relatively short DNA sequences (100 to 200 bp) due to the degradation of DNA during fixation. Amplification of longer DNA segments (300 to 400 bp) may be successful in some cases but should be generally avoided.
Reverse Transcription-PCR
Reverse transcription-PCR (RT-PCR) is used for the amplification of mRNA or small RNAs (miRNAs). In order to do this, RNA isolated from the tissue sample is converted to complementary DNA (cDNA) using a reverse transcriptase enzyme during a process called reverse transcription. This enzyme has the ability to synthesize cDNA from a single-stranded RNA, which will serve as a template for the subsequent PCR reaction. Initiation of the RT reaction requires primers that can be either nonsequence specific (mixture of random hexamers or oligo-dT primers) or sequence-specific primers designed to bind selectively to the mRNA molecule of interest. RT and PCR amplification can be performed as a two-step process in a single tube or as two separate reactions.12
RT-PCR technique is used for the analysis of gene expression and for the detection of gene rearrangements. Detection of gene expression is based on a measurement of the quantity of mRNA from a specific gene present in the sample relatively to mRNA of a housekeeping gene (e.g., GAPDH and PGK) and is frequently performed by quantitative RT-PCR (qRT-PCR). Detection of gene rearrangements is easier to perform on the RNA level instead of DNA because most of fusion breakpoints are located in large size introns of genes and breakpoint site varies from tumor to tumor. During mRNA processing, the introns are spliced out, leaving the informative coding sequences intact and significantly shortening the product of amplification.
FIGURE 20.4 PCR amplification and amplicon detection. A: Schematic representation of the PCR. B: Example of agarose gel electrophoresis of PCR products. L-DNA ladder (DNA size marker); PC, positive control; T, tumor sample showing amplification product of the expected size; N-negative control with no input of DNA shows no amplification. C: Example of capillary gel electrophoresis of PCR products. Tumor sample amplified with fluorescently labeled primers shows a peak on capillary gel electrophoresis of 190 bp size.
RNA is more difficult to handle in a laboratory, and strict laboratory techniques have to be applied to avoid RNA degradation.13 The amplification of a housekeeping gene has to accompany each RT-PCR reaction to monitor RNA quality and quantity.
Real-time PCR
Real-time PCR is based on principals of conventional PCR amplification but detects and quantifies PCR products in real time as the reaction progresses. Real-time PCR should not be confused with RT-PCR: frequently, the RT-PCR reaction is also performed in real time to measure gene expression or to detect fusion transcripts.
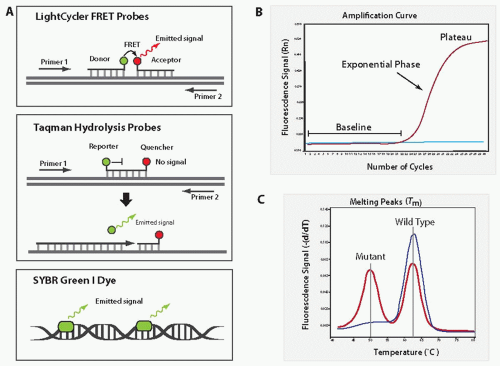
In addition to all components of conventional PCR, real-time PCR utilizes either incorporation of fluorescent molecules (i.e., SYBR Green I) into the PCR product or annealing of fluorescently labeled probes (FRET hybridization probes, TaqMan probes, etc.) to the PCR product (Fig. 20.5A).14 Special thermal cycling instruments (LightCycler [Roche], ABI 7500 [Applied Biosystems], etc.) record the increase in fluorescence generated during amplification of DNA sequences and construct an amplification plot of fluorescence intensity versus cycle number. During the early cycles, the amount of PCR product is relatively low and fluorescence is not strong enough to exceed the baseline. As the PCR product accumulates and becomes detectable, the fluorescence signal will cross the baseline and will increase exponentially (Fig. 20.5B). At the end of the PCR reaction, the fluorescence reaches a plateau as most of the reagents are consumed.
LightCycler real-time PCR (Roche) utilizes fluorescence resonance energy transfer probes (FRET), which bind to the PCR product in a head-to-tail fashion. The 3′-end of one probe is labeled with a donor fluorophore and the 5′-end of a second probe is labeled with an acceptor fluorophore (Fig. 20.5A). When these two probes bind to the specific PCR product, the flourophores come into proximity, transferring energy from donor to acceptor fluorophore. This leads to an increase in fluorescence that is proportional to the amount of amplified product.15 Unlike duallabeled hydrolysis probes (i.e., TaqMan probes), FRET probes are not cleaved during the reaction and can be used for post-PCR fluorescence melting curve analysis. Melting curve analysis exploits the fact that even a single mismatch between the labeled probe and the sequence of interest will significantly reduce the specific melting temperature (Tm), which is defined as the temperature at which 50% of the double-stranded DNA becomes single-stranded. Thus, a probe that is bound perfectly to the target DNA (no mismatch) will separate (melt) at a higher temperature than a probe bound to the target DNA with one or more nucleotide mismatch (Fig. 20.5C). The melting curves are built upon the completion of the PCR reaction by gradual heating of the PCR product and measuring fluorescence at each temperature point. Hybridization probes are commonly used for the quantitation of gene expression and the detection of SNPs and point mutations.
TaqMan probes are most commonly used for real-time PCR or real-time RT-PCR on Applied Biosystems Real-Time PCR platforms (ABI 7300/7500/7900). The TaqMan probe is a short probe complementary to the internal sequence of the target DNA and is labeled at the 5′-end with the reporter fluorophore and at the 3′-end with the quencher fluorophore (Fig. 20.5A). Until two flouorophores are intact, flourescence will not be released. However, during the PCR reaction, the probe will be cleaved by DNA polymerase while building the complimentary DNA strand, resulting in a fluorescent signal increase proportional to the amount of amplified PCR product. TaqMan probes are excellent for quantitative assays and for the detection of fusion transcripts, but they cannot be used for the detection of mutations by melting curve analysis.
Real-time PCR with SYBR Green I fluorescent dye is the most flexible technique and can be performed on any real-time PCR platform. SYBR Green I fluorescent dye binds to double-stranded DNA nonspecifically during each annealing phase (Fig. 20.5A). After the dye is excited by a light source, SYBR green emission is increased proportionally to the amount of product amplified. SYBR Green PCR amplification is used for quantitative and qualitative PCR and requires only one pair of primers. However, because dye binds nonspecifically to DNA as opposed to probes that bind to the internal sequence of the amplified product, the specificity of the detection is lower. Post-PCR melting curve analysis may be used to improve specificity of the SYBR Green PCR format.
FIGURE 20.5 Real-time PCR. A: Schematic representation of the most common fluorescent methods used for real-time PCR. B: Amplification plot showing the low amount of fluorescence during the first cycles of amplification (baseline), exponential increase in fluorescence during the middle phase, and final plateau at the end of PCR reaction. C: Post-PCR melting curve analysis on LightCycler demonstrates higher melting temperature of the wild-type allele and lower melting temperature of the mutant allele due to a one nucleotide mismatch with the probe.
Real-time PCR is frequently utilized by clinical molecular diagnostics laboratories because it is a rapid, less laborious technique as compared with other methods and does not require processing of samples after PCR amplification, which minimizes the time of the procedure and the risk of contamination by previous PCR products.
PCR-RFLP Analysis
The principle of restriction fragment length polymorphism (RFLP) analysis is based on the ability of mutations to create or destroy a restriction site for a specific enzyme. After amplification, the PCR product is digested with the restriction enzyme and electrophoresed. The size of digested DNA fragments indicates the presence or absence of a mutation at the restriction site. This method is used for the detection of known sequence variations, both mutations and polymorphisms.16
PCR-SSCP Analysis
Single-strand conformation polymorphism (SSCP) analysis is a simple technique for the detection of randomly distributed mutations. The region of interest is amplified by PCR, and the products are denatured by heat or by exposure to denaturing buffer and analyzed by polyacrylamide or capillary gel electrophoresis. The presence of a mutation will change folding conformation of the sequence and affect electrophoretic mobility of the PCR product, so that the wild-type and mutant bands will migrate differently in the gel. PCR-SSCP analysis can be used for screening for unknown mutations, including small deletions and insertions.17 However, the method does not allow identification of the precise nucleotide change and requires an additional complementary method (such as direct sequencing) for confirmation.
Heteroduplex Analysis
Similarly to SSCP analysis, heteroduplex analysis is a method for identification of randomly distributed mutations. After amplification of the DNA sequence of interest, double-stranded PCR products are denatured by heat and slowly cooled to achieve random reannealing of the single-stranded DNA molecules and loaded into a gel for electrophoresis. A DNA strand without mutations can reanneal either to a complementary strand with no mutation (forming a homoduplex) or to a strand with a mutation (forming a heteroduplex). The presence of mismatched base pairs between the strands in heteroduplexes changes their structural conformation and forces them to migrate more slowly in a gel than homoduplexes, providing evidence for a mutation.
COLD-PCR
Coamplification at lower denaturation-PCR (COLD-PCR) is a recently developed modification of the PCR technique that utilizes the property of heteroduplexes to separate at lower temperature as compared with homoduplexes. COLD-PCR is performed at a reduced denaturation temperature that favors separation and therefore preferential amplification of heteroduplex templates while leaving homoduplex templates intact. This allows for enrichment in mutant sequences and leads to substantial increase in the sensitivity of mutation detection.18,19 COLD-PCR can be coupled with different downstream detection methods, such as Sanger sequencing, real-time PCR/FMCA, and restriction enzyme digestion. A recently published real-time COLD-PCR/FMCA protocol for detecting BRAF mutation in thyroid FNA samples demonstrated a 5% sensitivity of the detection.20
Only gold members can continue reading. Log In or Register to continue