We can happily agree with Adams; where possible, prevention should be a central element of any disease control strategy and epidemiology plays a key role in its development, implementation and evaluation (see Box 14.1). When we speak of prevention in the context of public health, we usually think of what is sometimes called primary prevention which aims to prevent disease from occurring in the first place, i.e. to reduce the incidence of disease. Vaccination against childhood infectious diseases is a good example of primary prevention, as is the use of sunscreen to prevent the development of skin cancer. However, somewhat confusingly, the term prevention is also used to describe other strategies to control disease. One of these is the use of screening to advance diagnosis to a point where intervention is more effective, often described as secondary prevention, and we will discuss this in the next chapter. What is sometimes called tertiary prevention is even more remote from the everyday concept of prevention, usually implying limiting disease progression or providing better rehabilitation to enhance quality of life in the longer term. In terms of disease control it seems more useful to emphasise the fundamental distinction between primary prevention, the focus of this chapter, and all other actions that lead to improved clinical outcomes once disease occurs. The former lowers disease incidence and hence limits the clinical burden from a disease while, as you will see in the next chapter, the latter (e.g. screening) can actually lead to large increases in clinical activity to bring about additional reductions in morbidity and mortality.
Epidemiology underpins much of our work in the area of prevention:
it is central to identifying modifiable causes of disease through the various analytic study designs you have encountered, ideally the results of these would be summarised in a systematic review or meta-analysis;
it provides quantitative measures of relative and absolute risk and summary measures of disease burden such as PAF, PIF (potential impact fractions) and DALYs that help identify areas where realistic benefits might be achieved;
it informs the design of studies, often RCTs but sometimes non-randomised comparisons, to evaluate the potential for an intervention to prevent disease in practice;
together with other disciplines (e.g. statistics, anthropology and economics), it contributes to development of policy to introduce an overall intervention strategy; and, once the strategy has been put in place, it guides the use of appropriate descriptive data to evaluate whether the intervention actually delivers on its promise.
Disease prevention in public health
Figure 14.1 shows tuberculosis (TB) mortality over time in England and Wales. This is a disease that had all but disappeared from developed countries but is now re-emerging as a worldwide scourge.
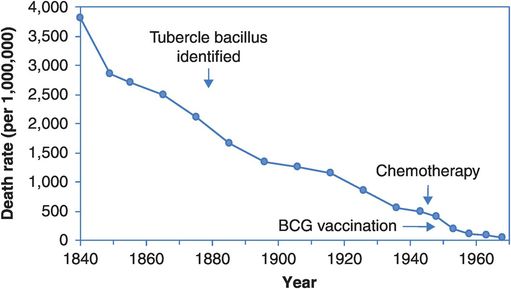
Age-standardised death rates from tuberculosis in England and Wales, 1840–1968.
Figure 14.1 and other historical trends make it clear that major health gains were made before the advent of any sophisticated medical therapies and preventive measures. Social and cultural changes such as improved housing, sanitation, general hygiene and nutrition have had a major influence on TB mortality, presumably both by reducing incidence and by increasing survival. The effects of such ‘upstream’ effects on disease incidence are sometimes termed primordial prevention, because they are remote from the more proximal causes that medicine and (conventionally) public health usually deal with. Our view is that the upstream and proximal causes are inter-related and in practice it can be difficult to distinguish the two; any intervention that lowers incidence is thus sensibly termed primary prevention.
So, should we dismiss the value of the proximal strategies for TB control? On the absolute scale of Figure 14.1 their contribution does seem marginal. But would mortality have declined less quickly if there had been no BCG vaccine and no chemotherapy? Consider Figure 14.2, which shows the same information plotted on a log scale so that a 50% reduction in mortality looks the same regardless of whether the drop is from a death rate of 4000 to 2000 per million or from 40 to 20 per million, i.e. Figure 14.2 depicts the rate of change. We now see a slow and steady fall in mortality across the first 80 years that quickens slightly around 1920. The slope steepens just after the introduction of chemotherapy and continues to fall following the introduction of BCG vaccination. These are hardly definitive evaluations of the benefits of these advances, but the acceleration of the fall in mortality around 1950 implies that something has changed, and the introductions of vaccination and treatment are the best candidates. And here, as elsewhere, when evaluating the ‘big-picture’ population effects of interventions we have to realise that such apparently simple descriptive data are often going to be the principal basis on which our judgements rest.
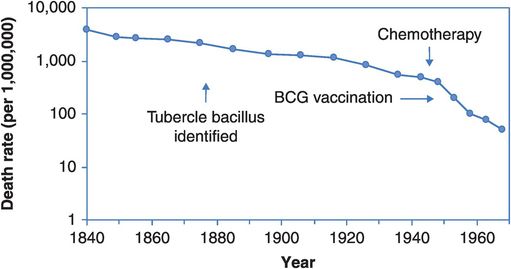
Age-standardised death rates from tuberculosis in England and Wales, 1840–1968, plotted on a logarithmic scale.
While the principal goal of public health should first and foremost be primary prevention, for many diseases we do not have enough information (biological and/or epidemiological) to mount such a programme effectively (or cost-effectively). Even when we do have the knowledge, the barriers to implementation may be substantial (e.g. financial, cultural, social, ethical). For example, we already know that ensuring everyone has access to clean water would prevent a large proportion of infectious disease, but for many countries the practical and financial implications are enormous. Similarly, by persuading more people to stop smoking, stay out of the sun, lose weight, exercise more and eat better we could prevent much of our present burden of chronic disease, but changing behaviour remains a major challenge.
Additional strategies are therefore required in order to enhance disease control and decisions as to the most appropriate approach need to be disease-specific: less disease is most desirable, but might not be attainable if causal knowledge is limited, or if causes are not readily modifiable. Screening may be a good second choice in some circumstances if advancing diagnosis really does produce better outcomes (not as straightforward as it might seem, as you will see in the next chapter). Finally, improvements in treatment remain an important avenue for enhancing survival and quality of life for affected individuals. Table 14.1 contrasts two cancers with markedly different control profiles.
| Intervention | Accepted utility for widescale use | |
|---|---|---|
| Lung cancer | Breast cancer | |
| Prevention | YES. Smoking cigarettes is the strong risk factor (PAFa > 80%); and exposure is modifiable by actions at personal and community levels | NO. Many weak risk factors, most not readily modifiable (although limiting alcohol intake (PAF ~6%) and, post-menopause, weight control (PAF ~8%) and limiting use of hormone therapy (PAF ~3%) are possibilities) |
| Screening | NO. Even the newest tests (computed-tomography lung scans) yield very limited survival benefits | YES. Substantial good evidence (from RCTs) of lower mortality due to population screening programmes for over 50s |
| Improved treatment | NO. Minor survival improvements only with newer treatments | YES. Results from RCTs show that a survival advantage can be achieved with appropriate chemotherapy/radiotherapy |
The solution to the lung cancer epidemic is obvious (given a PAF of at least 80% for a single, modifiable cause), and concerted multilevel efforts to reduce smoking rates (including banning advertising, legislating for smoke-free public space, and plain paper packaging) have made big inroads on lung cancer rates in many countries (see Figures 3.6 and 3.7). Nonetheless, it remains a common disease, so efforts to improve clinical outcomes through early detection and better treatments are also important, although their yield to date has been limited. Other valuable benefits have come from smoking control programmes as noted in Box 14.2, but the other examples there point to the need to consider the balance of all effects – positive and negative – of any intervention before deciding if it should be introduced widely.

An important aside to the lung cancer story is that anti-smoking campaigns have also greatly reduced incidence of other respiratory disease and heart disease. While much causal research is disease-specific, preventive interventions manipulate exposures that may have many consequences. Thus we need good information on the full array of effects of any exposure we plan on modifying. Even immunisation campaigns against infectious diseases have consequences beyond the clear preventive benefits, as they have lowered incidence so dramatically that fewer lives are now saved and the occasional severe side effects of immunisation start to take a more prominent place on the balance sheet. Although virtually every consequence of decreased exposure to cigarettes is positive and thus the total benefit-to-cost ratio is huge, counter-examples abound where complexity is the rule. For example, moderate alcohol consumption is linked to lower heart disease but higher breast cancer rates and, at high intakes, it is associated with an array of other health and social problems. While the oral contraceptive pill clearly prevents cancers of the ovary and uterus, it has an array of secondary effects which influence whether it is prescribed, and it also increases risks of clotting disorders and breast cancer. And so on.
How do we combine the different effects on morbidity and mortality for various diseases? Does the benefit of avoiding one non-fatal stroke obtained by long-term aspirin use outweigh the risk of three new life-threatening gastric bleeds? Measures such as the DALYs and QALYs that you met in Chapter 2 provide a more quantitative method of doing this and are increasingly reported by health agencies.
With breast cancer we see the reverse situation. Quite a lot is known about its aetiology, but there is no strong established causal factor that offers a basis for widespread intervention although reductions in use of postmenopausal hormones have probably lowered incidence in a number of countries (Parkin, 2009). Reducing alcohol intake and, in postmenopausal women, weight control could also yield some preventive benefits, but the PAFs of only 6–8% for alcohol and overweight/obesity (Parkin et al., 2011; Whiteman et al., 2015) show the more limited potential for prevention at present. Fortunately, dual approaches to decreasing morbidity and mortality, namely population screening by mammography to detect early lesions and more effective non-surgical treatments, have paid off. Despite incidence rates that have, until recently, been constant or even increasing, there have been downturns in mortality from breast cancer in a number of countries from the early 1990s, with examples from the USA and UK shown in Figure 14.3. This suggests that the improved outcomes predicted by tightly controlled clinical trials have transferred reasonably effectively to the community setting. Note again the use of routine descriptive data to evaluate the effects of interventions in the community; but also that this alone cannot separate out the relative contributions of early diagnosis and improved treatment. However, as this is important knowledge for setting the cancer control agenda, there have been a number of attempts to address the question by comparing disease characteristics and survival in eras with different screening and treatment interventions (Webb et al., 2004) and statistical modelling (Morrell et al., 2012).
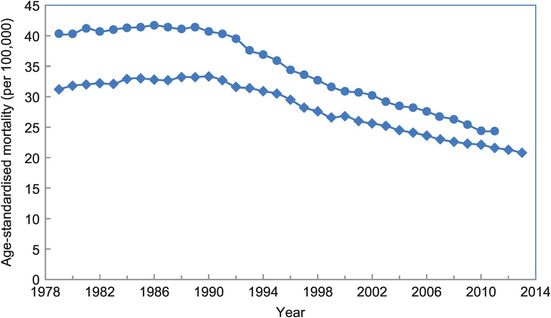
Age-standardised breast cancer mortality rates per 100,000/year for women in the UK, 1979–2011 (circles) and USA, 1979–2013 (diamonds).
We will not consider clinical contributions to disease control any further here; instead, our discussion will focus largely on the applications of both epidemiological data and epidemiological thinking to disease prevention and screening. In relation to disease prevention, we will concentrate on the conceptual underpinnings of the preventive approach and some current practical concerns and challenges as well as looking at the utility of using population attributable fractions (PAFs) to target potential ‘high-yield’ interventions. In Chapter 15 we will go on to consider screening in terms of its underlying logic, and the major challenges to evaluating its contributions to the control of a given disease.
The scope for preventive medicine
Our earlier examples of disease variation by person, place and time have shown that there are large differences between groups, suggesting that much disease should be preventable if only we could lower everyone’s risk to that of the lower-risk populations. Another striking example comes from an investigation seeking an explanation for the threefold excess of cardiovascular disease (CVD) mortality in Finland compared with China. Surveys carried out in rural villages in the two countries over the same time period revealed quite different profiles of CVD risk factors (Table 14.2). The first three factors, all more prevalent in Finland, could be taken as related to overnutrition, and possibly to the fat content of the diet. Given China’s history of major famines in the mid twentieth century it is not surprising that differences remain so profound, at least in rural populations. Countries undergoing the health transition away from a predominance of infectious diseases and problems of marginal nutrition are, in principle, well placed for intervention to prevent the emergence of Western lifestyle diseases, many of which are related to overconsumption and inactivity. However, social engineering is challenging, and the pace of development and industrialisation in China coupled with dramatic reductions in rates of most infectious diseases (except HIV/AIDS) and increases in rates of chronic diseases including cancer and cardiovascular disease (Yang et al., 2013) suggest that the risk-factor profiles have already shifted towards those seen in the West. This is also true for other countries in transition, as can be seen in Thailand, where more frequent consumption of sugar-sweetened beverages in 2005 was associated with greater weight gain over the next four years (Lim et al., 2014). Table 14.2 also reflects different attitudes to control of smoking, with the consequences of China’s high rates now seen in the rising lung cancer and CVD rates there.
| Risk factor | Men | Women | |||
|---|---|---|---|---|---|
| Finns (%) | Chinese (%) | Finns (%) | Chinese (%) | ||
| Being overweight | 63 | 21 | 61 | 24 | |
| Obesity | 19 | 2 | 24 | 5 | |
| Hypercholesterolaemia | 34 | 3 | 28 | 6 | |
| Hypertension | 49 | 32 | 35 | 28 | |
| Smoking | 26 | 73 | 7 | 37 | |
Population versus individual risk
There is a tendency in medicine and epidemiology to try to divide people into two groups – those who have a high risk of developing a particular disease and those at low risk. For instance, a woman of child-bearing age with high blood pressure who smokes and has a family history of blood clotting would be considered at high risk of complications if she took the oral contraceptive pill and this would not be prescribed. In population terms, however, the benefits of the pill outweigh the harms, and it is widely prescribed, although not primarily for the prevention of disease.
Risks and benefits of oral contraceptives: Ovarian and uterine cancer rates would be 20–30% higher if women did not use the pill, but breast and cervical cancer rates would be slightly lower. However, the number of cancers prevented by the pill in Australia in 2010 (~1340) greatly outweighs the number it potentially caused (Jordan et al., 2015).
So, how should we think about preventing ill health? Should we devote most of our attention to the high-risk groups? This has been the basis of the vast improvements in occupational health and safety since the industrial revolution, and remains an appropriate approach for specifically disadvantaged or exposed groups, including many indigenous peoples. However, in the general population there are few well-defined natural borders between clearly different levels of risk. As an example, consider the relationship between blood pressure and risk of fatal cardiovascular disease. We can see in data from the Whitehall cohort study of British public servants (Rose, 1992) that the age-adjusted risk of dying from CVD over 18 years of follow-up increases with increasing blood pressure (Figure 14.4). Clearly, reducing blood pressure levels is likely to reduce the CVD mortality rate. However, when we look at Figure 14.5, we see that individuals do not fall into obviously separate groups with low and high blood pressure and, therefore, clear-cut ‘low’ or ‘high’ risk of heart disease.
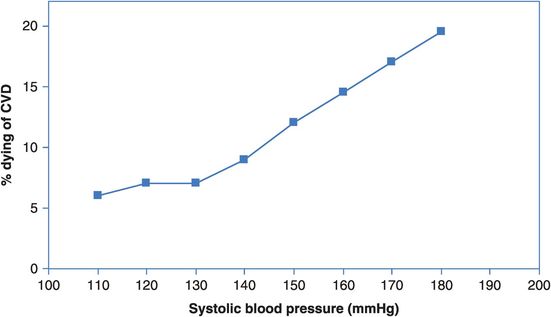
The relationship between systolic blood pressure and risk of fatal coronary heart disease or stroke over 18 years of follow-up.
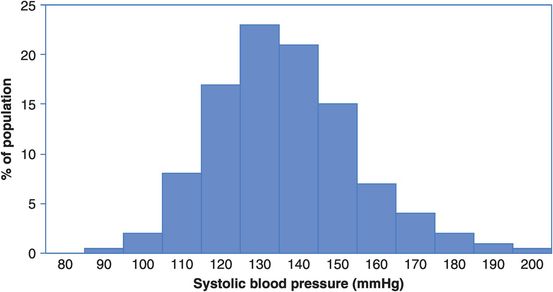
Distribution of systolic blood pressure in a population of middle-aged men.
In Figure 14.4, is there any level of systolic blood pressure that is not ‘riskier’ than the one below it?
Looking at Figures 14.4 and 14.5, how many men in a population of 10,000 would have a systolic blood pressure of 150 mmHg? What is the risk (incidence proportion) of dying from CVD in this group?
So how many men with a blood pressure of 150 mmHg will die from CVD? What about those with a blood pressure of 170 mmHg?
From Figure 14.4 we can infer that the risk of dying from CVD at any level of blood pressure is greater than that at the level below. The risk increases slowly up to 130 mmHg and then increases more sharply and linearly from there. From Figure 14.5 we can estimate that 15% or 1500 of a population of 10,000 men would have a blood pressure around 150 mmHg, and from Figure 14.4 the risk of dying of CVD in this group is 12% over the 18 years of follow-up. We would, therefore, expect about 12% × 1500 = 180 CVD deaths in this group. Similarly, 4% or 400 of the population would have a blood pressure of 170 mmHg and they have a 17% risk of dying of CVD. We would therefore expect about 17% × 400 = 68 CVD deaths in this group. Thus, although the risk of dying of CVD is greater for those with very high blood pressure, over twice as many actual CVD deaths will occur among the much larger number of people with intermediate blood pressure. Targeting prevention at only those with very high blood pressure will not, therefore, address the majority of deaths (but see Box 14.3 for a clinical perspective).

Stay updated, free articles. Join our Telegram channel

Full access? Get Clinical Tree


