Prediction and Refinement of Human Kinetics from In Vitro, Preclinical, and Early Clinical Data
OBJECTIVES
The reader will be able to:
- Define the following terms: allometry, equivalent time, microdosing, whole-body physiologically based modeling.
- Define allometry and give an example of its application in drug development.
- Appreciate the use and limitations of allometric scaling in predicting the absorption and disposition kinetics of drugs in humans from animal data.
- Discuss the strategy commonly used for predicting clearance in humans from a combination of in vitro and animal data, together with a model of hepatic clearance.
- Discuss the purpose and development of whole-body physiologically based pharmacokinetic models.
- Discuss how simulation using physiologically based pharmacokinetic models can be useful in evaluating drug interactions.
- Discuss what is meant by “simulation of virtual patient populations.”
 revious chapters emphasize an understanding of the physiologic concepts underlying the determinants of pharmacokinetics and their integration with kinetic principles. They show how such knowledge applies to the interpretation of observed concentration–time data, a deductive approach, and, ultimately, to drug therapy. Much of this last chapter takes a more synthetic approach. It is devoted to the prediction of human pharmacokinetics for a specific drug based on various pieces of information acquired prior to its administration to humans. It can also be extremely useful at various stages in the selection and evaluation of a new molecular entity. Examples include anticipating whether the new compound is likely to have the appropriate pharmacokinetic properties for the intended therapeutic application, helping to optimally plan a clinical trial to address specific questions, and helping to address various aspects in the labeling instruction for the use of a new medicine, such as whether there is a need to modify the dosage when a patient is on concurrent medication. These and other examples are explored in this chapter.
ALLOMETRY AND DISPOSITION KINETICS
ORIGIN
Since the days of Galileo, and perhaps before, there has been a quest to understand the relationship between size and function. The longer the nail, the thicker it needs to be, to avoid being bent when hammered into the wall; elephants need thicker legs than humans to stand, otherwise, they would not be able to support their weight. This interest in scale extends to the relationship between body size and physiologic parameters. The subject has come to be known as allometry, or the study of relationship between the size of the body and its component parts and functions.
The easiest measure of body size is body weight. Figure 22-1 shows the relationship between various properties (heart weight, glomerular filtration rate, cardiac output, daily heat production) and body weight among mammals, that is, animals, including humans, that suckle their young and maintain their internal body temperature regardless of their environment. These animals include, in increasing order of weight, mouse, rat, guinea pig, cat, dog, rabbit, monkey, and man and extend to larger mammals, such as cow and elephant. There are several points to note. First, the data are displayed as log–log plots. This is needed to allow data for all mammals to be displayed on one graph, given that the average body weight ranges from 0.02 kg for a mouse to 70 kg for a human adult to 3400 kg for an elephant. Second, for each property Y, such as glomerular filtration rate, the relationship across the species can be described by a straight line, given by
where a and b are constants, and W is body weight. Or, taking antilogs,
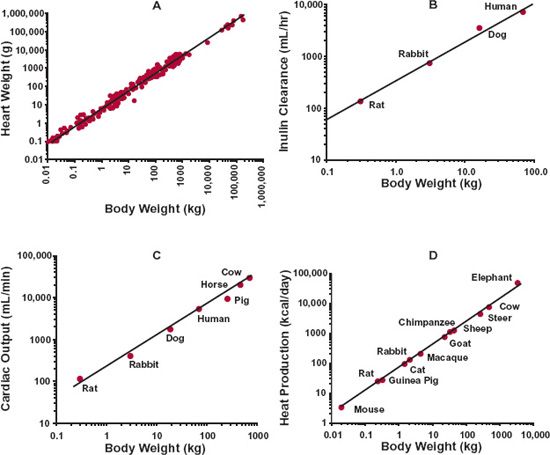
FIGURE 22-1. Allometric relationships between body weight of mammals and (A) heart weight, for 104 species spanning the weight range from mouse to blue whale, exponential coefficient b = 0.98; (B) inulin clearance, a measure of glomerular filtration rate, b = 0.74; (C) cardiac output, b = 0.78; and (D) heat production, b = 0.75. Note that the data are displayed as log–log plots, and that the slope of the line is approximately 1 for heart weight and 0.75 for the three measures of body function. (From: Prothero J. Heart weight as a function of body weight in mammals. Growth 1979;43:139–150 [heart weight]; Aldolph, EF. Quantitative relationships in physiological constituents of mammals. Science 1949;109:579–585 [inulin clearance]; Holt JP, Rhode EH, Kines J. Venticular volumes and body weight in mammals. Am J Physiol 1968;215:704–715 [cardiac output]; McMahon, T. Size and Shape in Biology: Elastic criteria impose limits on biological proportions, and consequently on metabolic rates. Science 1973;179:1201–1204 [heat production].)
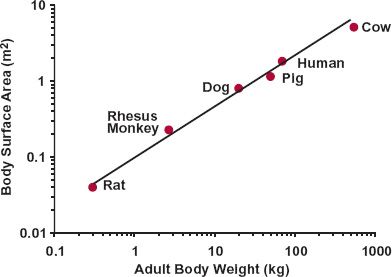
Second, examination of the relationships in Fig. 22-1 indicates that the value of b, the exponential coefficient, lies between about 0.75 and 1. It has a value of about 1, for example, when relating heart weight, and the weight of many other tissues and organs, with body weight. In particular, skeletal muscle weight, needed for posture and locomotion, is a relatively constant 45% of body weight among mammals. In contrast, the exponential coefficient b is about 0.75 when relating glomerular filtration rate, cardiac function, heat production, and many other physiologic functions to body weight. Notice also that although the range 0.75 to 1 appears narrow, as shown in Fig. 22-2, the predicted value of a property varies greatly across this range in moving from mouse to human, given the 3500-fold difference in body weight. For example, if the value for a 20-g mouse is 1, substitution into Eq. 22-2 indicates that it is predicted to be 3500 in an adult human using b = 1 (1 × (70000/20)1), but only 455 (1 × (70000/20)0.75) using b = 0.75, a 7.7-fold difference. Another property for which b is approximately 0.75 is body surface area, as shown in Fig. 22-3, which is the reason why physiologic functions are often said to vary in direct proportion to body surface area, both across and within species. For example, recall that when considering creatinine clearance, or glomerular filtration rate, in Chapter 14, Age, Weight, and Gender, and Chapter 15, Disease, values are expressed per 1.73 m2, which is the average body surface area of a 70-kg adult. The rationale for b being in the order of 0.75 when a property correlates with surface area is as follows. Assuming that the body is a sphere of radius r, its surface area and volume (which relates to weight through specific density) are 4πr2 and 4πr3/3, respectively. On taking the logarithm of each, we see that, with respect to r, surface area varies by a factor of 2, whereas volume (and weight) varies by a factor of 3. Hence, for a sphere, a plot of log (surface area) against log (weight) would have a slope of two thirds or 0.67. In reality, we are not spherical, and functions are not directly proportional to body surface area, and a value for b in the order of 0.75 is more appropriate. Furthermore, given the inherent biological variability across species, in practice the experimental data often do not allow a ready distinction between values of 0.67 and 0.75.
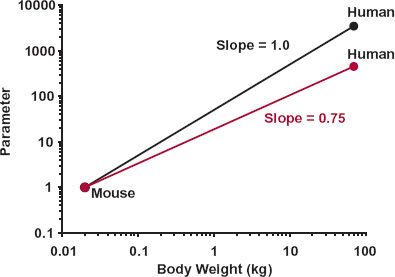
FIGURE 22-2. Although exponents of 0.75 and 1 on relating a physiologic parameter to body weight do not appear to differ greatly, when applied across animal species that differ greatly in body weight, in this case from 0.02 kg (mouse) to 70 kg (human), the differences in the projected parameter values become large. The value of the parameter is arbitrarily set at 1 for mouse.
FIGURE 22-3. Allometric relationship between body surface area of mammals and typical adult body weight for each species. The exponent is close to two thirds (0.67). The body surface area for the typical adult was obtained from the allometric relationship for a range of body weights within each respective species. (From: Calder, WA III. Size, Function, and Life History. Harvard University Press, Cambridge; 1984.)
APPLICATION TO DRUGS
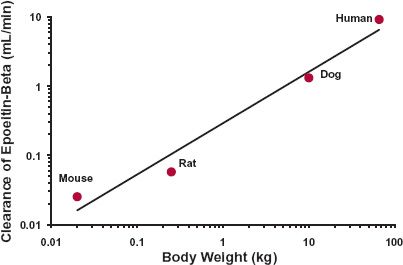
An obvious extension of these general physiologic and anatomic observations is their application to scaling pharmacokinetic parameters, specifically those of drug disposition, across species. Noting that body composition varies relatively little from one mammalian species to another, the expectation is that, as with muscle mass, volume of distribution should vary in direct proportion to body weight (i.e., b = 1), whereas for drug clearance, being a measure of functional activity, like cardiac output and glomerular filtration rate, the value of b is expected to be about 0.75. Evidence supporting these expectations is provided in Fig. 22-4 for the chemotherapeutic agent, cyclophosphamide, for which the estimated values of b for volume of distribution and clearance are 0.985 and 0.754, which for practical purposes are 1 and 0.75, respectively. Notice that no assumption has been made regarding the nature of processes governing the distribution or elimination of the compound. Indeed, these allometric relationships have been found to apply not only to small molecules such as cyclophosphamide but also equally to large therapeutic proteins too, although most attention for proteins is on clearance (Fig. 22-5), because proteins tend to be restricted to the vascular space, or at most the extracellular space, both of which are similar on a L/kg basis among mammals, although discrepancies would be expected when target-mediated disposition occurs involving a specific human target.
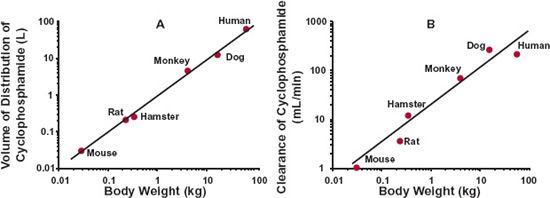
FIGURE 22-4. Allometric relationship between (A) volume of distribution, and (B) clearance of cyclophosphamide and body weight among mammals. The exponents are 0.985 and 0.754, respectively. Note the differences in the scales of the y-axes of the two graphs. (From: Boxenbaum, H. Interspecies scaling, allometry, physiological time, and the ground plan of pharmacokinetics. J Pharmacokin Biopharm 1982;10:201–228.)
FIGURE 22-5. Allometric relationship between clearance of epoetin-β, a therapeutic protein, and body weight among mammals. The exponent is 0.775. (From: Bleul H, Hoffmann R, Kaufmann B, et al. Kinetics of subcutaneous versus i.v. epoetin-beta in dogs, rats and mice. Pharmacology 1996;52:329–338 [animal data]; Halstenson CE, Macres M, Katz AS, et al. Comparative pharmacokinetics and pharmacodynamics of epoetin alfa and epoetin beta. Clin Pharmacol Ther 1991;50:702–712 [human data].)
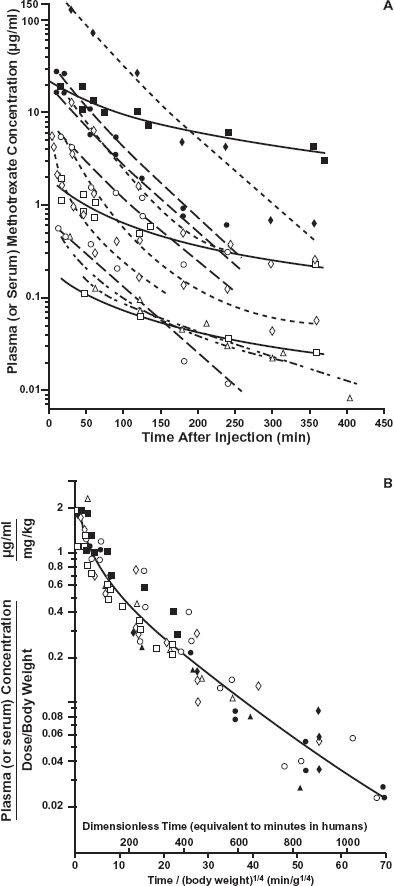
Now consider the application of these ideas to methotrexate. Shown in Fig. 22-6A is a semilogarithmic plot of plasma methotrexate concentration with time following either its intravenous (i.v.) or intraperitoneal (i.p.) administration of different doses to various mammals, including humans. The equations describing the data among the species are similar in form but vary in both intercept and slope, giving the impression that data are species specific. However, all the data can be brought together by applying allometric relationships. Assume for simplicity that the data for each species can be described by a one-compartment model, characterized by the general equation
which, on dividing by dose/body weight (Dose/W), gives
Now, assuming that the observations for cyclophosphamide apply equally to methotrexate, then
FIGURE 22-6. A. Plasma concentration of methotrexate after i.v. or i.p. injection. Mouse —–; rat – – –; monkey – – – – –; dog – – – –; human ——. Observations: mouse  (i.v. 3 mg/kg; i.p. 4.5, 45, 450 mg/kg), rhesus monkey
  (i.v. 0.3 mg/kg), beagle dog
  (i.v. 0.2 mg/kg), adult patients
  (i.v. 0.1, 1, 10 mg/kg). B. Plot of plasma concentrations in graph A normalized to dose per kg versus time raised to the 0.25 power. The plot has become known as the Dedrick plot after the author who first proposed it. (From: Dedrick RL, Bischoff KB, Zaharko DS. Interspecies correlation of plasma concentration history of methotrexate (NSC-740). Cancer Chemotherap Rep Part 1 1970;54:95–101.)
where a1 and a2 are coefficients with values specific to methotrexate. It remains to evaluate CL/V
where a3, the ratio of a2 and a1, is also specific to methotrexate. Finally, substitution of Eqs. 22-5 and 22-7 into Eq. 22-4 yields
Hence, it is expected that when the plasma concentration for each species is divided by the corresponding dose per kilogram body weight and time is divided by W0.25, data for all species should fall on the same curve, which is the case for methotrexate (Fig. 22-6B). Dividing chronologic time by W0.25 has been called equivalent time in that it tends to bring events in all mammals within a common time scale. It is similar in concept to expressing temporal events in a mammal in terms of its life span, recognizing that generally the smaller the mammal the shorter is its life span. Thus, a mouse lives for only 2 years, a dog for 15 years, and so on. A month in the life of a mouse is, therefore, approximately the same as 7 months in the life of a dog. It is also apparent from Eq. 22-7, that as t1/2 = 0.693 · V/CL, the t1/2 of a drug is shorter in smaller than larger animal species, although the increase with size is relatively small as it is predicted to vary in direct proportion to W0.25. For example, if the half-life of a drug is 2 hr in a mouse, it is 9.5 hr in a 10-kg dog (2 × (10,000g/20g)0.25); that is, a 500-fold increase in body weight is predicted to result in only a 4.75-fold increase in half-life. The data for ceftizoxime, a drug predominantly renally excreted unchanged, support this expectation, with the half-life increasing from 13 min in a mouse to 65 min in a dog, and close to 80 min in humans (Fig 22-7).
Recall that a similar approach of relating V to body weight and clearance to body surface area or W0.75 was adopted when scaling kinetic data obtained in adults to those in children (Chapter 14, Age, Weight, and Gender). Also, adjustment of dosing rate of many chemotherapeutic agents across the patient population is made on a body surface area basis. This approach is similar to observations in animals that show that for many such drugs, particularly the alkylating agents, when administered chronically, toxicity in the form of neutropenia was seen at similar plasma concentrations across species and that the dosing rate needed to achieve a steady-state concentration was directly proportional to body surface area. As CSS = Rinf/CL, it was therefore inferred that CL scales in direct proportion to body surface area rather than to body weight. Obviously, this adjustment is only warranted if surface area explains variability in clearance better than body weight (Chapter 14, Age, Weight, and Gender).
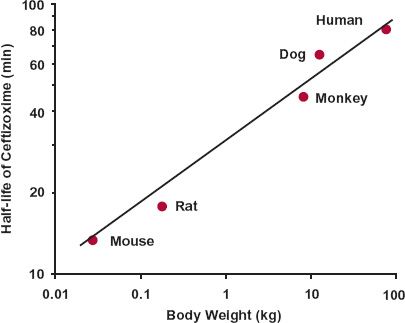
FIGURE 22-7. Log–log plot of half-life versus body weight for ceftizoxime. The solid circles represent the values reported in the literature for each species. The solid line is the best fit line for animals, excluding humans. The predicted antibiotic half-life in humans is read off the linear regression line at 70 kg. (From: Mordenti J. Forecasting cephalosporin and monobactam antibiotic half-lives in humans from data collected in laboratory animals. Antimicrob Agents Chemother 1985;27:887–891.)
DEVIATION FROM EXPECTATION
The allometric approach appears to offer a means of using animal data, which is often collected as part of the initial examination of a potentially useful compound, to predict the likely disposition kinetics in humans, and hence help select compounds having desired characteristics. For example, predicting half-lives of 40 min and 12 hr for two different compounds in humans may favor selection of the latter if the aim of therapy is to maintain a relatively constant concentration over extended periods. However, simple allometry of the type applied so far often fails to provide an accurate prediction of events in humans; this is not too surprising as the assumption that the only difference among mammals is size, which is certainly not the case, is rather simplistic. Indeed, if the allometric approach always applied, it could be argued that the pharmacokinetics of a drug needs to be determined in only one animal species to predict human pharmacokinetics. One clue to a potential problem with this approach is when the observed value of b is very different from that expected based on body size alone. For example, the allometric exponent for clearance of saruplase, a high–molecular-weight thrombolytic agent, is 1.28 based on animal data. The resulting prediction in humans is 2100 mL/min, far from the observed value of 530 mL/min, indicating that one or more of the processes responsible for elimination of this compound, in one or more of the animal species, are substantially different from that in humans, making prediction problematic. But, why does allometry work with methotrexate and some other drugs, and not with others.
One reason for a likely successful application of allometry is when the organ extraction ratio of the compound is high in all species, as then blood clearance approaches organ blood flow, which scales well across species with an exponential coefficient of 0.75. Another is when renal excretion is the predominant route of elimination, because, as illustrated with fluconazole (Fig. 22-8), renal clearance generally scales well allometrically, again with a value for b on the order of 0.75. Indeed, renal clearance tends to correlate well with glomerular filtration rate, even for renally secreted drugs and, as mentioned previously, filtration scales well across species. The allometric approach, which as applied is largely empirical, fails, however, when one or more of the underlying assumptions do not hold.
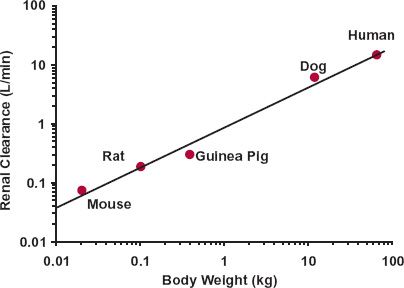
FIGURE 22-8. Allometric plot of renal clearance of fluconazole in mammals versus body weight. The exponent of the line is 0.67. (From: Jezequel SG. Fluconazole: interspecies scaling and allometric relationships of pharmacokinetic properties. J Pharm Pharmacol 1994;46:196–199.)
CORRECTING FOR PROTEIN BINDING
Given that the values of CL and V may depend on the fraction unbound in plasma, fu, implicit in the allometric approach based on total plasma data is that fu is relatively constant across species. This is often the case, but as shown in Fig. 22-9, not always so, with fu sometimes varying across species by as much as 10-fold and occasionally even more. Correcting for fu would then be reasonable, certainly for drugs with a volume of distribution greater than 0.5 L/kg (V ≈ VTW · fu/fuT) and for predominantly metabolized drugs of low clearance (CL = fu · CLint). Theoretically, if most of the variability lies in fuT rather than fu then clearly scaling unbound volume of distribution (Vu ≈ VTW/fuT
Stay updated, free articles. Join our Telegram channel

Full access? Get Clinical Tree


