New Terminology39
The Black–Leff Operational Model of Agonism40
Applying the Black–Leff Model to Predict Agonism43
Descriptive Pharmacology: III49
Summary50
This chapter discusses the use of the Black–Leff operational model to quantify agonist affinity and efficacy. The operational model allows ascription of molecular properties (affinity in the form of KA and efficacy in the form of τ) for the prediction of agonist effect in different tissues from ratios of KA and τ obtained for agonists. This allows data obtained in test systems to predict what will be seen in therapeutic ones.
Keywords
Michaelis–Menten kinetics, receptor reserve (spare receptors), τ as a measure of efficacy.
Agonist Response in Different Tissues
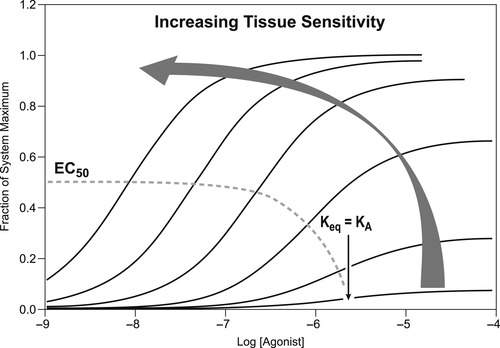
As discussed in Chapter 1, the potency of an agonist depends on the drug-related properties of affinity and efficacy, and the cell-related properties of target density (number of responding units in the cell) and the efficiency with which these target units are coupled to the cell response producing machinery. These two latter factors vary with cell type, leading to variable potency of any given agonist in different cell types. It is useful to consider the pattern that the dose–response curves to a given agonist will assume in a range of tissues of varying target density and/or target coupling efficiency. As discussed in Chapter 2, the EC50 of the curve to a partial agonist is an approximate estimate of the binding Keq (affinity−1). This is a molecular property of the agonist that is constant for all tissues, so it follows that in tissues where the agonist produces partial maximal effect, the EC50 will be relatively constant and equal to a value near the Keq. Also as noted in Chapter 2, in more sensitive tissues where full agonism is produced, the EC50 dissociates from Keq and becomes a complex function of both affinity and efficacy (see Derivations and Proofs, Appendix B2). With increasing sensitivity of the tissue, the dose–response curve to the full agonist will progressively shift to the left along the concentration axis. Figure 3.1 shows dose–response curves to a given agonist in a range of tissues of varying sensitivity (from low to high). It can be seen from this figure that the curves showing submaximal activity have similar EC50 values until the tissue maximal response is produced. Then, in the more sensitive tissues where full agonism is observed, the EC50 values progressively diminish (i.e., the curves shift to the left along the concentration axis).
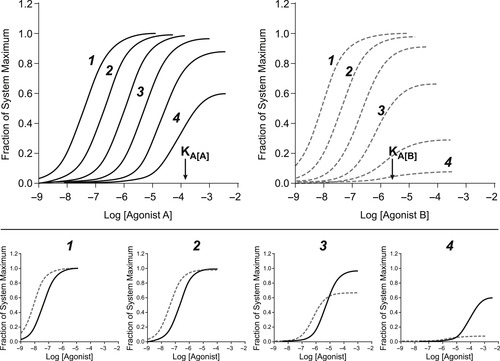
The behavior of agonist dose–response curves in different tissues is important to understand in order to predict agonist response in all tissues. In general, in the least sensitive tissues, the dose–response curve to any agonist emanates from concentrations around the Keq for binding. At this point this will be denoted the KA, which is the nomenclature for the binding Keq for agonists. In more sensitive tissues, the curve shifts to the left of this value. Figure 3.2 shows the dose–response curves of two agonists (denoted A and B) in a range of tissues of varying sensitivity (numbered 1 to 4, with 1 being the most sensitive). In the lower panels the curves to each agonist in tissues 1 to 4 are shown. It can be seen that the relative potencies of agonists A and B do not follow a uniform pattern once partial agonism is observed. This has practical ramifications for drug discovery. Specifically, consider the relative potency profiles of agonists A and B in tissue 1 and tissue 4. In efficiently coupled tissues where both are full agonists, it can be seen that agonist B is more potent than agonist A. However, in a more poorly coupled tissue (tissue 4), it can be seen that agonist A now yields a more robust response than agonist B. Such discontinuities in agonist potency can only be predicted if the affinity and efficacy are known. In the absence of this information, the behavior of the agonists in different systems cannot be predicted accurately. The major tool to make such predictions is the Black–Leff operational model of agonism.
New Terminology
The following new terms will be introduced in this chapter:
• Michaelis–Menten kinetics: Description of the interaction of molecules with proteins based on the enzyme catalysis of substrate molecules as first described by Michaelis and Menten. Kinetics are characterized by a maximal rate of enzyme action (denoted Vmax) and a sensitivity to catalysis (denoted Km, referred to as the Michaelis–Menten constant). This latter term is the concentration of substrate that causes the enzyme to function at ½ Vmax.
• Receptor reserve (spare receptors): This refers to the condition in a tissue whereby the agonist needs to activate only a small fraction of the existing receptor population to produce the maximal system response. The magnitude of the reserve depends upon the sensitivity of the tissue and the efficacy of the agonist.
• τ: efficacy of an agonist (according to the Black–Leff operational model of agonism) made up of drug-specific properties (the intrinsic efficacy of the molecule) and tissue-related factors (the KE of the drug-bound receptor interacting with the stimulus-response biochemical reactions of the cell).
The Black–Leff Operational Model of Agonism
The model used to link the stimulus with cellular response is the operational model devised by Black and Leff. [1] The basis of this model is the experimental finding that the observed relationship between agonist-induced response and agonist concentration resembles a model of enzyme function presented in 1913 by Louis Michaelis and Maude L. Menten (see Box 3.1 and Figure 3.3). This model accounts for the fact that the kinetics of enzyme reactions differ significantly from the kinetics of conventional chemical reactions. It describes the reaction of a substrate with an enzyme as an equation of the form: reaction velocity=(maximal velocity of the reaction×substrate concentration)/(concentration of substrate+a fitting constant Km). The parameter Km characterizes the tightness of the binding of the reaction between the substrate and enzyme; it is also the concentration at which the reaction rate is half the maximal value. It can be seen that the more active the substrate, the smaller is the value of Km. Comparison of this equation with equation 2.1 shows that it is formally identical to the Langmuir adsorption isotherm relating binding of a chemical to a surface (Km=Keq). Both of these models form the basis of drug receptor interaction, thus the kinetics involved sometimes are referred to as “Langmuirian” in form.
Box 3.1
 |
 |
Leonor Michaelis (1875–1949) and Maude Menten (1879–1960) worked in the Berlin Municipal Hospital and together formulated one of the earliest quantitative laws of biochemistry. Specifically, their famous equation described the velocity and mechanism of the formation of the complex between an enzyme and substrate. In form, the Michaelis–Menten equation describes a relationship between input and output that is applicable to a wide variety of biochemical processes such as enzymes, transport processes and other saturable reactions. Black and Leff utilized the general form of this equation to define τ as a representation of agonist efficacy and the sensitivity of tissues to agonist action.
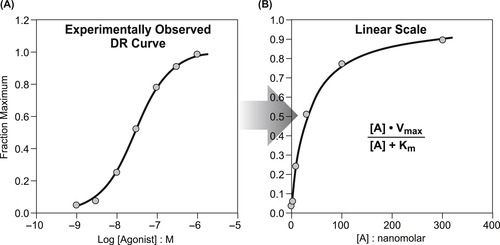 |
Figure 3.3 Stay updated, free articles. Join our Telegram channel
Full access? Get Clinical Tree
 Get Clinical Tree app for offline access

|