Physiologic Principles and Urea Kinetic Modeling
John T. Daugirdas
Dialysis is a process whereby the solute composition of a solution, A, is altered by exposing solution A to a second solution, B, through a semipermeable membrane. Conceptually, one can view the semipermeable membrane as a sheet perforated by holes or pores. Water molecules and low-molecular-weight solutes in the two solutions can pass through the membrane pores and intermingle, but larger solutes (such as proteins) cannot pass through the semipermeable barrier, and the quantities of high-molecular-weight solutes on either side of the membrane will remain unchanged.
I. MECHANISMS OF SOLUTE TRANSPORT. Solutes that can pass through the membrane pores are transported by two different mechanisms: diffusion and ultrafiltration (convection).
A. Diffusion. The movement of solutes by diffusion is the result of random molecular motion. The larger the molecular weight of a solute, the slower will be its rate of transport across a semipermeable membrane. Small molecules, moving about at high velocity, will collide with the membrane often, and their rate of diffusive transport through the membrane will be high. Large molecules, even those that can fit easily through the membrane pores, will diffuse through the membrane slowly because they will be moving about at low velocity and colliding with the membrane infrequently (Fig. 3.1).
B. Ultrafiltration. The second mechanism of solute transport across semipermeable membranes is ultrafiltration (convective transport). Water molecules are extremely small and can pass through all semipermeable membranes. Ultrafiltration occurs when water driven by either a hydrostatic or an osmotic force is pushed through the membrane (Fig. 3.1). Those solutes that can pass easily through the membrane pores are swept along with the water (a process called “solvent drag”). The water being pushed through the membrane is accompanied by such solutes at close to their original concentrations. Analogous processes are wind sweeping along leaves and dust as it blows and current in the ocean moving both small and large fish as it flows. Larger solutes, especially those that are
larger than the membrane pores, are held back. For such large solutes, the membrane acts as a sieve.
larger than the membrane pores, are held back. For such large solutes, the membrane acts as a sieve.
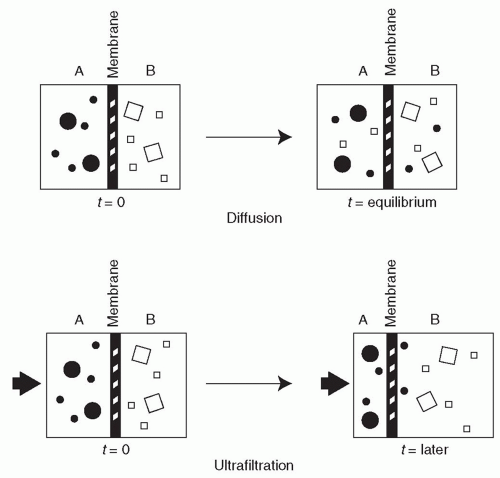 FIGURE 3.1 The processes of diffusion (top) and ultrafiltration (bottom). As shown, in both processes, low-molecular-weight solutes can cross the semipermeable membrane, whereas larger solutes are held back. |
1. Hydrostatic ultrafiltration
a. Transmembrane pressure. During hemodialysis, water (along with small solutes) moves from the blood to dialysate in the dialyzer as a result of a hydrostatic pressure gradient between the blood and dialysate compartments. The rate of ultrafiltration will depend on the total pressure difference across the membrane (calculated as the pressure in the blood compartment minus the pressure in the dialysate compartment).
b. Ultrafiltration coefficient (KUF). The permeability of dialyzer membranes to water, though high, can vary considerably and is a function of membrane thickness and pore size. The permeability of a membrane to water is indicated by its ultrafiltration coefficient, KUF. KUF is defined as the number of milliliters of fluid per hour that will be transferred across the membrane per mm Hg pressure gradient across the membrane.
2. Osmotic ultrafiltration. Osmotic ultrafiltration is described in Chapter 21.
3. Purpose of ultrafiltration. Ultrafiltration during dialysis is performed for the purpose of removing water accumulated
either by ingestion of fluid or by metabolism of food during the interdialytic period. Typically, a patient being dialyzed thrice weekly will gain 1-4 kg of weight between treatments (most of it water), which will need to be removed during a 3-4-hour period of dialysis. Patients with acute fluid overload may need more rapid fluid removal. Thus, the clinical need for ultrafiltration usually ranges from 0.5 to 1.2 L/hr.
either by ingestion of fluid or by metabolism of food during the interdialytic period. Typically, a patient being dialyzed thrice weekly will gain 1-4 kg of weight between treatments (most of it water), which will need to be removed during a 3-4-hour period of dialysis. Patients with acute fluid overload may need more rapid fluid removal. Thus, the clinical need for ultrafiltration usually ranges from 0.5 to 1.2 L/hr.
4. Use of ultrafiltration to enhance solute clearance
a. Hemofiltration and hemodiafiltration. Whereas diffusive removal of a solute depends on its size, all ultrafiltered solutes below the membrane pore size are removed at approximately the same rate. This principle has led to use of a technique called hemofiltration, whereby a large amount of ultrafiltration (more than is required to remove excessive fluid) is coupled with infusion of a replacement fluid in order to remove solutes. Although hemodialysis and hemofiltration often show comparable removal of small solutes such as urea (MW 60), hemofiltration can effect much higher removal of larger, poorly diffusible solutes, such as inulin (MW 5,200). Sometimes hemodialysis and hemofiltration are combined. The procedure is then called hemodiafiltration.
C. Removal of protein-bound compounds. The normal kidney detoxifies protein-bound organic acids and bases. Being protein bound, they are filtered to only a small extent and so bypass the glomerulus (Sirich, 2013). However, in the peritubular capillary network, these substances are removed from albumin and are taken up by proximal tubular cells. Then they are secreted into the tubular lumen, to be excreted in the urine. Other protein-bound compounds (bound to albumin and small proteins) are filtered in the glomerulus along with their carrier proteins. In the proximal tubule, the filtered proteins are catabolized along with their bound compounds.
The plasma concentration of such protein-bound substances is markedly elevated in dialysis patients (Sirich, 2013), but the association between high blood levels of these compounds and mortality is not completely clear (Melamed, 2013). Removal of protein-bound compounds by hemodialysis depends on the percentage of the “free” fraction of the compound in plasma (the fraction that is exposed to dialysis). Also, removal depends on how quickly the free fraction is replenished by the protein-bound pool. Substances that are tightly bound to proteins with a low free fraction in the plasma will be removed to a small extent by conventional hemodialysis.
II. SOLUTE REMOVAL FROM THE PERSPECTIVE OF THE DIALYZER. In clinical use, the box containing two solutions in Figure 3.1 becomes the dialyzer, containing blood and dialysis solution. The latter consists of highly purified water to which sodium, potassium, calcium, magnesium, chloride, bicarbonate, and dextrose have been added. The low-molecular-weight waste products that
accumulate in uremic blood are absent from the dialysis solution. When uremic blood is exposed to dialysis solution, the flux rate of these waste solutes from blood to dialysate is initially much greater than the back-flux from dialysate to blood. Eventually, if the blood and dialysate were left in static contact with each other via the membrane, the concentration of permeable waste products in the dialysate would become equal to that in the blood, and no further net removal of waste products would occur. Transport back and forth across the membrane would continue, but the rates of transport and back-transport would be equal. In practice, during dialysis, concentration equilibrium is prevented, and the concentration gradient between blood and dialysate is maximized, by continuously refilling the dialysate compartment with fresh dialysis solution and by replacing dialyzed blood with undialyzed blood. Normally, the direction of dialysis solution flow is opposite to the direction of blood flow (Fig. 3.2). The purpose of “countercurrent” flow is to maximize the concentration difference of waste products between blood and dialysate in all parts of the dialyzer.
accumulate in uremic blood are absent from the dialysis solution. When uremic blood is exposed to dialysis solution, the flux rate of these waste solutes from blood to dialysate is initially much greater than the back-flux from dialysate to blood. Eventually, if the blood and dialysate were left in static contact with each other via the membrane, the concentration of permeable waste products in the dialysate would become equal to that in the blood, and no further net removal of waste products would occur. Transport back and forth across the membrane would continue, but the rates of transport and back-transport would be equal. In practice, during dialysis, concentration equilibrium is prevented, and the concentration gradient between blood and dialysate is maximized, by continuously refilling the dialysate compartment with fresh dialysis solution and by replacing dialyzed blood with undialyzed blood. Normally, the direction of dialysis solution flow is opposite to the direction of blood flow (Fig. 3.2). The purpose of “countercurrent” flow is to maximize the concentration difference of waste products between blood and dialysate in all parts of the dialyzer.
A. Extraction ratio. Figure 3.3 shows a schematic of a dialyzer and its effects on the serum urea nitrogen (SUN) concentration of blood entering and leaving the dialyzer. The extraction ratio is the percentage reduction of urea (or any other solute) across the dialyzer. In the case shown, with blood flow rate (QB) of 400 mL/min, the inlet SUN (blood urea nitrogen) is 100 mg/dL and the outlet concentration is 40 mg/dL; hence, the extraction
ratio is 60% (100 – 40)/100. The extraction ratio is not affected by the inlet SUN level. Under the same conditions, if the inlet SUN were 200 mg/dL, the outlet SUN would be 80, and if the inlet SUN were 10, the outlet SUN would be 4.
ratio is 60% (100 – 40)/100. The extraction ratio is not affected by the inlet SUN level. Under the same conditions, if the inlet SUN were 200 mg/dL, the outlet SUN would be 80, and if the inlet SUN were 10, the outlet SUN would be 4.
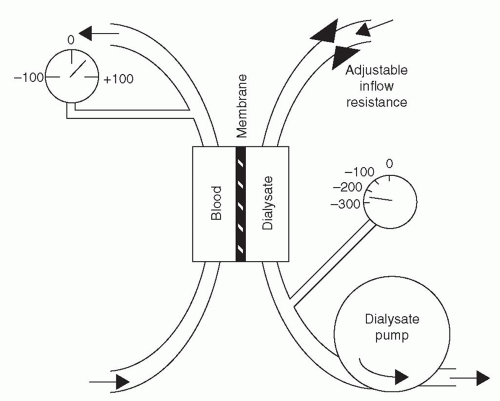 FIGURE 3.2 A dialyzer with blood flowing in one direction and dialysis solution flowing in the opposite direction. Hydrostatic pressure across the membrane (and ultrafiltration) is adjusted by varying the resistance to inflow of dialysis solution. |
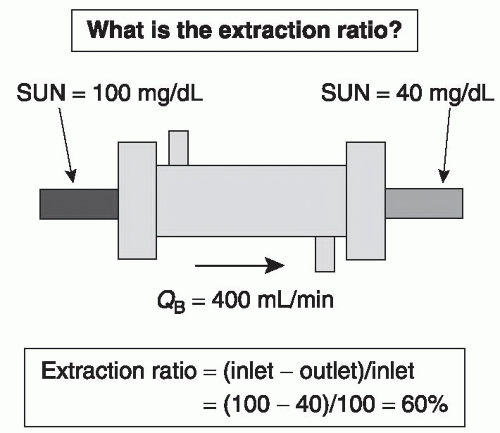 FIGURE 3.3 The dialyzer extraction ratio for urea as a function of inlet and outlet urea concentration. |
The extraction ratio is affected by the rate of blood flow through the dialyzer (Fig. 3.4). If blood flow rate were reduced from 400 to 200 mL/min, the outlet SUN would decrease from 40 to 12 mg/dL. If blood flow rate were reduced to 1 mL/min, the outlet SUN would be very low, about 1 mg/dL, and if a very high rate of blood flow were used, 20 L/min, the outlet SUN would increase to about 97 mg/dL. The faster the blood flows through the dialyzer, the less time it spends in the filter. The dialyzer blood compartment volume is about 100 mL, so at a flow rate of 400 mL/min, the blood is spending
about 15 seconds in the dialyzer. On reducing the flow to 200 mL/min, the transit time doubles, to 30 seconds, and because of this, the blood has more time to be “cleaned,” and the SUN in the blood exiting the dialyzer is only 12 mg/dL. On reducing flow to 1 mL/min, the blood would spend a full 100 minutes in the dialyzer, and the outlet blood would have a very low concentration of urea nitrogen. On the other hand, at a very rapid flow rate, much higher than could be achieved in practice, say 20,000 mL/min, the blood would spend only 0.3 seconds in the dialyzer. Still, the outlet SUN would be lower than the inlet and might be about 97 mg/dL. In effect, the dialyzer is a “washing machine,” and the less time the blood spends in the machine, the lower the percentage of waste products removed from a given volume of blood.
about 15 seconds in the dialyzer. On reducing the flow to 200 mL/min, the transit time doubles, to 30 seconds, and because of this, the blood has more time to be “cleaned,” and the SUN in the blood exiting the dialyzer is only 12 mg/dL. On reducing flow to 1 mL/min, the blood would spend a full 100 minutes in the dialyzer, and the outlet blood would have a very low concentration of urea nitrogen. On the other hand, at a very rapid flow rate, much higher than could be achieved in practice, say 20,000 mL/min, the blood would spend only 0.3 seconds in the dialyzer. Still, the outlet SUN would be lower than the inlet and might be about 97 mg/dL. In effect, the dialyzer is a “washing machine,” and the less time the blood spends in the machine, the lower the percentage of waste products removed from a given volume of blood.
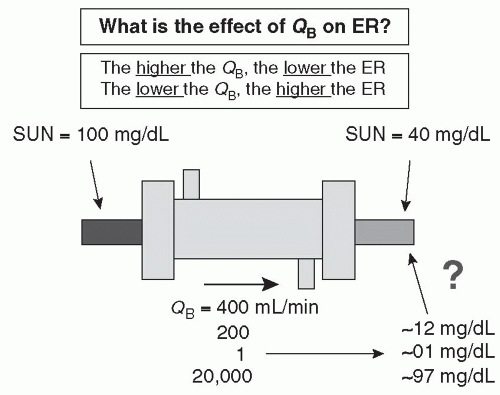 FIGURE 3.4 Effect of blood flow rate on the outlet SUN. |
B. Concept of clearance. As shown in Figure 3.5, the blood exiting the dialyzer can be considered in one of two ways. One can consider the entire volume and the percentage reduction of solute in that volume, or one can separate out the flow exiting the dialyzer into two streams—in the first stream, the concentration of solute will be the same as the inlet concentration, and in the second stream, all urea nitrogen will have been removed. One can think of an extraction ratio or reduction in SUN of 60% for the combined outlet stream, or one can consider that 60% of the fluid flowing through the dialyzer has been completely cleared of urea. If we mix the unchanged stream with the cleared stream, the concentration of urea nitrogen in the mixed stream will be reduced by 60% relative to that in the dialyzer
inlet. One can calculate what the relative flow rates of the unchanged stream and the cleared stream would need to be to achieve mass balance. In this case, the flow rate of the cleared stream is simply 60% of the inlet flow rate. If the inlet flow rate is 400 mL/min, the flow rate of the cleared stream would be 0.60 × 400 = 240 mL/min, and the flow rate of the unchanged stream would be 160 mL/min. Thus, a dialyzer extraction ratio of 60% translates into a dialyzer clearance of 0.6 × blood inflow rate (QB), or 240 mL/min. Clearance is usually abbreviated as “K” or “KD.” Flow rate is abbreviated as “Q,” and blood flow rate is abbreviated as “QB,” and dialysate flow rate as “QD.”
inlet. One can calculate what the relative flow rates of the unchanged stream and the cleared stream would need to be to achieve mass balance. In this case, the flow rate of the cleared stream is simply 60% of the inlet flow rate. If the inlet flow rate is 400 mL/min, the flow rate of the cleared stream would be 0.60 × 400 = 240 mL/min, and the flow rate of the unchanged stream would be 160 mL/min. Thus, a dialyzer extraction ratio of 60% translates into a dialyzer clearance of 0.6 × blood inflow rate (QB), or 240 mL/min. Clearance is usually abbreviated as “K” or “KD.” Flow rate is abbreviated as “Q,” and blood flow rate is abbreviated as “QB,” and dialysate flow rate as “QD.”
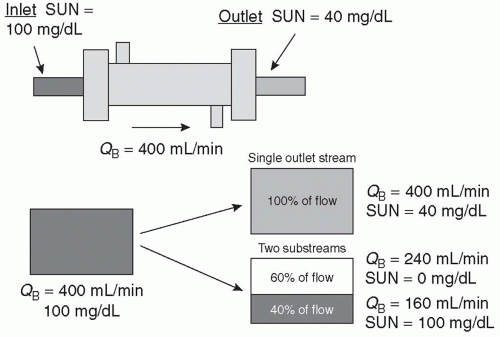 FIGURE 3.5 Concept of dialyzer clearance. The blood exiting the dialyzer can be looked at in two ways: (1) as one outlet stream where the solute concentration has been reduced by 60% (from 100 to 40 mg/dL) or (2) as two substreams: in one substream the solute concentration is unchanged, and in the other substream the solute has been completely removed. The flow rate of the cleared substream is the dialyzer “clearance” and is equal to the extraction ratio multiplied by the blood flow rate. |
1. Effect of dialyzer blood flow rate on clearance. We now can look at the effects of blood flow (QB) on dialyzer clearance (KD). From Table 3.1, we see that when blood flow is very low, 50 mL/min, the blood in the dialyzer is cleaned very well, due to a long residence time in the dialyzer, and the outlet SUN is only 1 mg/dL, with an extraction ratio of 99%. However, the amount of blood cleared is limited by the flow rate of 50 mL/min; although 99% of the blood is cleared, 99% of 50 mL/min is a low number. When the blood flow rate is increased, the blood is only partially cleared of urea due to less time spent in the dialyzer, but even though the extraction ratio falls as blood flow rate is increased, the volume of blood cleared of urea nitrogen keeps increasing as the blood flow rate is increased. Ultimately, when blood flow rate is very high, 20 L/min, the clearance in this particular example is 600 mL/min, even though only 3% of the inlet SUN is removed.
2. The K0A, mass transfer area coefficient. If the extraction ratio remained constant at 60%, a doubling of the blood flow rate would double the clearance. However, removal efficiency falls at higher blood flow rates, and so the clearance does not increase with QB in a 1:1 ratio. Ultimately, at very high blood flow rate, the clearance will plateau. The theoretical maximum clearance of a dialyzer (for a given solute) at infinite blood and dialysate flow rates is called the K0A and has units of mL/min. For the dialyzer in Table 3.1, the K0A is close to 600 mL/min. The K0A also has a physical aspect. It is the multiple of two quantities: K0, the permeability
coefficient of the dialyzer membrane for a given solute, and A, the total effective surface area of the membrane in the dialyzer. Doubling the surface area of the membrane in a dialyzer will roughly double the K0A. Two dialyzers of the same surface area do not necessarily have the same K0A, as the K0 values of the membranes used in those dialyzers can be markedly different. The K0 can be increased by making the membrane thinner, by adjusting its porosity, and by optimizing the fluid path of dialysate in the dialyzer using spacer yarns and other features.
coefficient of the dialyzer membrane for a given solute, and A, the total effective surface area of the membrane in the dialyzer. Doubling the surface area of the membrane in a dialyzer will roughly double the K0A. Two dialyzers of the same surface area do not necessarily have the same K0A, as the K0 values of the membranes used in those dialyzers can be markedly different. The K0 can be increased by making the membrane thinner, by adjusting its porosity, and by optimizing the fluid path of dialysate in the dialyzer using spacer yarns and other features.
TABLE 3.1 Effect of dialyzer blood flow rate on extraction ratio and clearance (inlet SUN = 100 mg/dL) | ||||||||||||||||||||||||
|---|---|---|---|---|---|---|---|---|---|---|---|---|---|---|---|---|---|---|---|---|---|---|---|---|
|
Figure 3.6 shows the relationship between blood flow rate (QB) on the horizontal axis and expected dialyzer clearance (KD) on the vertical axis. Each isopleth (curved line) represents a different efficiency dialyzer, where dialyzer efficiency is expressed as dialyzer K0A. The values of K0A in Figure 3.6 range from 300 to 1,600 mL/min. Most dialyzers in common use today for adults have K0A values of 800-1,600. This figure shows that as the blood flow is
increased, the clearance increases, but the increase tends to level off. You can see that when QB is low (˜200 mL/min), dialyzers in the 800-1,600-mL/min K0A range have similar clearances. This is because at this low blood flow rate, they are each extracting almost all of the urea in the blood entering the dialyzer. The benefits of a “highefficiency” (high K0A) dialyzer become apparent primarily when the blood flow rate is high. Then the larger dialyzers with thinner, more efficient membranes are able to keep the extraction rate high, maximizing the increase in dialyzer clearance.
increased, the clearance increases, but the increase tends to level off. You can see that when QB is low (˜200 mL/min), dialyzers in the 800-1,600-mL/min K0A range have similar clearances. This is because at this low blood flow rate, they are each extracting almost all of the urea in the blood entering the dialyzer. The benefits of a “highefficiency” (high K0A) dialyzer become apparent primarily when the blood flow rate is high. Then the larger dialyzers with thinner, more efficient membranes are able to keep the extraction rate high, maximizing the increase in dialyzer clearance.
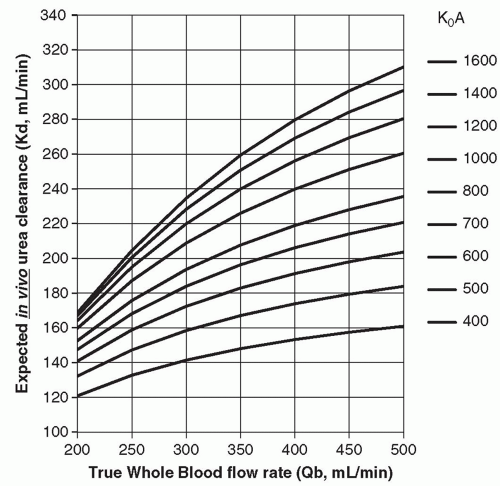 FIGURE 3.6 Relationship between blood flow rate (QB) and dialyzer blood water urea clearance (K) as a function of dialyzer efficiency (K0A). Each isopleth (curved line) represents a different dialyzer having a different K0A value. To use the nomogram, find the blood flow rate on the horizontal axis, then move up to the dialyzer K0A being used, and read of the expected dialyzer urea clearance on the vertical axis. Theoretical clearance values have been adjusted to more closely reflect expected values in vivo. |
3. Calculating the solute removal rate. For a situation where a uniform solution is running through the dialyzer, one can calculate the removal rate (in mg/min or mmol/min) of a given solute. For example, if the inlet SUN is 1 mg/mL and we are clearing 240 mL/min of blood of urea, then we are removing 240 mg/min of urea nitrogen from the patient.
4. Effect of erythrocytes. In the concept of clearance described earlier, the blood was treated as a simple fluid. However, this is not the case. At a hematocrit of 30%, a blood flow of 400 mL/min is really a plasma flow rate of 280 mL/min and an erythrocyte flow rate of 120 mL/min. What is measured at the dialyzer inlet and outlet are the plasma levels of a given waste product. For urea, the presence of erythrocytes is not a major problem because urea diffuses into and out of erythrocytes quickly. For example, if the outlet plasma urea nitrogen level is 40 mg/dL, the urea concentration in erythrocytes will have been reduced to about that level also. For creatinine and phosphorus and many other solutes, the problem is more complex because these substances do not equilibrate quickly between plasma and erythrocytes. In fact, very little creatinine or phosphorus is removed from red blood cells during passage through the dialyzer. When calculating the removal rate of creatinine or phosphorus in mg/min or mmol/min, one needs to use the plasma flow rate instead of the blood flow rate.
5. Effect of blood water. As noted, urea is dissolved in erythrocytes and plasma water and is removed from both during passage through the dialyzer. Approximately 93% of plasma is water (depending on its protein concentration), and about 72% of an erythrocyte is water. Some urea associates with the nonwater portion of erythrocytes. On average, urea is dissolved in a volume that is about 86% of the blood. The correction for blood water becomes important when using the dialyzer clearance to compute how much urea is being removed during a dialysis session.
For solutes like creatinine and phosphorus that are removed from the plasma compartment only passage through the dialyzer, the volume of removal is about 93% of
the plasma flow rate. Increasing the hematocrit (e.g., from 20% to 40%) causes only a trivial reduction of the blood water urea clearance but will be associated with a noticeable reduction in the clearance of creatinine or phosphorus, due to the effect of hematocrit on the plasma flow rate.
the plasma flow rate. Increasing the hematocrit (e.g., from 20% to 40%) causes only a trivial reduction of the blood water urea clearance but will be associated with a noticeable reduction in the clearance of creatinine or phosphorus, due to the effect of hematocrit on the plasma flow rate.
6. Effect of dialysis solution flow rate. Dialyzer clearance of urea (and other solutes) depends on the dialysis solution flow rate as well. A faster dialysis solution flow rate increases the efficiency of diffusion of urea from blood to dialysate although the effect is usually modest. The usual dialysis solution flow rate is 500 mL/min. A flow rate of 800 mL/min will increase urea clearance by about 5%-8% when a high-efficiency dialyzer is used and when the blood flow rate is greater than 350 mL/min. On the other hand, in some daily, nocturnal, or intensive care unit (ICU)-based applications, dialysate flow rate is markedly lower than 500 mL/min. Such a reduced dialysate flow rate can cause substantial reduction in dialyzer clearance. The optimum dialysis solution flow rate is 1.5-2.0 times the blood flow rate. Above that, the increase in efficiency is quite small, especially with some of the newer dialyzers where the dialysis solution flow path has been optimized.
7. Effect of molecular weight on diffusive clearance. Because high-molecular-weight solutes move slowly through solutions, they diffuse poorly through the membrane. As a result, the extraction ratio for molecules larger than urea will be less than that of urea; plus, to calculate clearance, this lower extraction ratio must be multiplied by the plasma flow rate, and not the blood flow rate.
8. Very large molecules. Very large molecules, such as β2-microglobulin (MW 11,800), cannot get through the pores of standard (low-flux) dialysis membranes at all. Thus, dialyzer clearance of β2-microglobulin will be zero! “High-flux” membranes have pores of sufficient size to pass this large molecule. Also, some dialysis membranes remove β2-microglobulin by adsorption.
9. Dialyzer efficiency versus flux. When we speak of dialyzer efficiency, we refer primarily to the ability of a dialyzer to remove small solutes. The dialyzer efficiency is best represented by the K0A for urea. The flux of a dialyzer refers to its ability to remove very large molecules such as β2-microglobulin. There is no single measure in common use to specify the flux of a dialyzer, though water permeability (KUF) can be used. Usually high-flux dialyzers will have a water permeability greater than 15-20 mL/hr per mm Hg. One can have a small, low-efficiency (K0A = 400 mL/min) dialyzer (e.g., for use in children) that is high flux, or a high-efficiency dialyzer (K0A = 1,200 mL/min) that is low flux and that removes urea very well but that removes no β2-microglobulin.
III. SOLUTE REMOVAL FROM THE PATIENT PERSPECTIVE
A. Importance of urea. Measurement of solute removal during hemodialysis focuses on urea. Urea is manufactured by the liver from amino acid nitrogen via ammonia and is the principal way in which nitrogenous waste products are excreted from the body. Urea is a small molecule, with a molecular weight of 60 Da. It is only slightly toxic. Urea generation occurs in proportion to protein breakdown as reflected in the protein nitrogen appearance (PNA) rate. In stable patients, the PNA is proportional to dietary protein intake. Using a mathematical model known as urea kinetics, one can compute both the rate of removal and production of urea. The extent of urea removal gives us a measure of the adequacy of dialysis, and the amount of urea nitrogen generation gives an estimate of dietary protein intake.
B. The weekly serum urea nitrogen profile. As a result of dialysis, the predialysis SUN level is typically reduced by about 70% so that postdialysis SUN is 30% of the predialysis value. During the subsequent interdialytic period (assuming a thrice-weekly dialysis schedule), the SUN will rise to almost the same level as that seen prior to the first treatment. The result is a sawtooth pattern. The time-averaged (TAC) SUN level can be computed mathematically as the area under the sawtooth curve divided by time. Both the predialysis SUN and TAC SUN levels reflect the balance between urea production and removal. For a given level of dialysis therapy, predialysis SUN and TAC SUN will rise if urea nitrogen generation (g) is increased and will fall if g is decreased. Also, for any given rate of urea nitrogen generation, predialysis SUN and TAC SUN levels will rise if the amount of dialysis is decreased or will fall if the amount of dialysis is increased.
C. Pitfalls in targeting a predialysis SUN or TAC SUN. Early attempts to model dialysis adequacy focused on predialysis SUN or on the TAC SUN. Therapy was thought to be adequate as long as predialysis or TAC SUN was appropriately low. However, low predialysis or TAC SUN levels were found to be associated with a high mortality rate and were found to most often reflect inadequate protein intake rather than adequate dialysis.
D. Indices of urea removal
1. Urea reduction ratio (URR). The current primary measure of dialysis adequacy is the treatment-related URR. This is computed as follows: Assume that predialysis SUN is 60 mg/dL and postdialysis SUN is 18 mg/dL. The relative reduction in SUN (or urea) level is (60 – 18)/60 = 42/60 = 0.70. By convention, URR is expressed as a percentage, so the value of the URR in this example would be 70%.
SI units: Assume that predialysis serum urea is 21 mmol/L and postdialysis is 6.4 mmol/L. The relative reduction in SUN (or urea) level is (21 – 6.4)/21 = 14.6/21 = 0.70.
2. Kt/V urea. The Kt/V urea was popularized by Gotch and Sargent in their reanalysis of the National Cooperative Dialysis Study (1985). In that study, a urea Kt/V value <0.8 was
found to be associated with a high likelihood of morbidity and/or treatment failure, while a Kt/V >1.0 was associated with a good outcome. Largely because of this study, guidelines groups have recommended a minimum Kt/V value of at least 1.2 for hemodialysis patients being dialyzed three times per week.
found to be associated with a high likelihood of morbidity and/or treatment failure, while a Kt/V >1.0 was associated with a good outcome. Largely because of this study, guidelines groups have recommended a minimum Kt/V value of at least 1.2 for hemodialysis patients being dialyzed three times per week.
The Kt/V urea is a dimensionless ratio representing volume of plasma cleared of urea (Kt) divided by the urea distribution volume (V). K is the dialyzer blood water urea clearance (L/hr), t is dialysis session length (hours, hr), and V is the distribution volume of urea (liters, L), which is close to total body water.
K × t = L/hr × hr = L
V = L
(K × t)/V = L/L = dimensionless ratio
If we deliver a Kt/V of 1.0, this implies that K × t, or the total volume of blood cleared during the dialysis session, is equal to V, the urea distribution volume.
3. How URR is related to Kt/V. To understand this best, consider Figures 3.7,3.8,3.9


Stay updated, free articles. Join our Telegram channel
Full access? Get Clinical Tree
