What would happen if a metastable form could not form (if, for instance, the rate of cooling is too rapid)? Then the volume and enthalpy would continue to decrease along the supercooled liquid line, as shown in Figure 8.1. Although formally the supercooled liquid state is not at a position of thermodynamic equilibrium, the time scales over which molecular movement can occur during this phase are short and so any change in temperature will result in an essentially immediate change in structural and thermodynamic properties. The supercooled liquid is considered to be in structural equilibrium.
If the properties of the supercooled liquid were to keep changing linearly with reducing temperature, at some point intersection with the line for the perfect crystal would occur (represented by the dotted extrapolation in Figure 8.1); the temperature of intersection is denoted the Kauzmann temperature (TK). TK represents a paradox because, as noted earlier, no arrangement of molecules is possible that results in a smaller volume or enthalpy than the perfect crystal. Some physical transformation must occur before the Kauzmann temperature is reached. That transformation is the formation of a glass and it will occur at the glass transition temperature (Tg), also shown in Figure 8.1.
- Amorphous means lack of form.
- Amorphous materials have no long-range structural order and excess energy over the crystalline state. This means one barrier to dissolution is removed, leading to rapid dissolution, higher solubility and greater bioavailability.
- Although not easy to define, amorphous materials can be thought of as having the structure of a liquid but the viscosity of a solid.
- Amorphous materials form by rapid cooling. The molecules do not have time to form a crystal and instead exist as a supercooled liquid.
- The glass transition prevents the energy and volume of a supercooled liquid becoming lower than that of a perfect crystal.
Study question 8.1 What physical changes in the material might cause this discontinuity at the glass transition temperature?
It was noted above that the concept of the supercooled liquid being in structural equilibrium depended upon the rate of molecular mobility being reasonably fast, such that structural rearrangement occurred in response to a change in temperature in an essentially instantaneous timeframe. Below the glass transition temperature the rate of molecular mobility is reduced to the point where structural rearrangement does not occur in response to a change in temperature. Effectively, below the glass transition temperature the molecular structure can be considered ‘frozen’ and the material is a glass (note that this definition does not preclude the movement of molecules over extended time periods – see the concept of relaxation below – just over short time periods). A slightly easier conceptualisation is that an amorphous matrix has the structural arrangement of a liquid but the viscosity of a solid.1
The discontinuity in molecular mobility leads to two further descriptions of amorphous materials. Above Tg amorphous materials are termed rubbery and below Tg they are termed brittle (or glassy). These terms originate from the polymer field and are descriptive of the macroscopic physical state of polymeric materials (both are easily demonstrated by freezing an elastic band in liquid nitrogen – brittle – and then allowing it to thaw and pass through its glass transition – rubbery). They are not necessarily descriptive of the macroscopic physical state of small molecular weight organic pharmaceuticals, however, where it can be difficult to imagine a powder as rubbery. Nevertheless, the terms have stuck and the preformulation scientist should be familiar with their meaning.
Study question 8.2 Given the above discussion, what do you think about the concept of polyamorphism?
- As the volume of a supercooled liquid reduces, the viscosity must increase, since the same number of molecules are occupying a gradually reducing volume.
- Above the glass transition temperature, a change in temperature occurs with an essentially immediate change in structure – the matrix is described as rubbery.
- Below the glass transition temperature, a change in temperature does not occur with an immediate change in structure – the matrix is described as brittle or glassy.
8.3 Ageing of amorphous materials
The extrapolated line in Figure 8.1 represents the equilibrium glassy state (in effect, the structural arrangement) that the system would have attained had it not formed a glass. It is often considered a ‘virtual’ state, because although it can be conceived and defined, it does not actually exist, although it is the structural arrangement to which a real glass will tend if it is held at any particular temperature below Tg. The temperature at which the glass is held isothermally is known as the annealing temperature, Ta, and the approach from the glassy state to the equilibrium glassy state is known as relaxation (represented by process (i) in Figure 8.1).
Relaxation, as noted earlier, is simply a macroscopic manifestation of the movement of molecules. Two modes of relaxation are usually defined: structural relaxation and Johari–Goldstein relaxation. Structural relaxation (termed α-relaxation) describes whole molecule movements (such as diffusional motion and viscous flow) while Johari–Goldstein relaxation (termed β-relaxation) is usually taken to represent intramolecular motion (such as rotation of a side-chain). In the context of pharmaceuticals, α-relaxation events are usually considered to be more important than β-relaxation events.
Since it is in a nonequilibrium state, any glass is thermodynamically unstable and its physical properties will eventually change, via relaxation, partial crystallisation or complete crystallisation, as the molecules move and align and the system loses excess enthalpy. The rate of molecular mobility will increase with a rise in temperature and/or the addition of a plasticiser. (Plasticisers are small molecules, often water or organic vapours, that can easily penetrate the spaces between the molecules in an amorphous matrix, altering its physical and thermodynamic properties. In effect, the plasticiser lowers the Tg of the material. When sufficient plasticiser has been added to reduce Tg below storage temperature, the material will recrystallise.) Water is usually a plasticiser for amorphous drug substances (unless they are very hygrophobic), which is why control of RH is often a critical factor in determining physical stability, but many solvents (such as ethanol) act as plasticisers also.
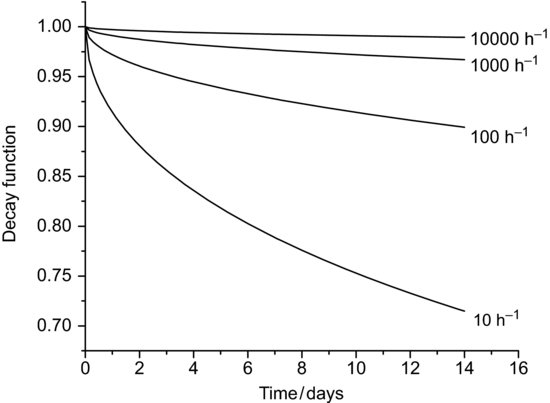
A simple (but quantitative) view of relaxation is that it is the sum of all the changes in molecular configuration that must occur in the amorphous matrix for it to change from the glass to the equilibrium glassy state at a given annealing temperature (Ta). The decay function that characterises relaxation can be expressed as
(8.1)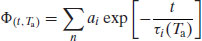
where Φ(t, Ta) is the decay function at time t and annealing temperature Ta, n is the total number of states that are changing independently and ai is a weighting factor for each state i with an exponential decay constant τi.
The number of molecules is obviously large, and so a simpler mathematical interpretation is to consider the matrix as comprising a number of microstates (n); each microstate may contain many molecules but they will all be relaxing at the same rate. Relaxation may then be approximated as the sum of all the changes in configuration of the microstates, usually expressed by the Kohlrausch–Williams–Watts (KWW) equation (Williams and Watts, 1970):
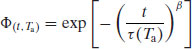
where τ represents the relaxation time and β is known as the stretch power. Although Equation (8.2) is purely empirical, some physical meaning has been ascribed to its parameters (Phillips, 1994). The stretch power β (which usually has a value between 0 and 1) can be taken to reflect the distribution of independently relaxing states; when β is small, the distribution of the microstates is wide (i.e. there would be a significant number of microstates with widely differing relaxation times) and when β approaches unity the distribution of the microstates is very narrow. In order to describe the dynamics of relaxation in amorphous materials both constants (β and τ) are required. While τ is the time constant and so essentially an indicator of the rate of relaxation, in practice the power term  is found to be a more reliable parameter (Kawakami and Pikal, 2005).
- Molecules in a glassy amorphous matrix will move over extended time periods – relaxation.
- Movement can be whole molecule or intramolecule.
- Relaxation will result in a loss in excess enthalpy and progression of the material towards the supercooled liquid line and, eventually, a crystalline state.
- The physicochemical properties of the material will change as relaxation occurs.
8.4 Characterisation of amorphous materials
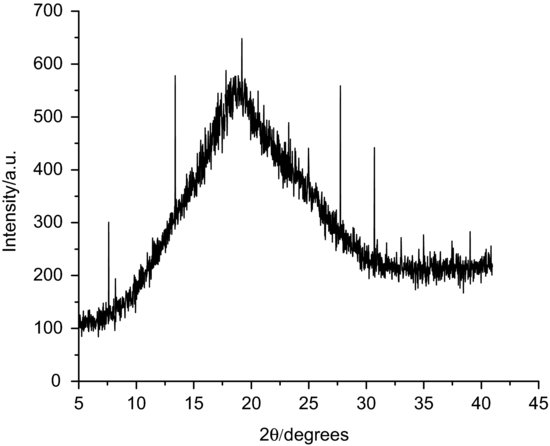
Unlike the case of polymorphic materials, there is no need for (nor is it possible to perform) structural characterisation of amorphous matrices (there is no structure). Confirmation that a material is amorphous can be achieved with XRPD. In this case, no specific peaks should be seen; rather, a broad diffraction pattern, known as a halo, is the defining characteristic (Figure 8.2). If a material partially crystallises, peaks will be seen superimposed on to the amorphous halo – the intensity change of any characteristic peak with time can be used as a quantitative indicator of crystallisation rate.
DSC is a particularly useful tool for studying the properties of amorphous materials because, as is apparent from Figure 8.1, many of the changes that occur with time result in a change in enthalpy. The primary indicator of the presence of an amorphous material is a step change in the baseline at Tg. The step change arises because the heat capacity of an amorphous material will be higher above the glass transition temperature as it becomes rubbery (a consequence of the dramatic increase in molecular mobility) – in simple terms, the molecules have more modes in which to convert the energy supplied to them to movement and hence it takes more energy to raise the sample in temperature. Typical DSC data for a glass transition are shown in Figure 8.3. The glass transition temperature can be defined in numerous ways, typically as a deviation from baseline or as an extrapolated mid-point.
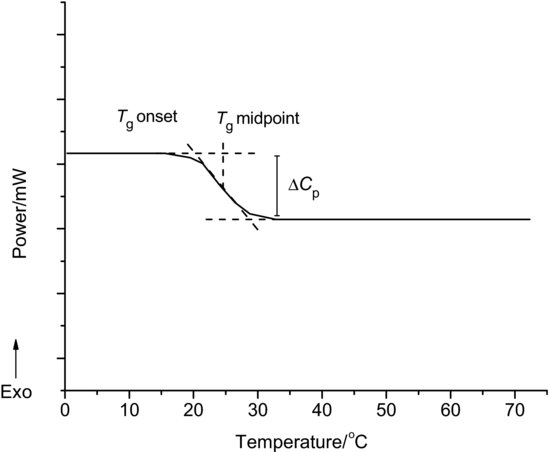
The glass transition is a kinetic transformation (involving movement of molecules) and so shows a dependence upon heating rate. In addition, the temperature range over which the transition occurs can be significant.
8.4.1 Measurement of ageing
DSC offers a rapid method to measure the relaxation of amorphous matrices at a particular annealing temperature. The method does not measure the loss in enthalpy as the sample relaxes, but rather is predicated on the fact that when an aged glass is heated, at the glass transition the material will revert back to the equilibrium supercooled liquid state. This occurs because above the glass transition the molecular mobility of the glass is sufficiently high that there will be a change in structural alignment in response to a change in temperature. Since the supercooled liquid line is the equilibrium state, once the molecules have sufficient mobility to reorient themselves, it is this state to which they will tend. The process is represented by line (ii) in Figure 8.1 and the energy is called the enthalpy of recovery (ΔrecH). The enthalpy is assumed to be equal and opposite to the enthalpy of relaxation (ΔrH).
Study question 8.3 How will the magnitude of the enthalpy of recovery change with annealing time? What does this mean for the sensitivity of the DSC measurement with annealing time?
Relaxation is described by an exponential decay function and so some method must be found to convert the enthalpy of recovery data (which would otherwise be described by a growth function). To do this, the maximum enthalpy of recovery  ) is needed, such that
(8.3)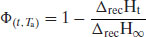
The value of  is determined from heat capacity change (ΔCp) at the glass transition:
(8.4)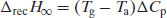
Thus, a plot of  as a function of time can be constructed (Figure 8.4); fitting these data to the KWW equation (by least squares minimisation) allows the derivation of τ and β.
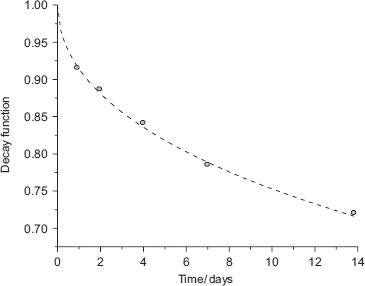
The rate of decay is affected by both the time constant and temperature. An increase in either causes faster decay, although the time constant is the dominant factor (Figures 8.5 and 8.6).
< div class='tao-gold-member'>