But by definition,

Thus for a one-compartment model,

To help understand how compartments are used in pharmacokinetics, it is useful to bear in mind how the compartmental characteristics are related to true body characteristics. These relationships are summarized in Table 7.1.
FIGURE 7.1 Linear (a) and semilogarithmic (b) plots of Cp against time after intravenous administration in the one-compartment model.
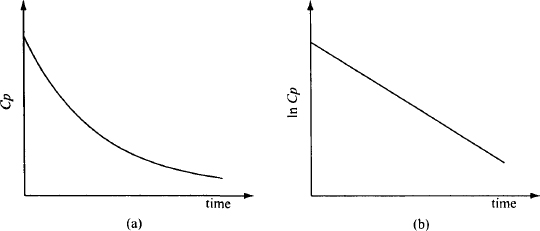
TABLE 7.1 Comparison of True Body Characteristics and Those of the Single Compartment
| Characteristic | Body | Compartment |
| Ab | Amount of drug in the body | Amount of drug in the compartment |
| Cp | Plasma concentration | Compartment concentration |
| Drug concentration | Varies from tissue to tissue | Constant throughout |
| Vd | Ratio: Ab/Cp | Volume of the compartment |
7.3 PHARMACOKINETIC EQUATIONS
7.3.1 Basic Equation
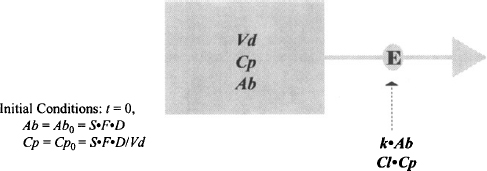
The basic model for an intravenous injection is shown in Figure 7.2. This model can be used to write expressions for how the amount of drug in the body changes over time. Once an expression for amount of drug in the body has been derived, it can converted to an expression for the plasma concentrations using the drug’s volume of distribution (Cp = Ab/Vd). Thus, the starting point,
FIGURE 7.2 Model for intravenous injection in a one-compartment model. S is the salt factor, F the bioavailability, D the dose, Ab the amount of drug in the body, Cp the plasma concentration, Vd the apparent volume of distribution (Ab/Cp), Cl the clearance, and k the overall elimination rate constant. Note that F = 1 after intravenous administration.
Integrate equation (7.1) from zero to infinity:
(7.2) 
Recall that the function e–kt decays from 1 to zero over time (see Appendix A). During this period, Ab decays from Ab0 to zero. The speed of decay is governed by k. The larger the value of k, the faster is the decay. Recall Ab0 = S · F · D,
(7.3) 
and Cp = Ab/Vd,
where Cp0 = S · F · D/Vd.
Also, since k = Cl/Vd [see equation (5.21)], all of the equations above could be rewritten substituting Cl/Vd for k. For example,
In summary, after an intravenous injection in a one-compartment model, Cp and Ab, which are always directly proportional to each other in a one-compartment model, decay from their initial values in a first-order manner:
- Ab decays over time from S · F · D to zero.
- Cp decays from S · F · D/Vd to zero.
- The rate of decay is controlled by k; the larger k is, the more rapid is the decay.
7.3.2 Half-Life
The half-life is the time required for the plasma concentration or the amount of drug in the body to fall by 50%. Elimination is a first-order process, and as shown in Appendix B,

7.3.3 Time to Eliminate a Dose
The plasma concentration and the amount of drug in the body are affected only by elimination, which is a first-order process. As a result, the number of half-lives required to eliminate any fraction of the original dose are the same as those needed to complete any fraction of a first-order process (see Appendix B). These are shown in Table 7.2.
TABLE 7.2 Number of Half-Lives to Eliminate a Certain Fraction of the Original Dose
| Fraction of Dose Eliminated | Number of Half-Lives |
| 0.10 |  a a |
| 0.20 |  a a |
| 0.50 | 1 |
| 0.90 | 3.3 |
| 0.95 | 4.4 |
| 0.99 | 6.6 |
| aApproximate values. | |
7.4 SIMULATION EXERCISE
Open the model “IV Bolus Injection in a One-Compartment Model” at the link
http://www.uri.edu/pharmacy/faculty/rosenbaum/basicmodels.html#chapter7
Default settings for the model are dose = 100 mg; Cl = 4.6 L/h, and Vd = 20 L.
- The Cp falls monoexponentially. It is influenced only by first-order elimination: Cp = Cp0·e−kt.
- A linear relationship exists between In Cp and time: In Cp = ln Cp0 – kt. These plots are observed for drugs that distribute in a very rapid, essentially instantaneous manner.
 is inversely proportional to Vd, t1/2 = 3 h, and k = 0.693/t1/2 = 0.231 h−1.
TABLE SE7.4 Summary of the Effects of Dose, Clearance, and Volume of Distribution on the Plasma Concentration–Time Profile
- Cp0 is proportional to the dose. Cp at any time is proportional to the dose. The slope and t1/2 are not influenced by the dose.
- CI does not influence Cp0, but as CI increases the slope of the fall in Cp be comes steeper (k increases and t1/2 decreases). Thus, increases in clearance result in lower plasma concentrations at all times, apart from that at time zero.
- Clearance is a constant for a particular drug, assuming normal healthy function. It should be noted, however, that as a biological parameter it will vary somewhat within the population. The values reported in textbooks and in the literature represent population average values. Beyond normal biological variability, clearance will change if the function of one or both of the major organs of elimination change. Thus, clearance is often changed in renal and/or hepatic disease. Concomitant medications can also alter the clearance of some drugs by inhibiting or inducing the enzymes involved in their metabolism. Changes in the activity of uptake and/or efflux transporters in the liver and kidney can also alter clearance.
Observe:
- As Vd increases, Cp0 gets smaller and the slope gets less steep (k decreases and t1/2 increases; t1/2 is proportional to Vd). Essentially, increases in Vd compress Cp over time and result in much less change or fluctuation in Cp.
- Again, the volume of distribution is a constant for a drug but in common with other biological parameters, its value will vary somewhat within the population. Beyond the normal variability, the volume of distribution can be altered by factors that change either body volumes or alter tissue/plasma protein binding. These include, hydration, dehydration, diseases such as congestive heart failure, hepatic disease, and renal disease, and concomitant medications that displace drugs from their binding sites volume of distribution.
7.5 APPLICATION OF THE MODEL
7.5.1 Predicting Plasma Concentrations
If a drug’s pharmacokinetic parameters are known, the plasma concentration can be estimated at any time after any intravenous dose.
Example 7.1 A 20-mg dose of a drug (S
Stay updated, free articles. Join our Telegram channel

Full access? Get Clinical Tree


