Distribution and Multiple Dosing
Outline
Drugs in Motion: In Vivo Pharmacokinetics155
New Terminology156
The Central Compartment and In Vivo Clearance156
Renal Excretion159
Drug Distribution162
Pharmacokinetics In Vivo166
Scaling Data to Predict Human Pharmacokinetic Behavior179
Summary181
This chapter puts in vitro pharmacokinetic data on absorption and metabolism into the context of the in vivo environnment. Discussion is focused on in vivo clearance (the removal of drug from the body) and volume of distribution, and how these factors control all of pharmacokinetics. Through the observation of the decay, with time, of drug levels from a single i.v. dose come estimates of clearance, volume of distribution and t½. In addition, a single oral dose can yield values for oral absorption (F). It will be seen how data from a limited number of in vivo experiments can yield a great deal of data that can be used to describe the pharmacokinetics of any drug. These data can also be used to predict pharmacokinetics in other species to further predict dosing in humans for clinical study. In vivo experiments can also detect complex mechanisms of drug–drug interactions and non-linear pharmacokinetics. In general, it will be seen that the rate of drug clearance is the dominant factor in determining frequency of dosing needed to attain adequate Css. Finally, allometric scaling, a procedure whereby the pharmacokinetic data obtained in a range of animal species and used as a predictor of pharmacokinetics in humans, is discussed.
Keywords:
allometric scaling, enterohepatic circulation, extraction ratio, non-linear pharmacokinetics, volume of distribution.
Drugs in Motion: In Vivo Pharmacokinetics
As shown in the previous chapter (see Fig. 7.4), a drug is nearly in constant motion from the instant it is introduced into the body until the time it leaves. Thus, the therapeutic target essentially responds to a running stream of drug of varying concentration. Chapter 9 discusses how this is relevant to the therapeutic response in vivo; this present chapter relates to the factors controlling the characteristics of that motion, what drug properties affect it and how they can be measured and quantified.
New Terminology
The following new terms will be introduced in this chapter:
• Allometric scaling: The process of using body weight to predict physiological parameters in different animal species.
• Cmax: The maximal peak concentration of drug observed in the central compartment as a result of a given dosing regimen.
• Cmin: The minimal concentration of drug observed in the central compartment during repeat dosing.
• Enterohepatic circulation: The secretion of substances from the liver into the bile duct; these substances then can be reabsorbed from the gastrointestinal tract back into the body.
• Extraction ratio: The amount of substance removed from a flow of drug into a removal organ (i.e., liver) expressed as a ratio of the quantity entering the organ.
• MRSD: Maximal recommended starting dose for a human clinical trial.
• NOAEL: No observed adverse effect level for a drug.
• NOEL: No observed effect level for a drug.
• Non-linear pharmacokinetics: The pharmacokinetics seen in vivo when the clearance capacity of the body begins to be exceeded by the drug levels in the central compartment.
• τ: The dosage interval, i.e., the period between dosing in repeat dosing studies.
• Volume of distribution: The virtual volume of water in which drug appears to be dissolved when concentrations are measured in the central compartment; it can be used to detect sequestration of drug in various parts of the body.
The Central Compartment and In Vivo Clearance
The process of permeation and absorption controls the rate of entry of a drug into the central compartment; once there, immediate factors begin the process of drug clearance from the body and/or other processes that make the drug inaccessible to the therapeutic target. One of those, namely plasma protein binding, has been discussed briefly in Chapter 7. This process sequesters drug away from metabolic and renal processes of removal; it will be seen later in this chapter that plasma protein binding keeps the drug in the central compartment and does not allow it to be sequestered into other tissues. This has the effect of reducing the volume of distribution of the drug (vide infra). While plasma protein binding reduces free drug concentration, generally it is not a problem that needs to be addressed through medicinal chemical alteration of the molecule (see Box 8.1). This is because dosing is usually adjusted to accommodate it and limitations in free drug concentration are somewhat offset by a reduction in clearance afforded by plasma protein binding. For example, the antimuscarinic antagonists Zamifenacin and Darifenacin are of comparable potency (between two- to four-fold differences in IC50) but differ by a factor of 300 in their plasma protein binding (Darifenacin is 94% protein bound while Zamifenacin is 98.98% protein bound). In spite of this radical difference in plasma protein binding, the equieffective clinical doses of Zamifenacin and Darifenacin differ by only a factor of two. In addition, the physico-chemical changes needed to change plasma protein binding are usually extensive and probably would interfere with primary activity or other ADME properties. The one realm where plasma protein is important is when clinical dose is compared to observed response and the true potency (and safety margin) of drugs needs to be calculated. This will be considered further in the next chapter (Chapter 9) on the measurement of pharmacologic effect in vivo.
Box 8.1
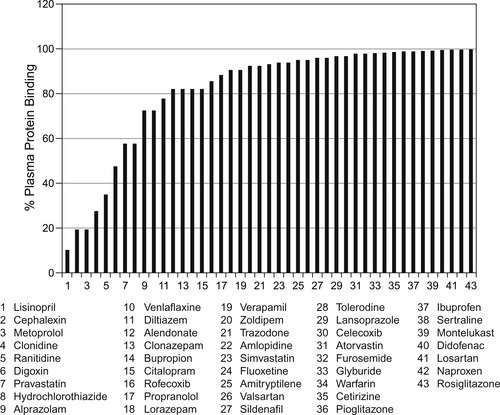
While plasma protein binding can cause dissimulations between observed dosage of effective drugs and the concentration in the biophase actually producing the effect, it is not considered a roadblock to the development of drug therapies. Below are shown 43 of the 100 most prescribed drugs in the USA; it can be seen that over half are >90% plasma protein bound and some are >99.99% protein bound. In spite of this, the dosage administered accounts for this effect and these are useful therapies.
 |
Another way in which the central compartment drug concentration can change is through metabolic destruction; this is particularly true of esters as there are plasma esterases present to degrade esters to carboxylic acids. For example, the anticholinergic mydriatic drug eucatropine is destroyed in human plasma within 35 minutes. Similarly, the local anaesthetic procaine is destroyed in only a few minutes.
In addition to these factors, there are three forces moving drugs out of the central compartment (see Fig. 7.4), these are: (1) distribution to other compartments in the body; (2) renal excretion and (3) hepatic metabolism. Of these, hepatic metabolism is usually the most important and this will be considered first.
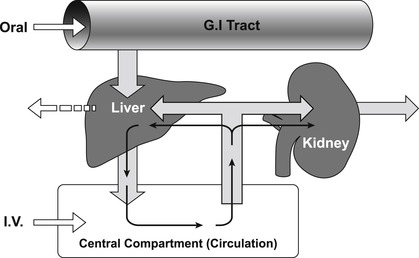
The body is a non-equilibrium system where drugs enter at a certain rate and are removed at a certain rate; the removal of a drug from the body is referred to as drug clearance. Drugs can be cleared through numerous organs in the body (i.e., liver, kidney, brain, lungs, sweat glands, etc.) and these are all treated as processes connected in parallel, except for the lungs which are considered a series process. Drugs introduced via the oral route undergo first pass metabolism (absorption from the gastrointestinal tract and then immediate shunting via the portal vein into the liver) while drugs introduced into the central compartment by other routes of administration are mainly cleared by the hepatic or renal system. The central compartment is cleansed of drug by cyclic filtering through either the liver or kidney (or both) until the drug is eliminated (see Fig. 8.1). In practical terms for non-polar drugs, the main organ of clearance is the liver. The efficiency of the liver as a removal organ can be quantified by an extraction ratio (EH) given by:
(8.1)
Thus, if a concentration of 1mg/L enters the liver and 0.3mg/L emerges, this would be an extraction ratio of 1 − (0.3/1)=0.7, i.e., 70% of all drug that enters the liver is metabolized. Clearance is the rate of complete cleansing of a given volume of body water per unit time. Thus, if the liver receives 20mL/min•kg of blood (this is the QH of the liver blood flow for a healthy adult) and a removal process extracts 70% of this, then the hepatic clearance (CLH) is given by QH×EH=20mL/minkg×0.7=14mL/minkg. For a 70kg male this equals 980mL/min. It is useful to denote levels of clearance in general terms as a fraction of liver blood flow. For a healthy male, liver blood flow is 1450mL/min. Thus, a clearance value of 0 to 40% of liver blood flow is considered low (<580mL/min), 40–70% medium (580 to 1015mL/min) and >70% (>1015mL/min) high clearance.
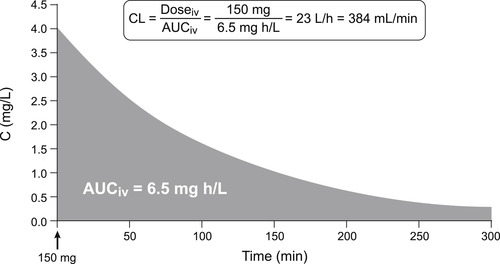
Clearance is extremely important in pharmacokinetics as it determines the dose rate for clinical infusions to achieve therapeutic steady-state concentrations and it determines the dosing schedule for repeat administration in chronic treatment. It is the single most important determinant of whether a drug is a once a day, twice a day, etc., treatment. It can be measured in vivo by comparing the exposure to drug (expressed as the area under the concentration–time curve) and the dosage; it should be noted when in vivo clearance is measured in this way there is no restriction as to mechanism, i.e., it may be a mixture of removal mechanisms including hepatic and renal. Thus, Clearanceinvivo is given by CL=Dosageiv/AUCiv (see Fig 8.2).
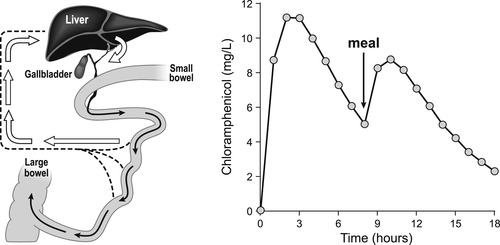
One additional mechanism of drug clearance related to hepatic function is secretion into the enterohepatic circulation. The liver secretes from 0.25 to 1L of bile each day containing anions, cations and low molecular weight (<300) non-ionized molecules. The lower molecular weight compounds are reabsorbed before being excreted into the bile duct, but molecules of high molecular weight (approximately 500 or greater) can be secreted into the bile duct and continue on to be deposited into the gastrointestinal tract. The glucuronide conjugates of small polar structures can attain these sizes and glucuronides are known to take part in enterohepatic excretion. A practical aspect of this for clinical trials (and therapy) is the observation that some drugs that take part in this process (i.e., chloramphenicol; see Box 8.2) can demonstrate large secondary oral absorption curves after a meal as the bile is secreted into the GI tract in response to food.
Box 8.2
The enterohepatic circulation forms a cycle whereby drugs are secreted into the bile duct (through transport processes such as P-gp, MDR2, MDR3, BSEP and MRP2) from the hepatic cells. They are shunted to the gastrointestinal tract when the gall bladder secretes bile (after a stimulus such as a meal) and from there they can be reabsorbed. This is known to occur with chloramphenicol and chloramphenicol-glucuronide. These effects must be considered in clinical trials where fasting conditions can affect absorption.
 |
Renal Excretion
A main pathway for drug excretion from the body is through the kidney; this is the primary method of clearance for polar water-soluble chemicals. The kidney receives about 173 liters of water a day and returns approximately 171 liters back to the body. It filters water at a rate of 110 to 130mLmin−1 through a system of approximately one million nephrons (tubules) that have distinct properties (Fig. 8.3A shows one such tubule). Filtration begins at the glomerulus, an area of vasculature that has uniquely large pores that allow all but protein bound drug (> m.w. 30,000) to pass. The blood passes through the glomerulus at a rate of 1200mLmin−1 and 10% is filtered through as plasma water. The clearance by glomerular filtration is CLGF=fu×GFR where fu refers to the free fraction of drug (non-protein bound) and GFR is the filtration rate (approximated at 120mLmin−1). The filtrate then progresses to the proximal tubule which has secretory pumps capable of actively transporting drugs from the circulation into the tubule. There are two main secretory processes; one for negatively charged molecules (weak acids) and one for positively charged molecules (weak bases). This process is saturable and designated CLS (see Fig. 8.3). Finally, in the loop of Henle, all but 1 or 2mL of the 120mL, filtered at the glomerulus, is reabsorbed. It is here that non-ionized membrane-soluble drugs are also reabsorbed according to a concentration gradient. This process is controlled by urine volume (high volume=low gradient=low reabsorption). Since only non-ionized drug is reabsorbed, pH and pKa may become factors in how much drug is reabsorbed. In cases where urine pH is subject to change (i.e., pH is lowered in conditions of chronic obstructive pulmonary disease, diabetic ketoacidosis, etc.), renal clearance may change for some drugs with disease state.
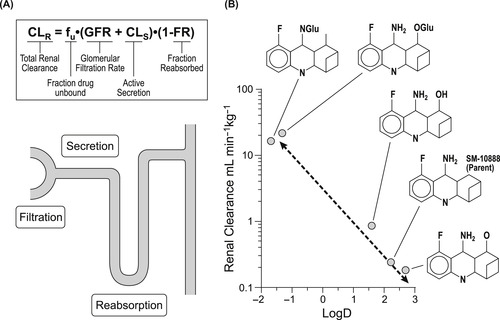 |
| Figure 8.3 (data from [4]) |
Considering all of the processes in the renal tubule, the total renal renal clearance is given by:
(8.2)

Renal clearance can be measured by:
(8.3)
Drug Distribution
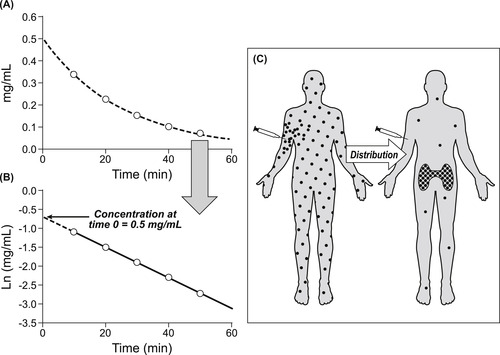
Referring to Fig. 7.4, it can be seen that another major process that a molecule undergoes, when introduced into the body, is redistribution. The body is comprised of numerous compartments, and drugs, owing to their particular physico-chemical properties, may sequester in some of these but not others. Knowledge of where drugs go in the body can be useful to determine the therapeutic potential of drugs; a tool to make these estimates is the volume of distribution (Vd). The volume of distribution of a drug is a virtual quantity of water into which a given drug would appear to be dissolved when the concentration is measured from the central compartment. Because the body is like a container with a hole in it, drug concentration changes with time. Therefore, to gauge the volume of distribution, the concentration at the instant the drug enters the body is required. This can be measured by estimating the clearance of a single intravenous dose of molecule. Figure 8.4A shows the decay in concentration with time of an intravenous dose of 20mg of an experimental drug. This exponential decay curve can be linearized by plotting the natural logarithm of the concentration with time, as shown in Fig. 8.4B, allowing the extrapolation of the decay curve to time zero. This is the theoretical concentration of drug in the central compartment the instant the drug is injected. From this concentration value and knowledge of the amount of drug injected, the apparent volume of distribution of the drug can be calculated. In this case it is 20mg÷0.5mg/mL=40L. This is approximately the amount of water in a 70kg male, suggesting that the drug is evenly distributed in the body water. This procedure can be used to detect drug sequestration. For example, when 300mg of the antimalarial drug chloroquine is given in a single intravenous dose, the concentration at time zero by extrapolation is 40ng/mL (0.04mg/L). [1] This leads to an estimation of Vd of 300mg÷0.04mg/L=7500L, a volume approximately 180 times the volume of water in a human. This inordinately large Vd value indicates that chloroquine distributes to other tissues and is not present in the central compartment (see Fig. 8.4C). When drugs leave the central compartment and concentrate in other tissues (i.e., adipose tissue, muscle), the central compartment concentration will be exceedingly low and this, in turn, leads to an extremely high apparent volume of distribution. Therefore, high values for Vd are indicative of drug sequestration out of the central compartment. The factors that can cause drugs to be sequestered in special areas of the body (away from the central compartment) are entry into separated compartments such as the blood–brain barrier, mammary circulation, placenta, intracellular tissue binding, high lipid solubility and trapping due to pKa/pH combinations. Binding of drugs to plasma proteins actually decreases the volume of distribution since it prevents free drug from diffusing elsewhere into the body.
There is a temporal aspect of the distribution of drugs within the body that leads to multi-compartment pharmacokinetics. The body is made up of many compartments of varying size, accessibility and blood flow, and access to these compartments varies with time. Upon injection, drugs rapidly distribute to highly perfused organs such as the liver, brain, kidney and lungs, over a time-scale of minutes. Over a period of hours thereafter, drugs then equilibrate according to their physico-chemical properties throughout the body viscera (muscle, skin, fat). This leads to clearance curves that are more complex than those describing a single compartment. Figure 8.5 shows clearance from a three compartment system where the first two compartments are rapidly cleared to give a steep initial component to the curve; this profile represents redistribution of the drug within the body. The final phase of the curve represents true clearance where the drug leaves the body.
Stay updated, free articles. Join our Telegram channel

Full access? Get Clinical Tree


