■ The volume of distribution can be determined from the relationship

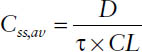
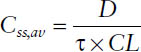
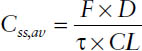
■ The average steady-state concentration Css,av during multiple dosing is determined only by the dose D, the dosing interval τ (or both together as dosing rate DR = D/τ), and the clearance CL:
■ The area under the curve resulting from administration of a single dose AUCsingle is equal to the area under the curve during one dosing interval at steady-state AUCss, provided that the same dose is given per dosing interval τ:
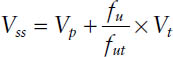
■ The volume of distribution at steady state is by definition the sum of the pharmacokinetic volumes of distribution for the different pharmacokinetic compartments. It is the theoretical
where Vp is the volume of plasma (3 L), Vt is the volume of tissue water (total body water minus plasma volume: 42 − 3 = 39 L based on a “standard” person), and fu and fut are the fraction unbound for the drug in plasma and in plasma and tissue, respectively.
■ Clearance is defined as the irreversible removal of a drug from the body by an organ of elimination. CL by the eliminating organ (CLorgan) is defined as the product of blood flow to the organ (Q) and the extraction ratio of that organ (ER). The fraction of drug escaping first-pass metabolism (F*) can be described in terms of the hepatic ER (F* = 1 − ER).
■ The venous equilibrium model relates hepatic ER to hepatic blood flow Q, unbound drug fraction fup, and intrinsic clearance CLint:
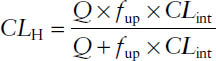
■ The venous equilibrium model can be simplified for drugs with low ER (<0.3) and high ER (>0.7). For low-ER drugs, CLH ≈ fup × CLint. For high-ER drugs, CLH ≈ Q.
■ Bioavailability is the fraction (or percentage) of a dose administered nonintravenously (or extravascularly) that is systemically available as compared to an intravenous dose. The overall oral bioavailability (F) of a drug is dependent on the fraction absorbed (fa), the fraction escaping metabolism in the intestinal wall (fg), and the fraction escaping hepatic first-pass metabolism (F*).
■ Drugs may undergo three processes in the kidney. Two act to remove a drug from the body: filtration and secretion. The other acts to return a drug to the body: reabsorption. The net process a drug undergoes can be determined by calculating the excretion ratio (Eratio) using total renal clearance (CLR) and filtration clearance (CLF):
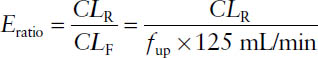
where the CLF is the product of glomerular filtration rate (125 mL/min for a “standard” person) and the fraction of a drug that is not bound to plasma proteins (unbound fraction fup).
7-2. Study Guide Checklist
The following topics may guide your study of this subject area:
■ Principles of first-order elimination kinetics
■ Factors that affect a drug’s bioavailability after extravascular administration
■ Considerations for drug selection when trying to minimize the potential for drug–drug or drug–disease interactions
■ Differences between high-extraction and low-extraction drugs when interpreting clinical significance of changes in protein binding and intrinsic clearance
7-3. Introduction
Pharmacokinetics is the science of a drug’s fate in the body. A drug’s therapeutic potential is intimately linked to its pharmacokinetic profile. For example, a drug’s pharmacologic response may be severely diminished by poor absorption, rapid elimination from the body, or both. The most important factors contributing to drug disposition include absorption, distribution, metabolism, and excretion.
Absorption
The rate and extent of drug absorption is referred to as bioavailability. The fraction of drug absorbed (fa), an important determinant of the extent of bioavail-ability (represented by F), is affected not only by the drug’s physicochemical properties but also by physiologic barriers at the site of absorption. For example, intestinal expression of the drug efflux transporter P-glycoprotein is known to limit oral drugs.
Distribution
Many drugs circulate in the body bound to plasma proteins (e.g., human serum albumin). The fraction of drug not bound to plasma protein (fup) is responsible for the pharmacologic effect. A drug may also bind significantly to tissue proteins (fut). Drugs with a large fup-to-fut ratio have a large volume of distribution, whereas drugs with a small fup-to-fut ratio are largely confined to the vascular space. Volume of distribution is directly related to half-life (t1/2), the time required to eliminate half the drug from the body.
Metabolism
Approximately 50% of drugs undergo some form of hepatic metabolism. The cytochrome P450 (CYP450) family of drug-metabolizing enzymes is primarily responsible for drug inactivation in the liver. For a specific drug, however, other hepatic or nonhepatic enzymes may play a major role in their metabolism as well. Hepatic clearance depends on liver blood flow and the extraction ratio (ER). Hepatic ER can be used to estimate the fraction of drug escaping first-pass metabolism (F*), which is an important determinant of oral bioavailability. Intestinal inactivation of drugs by CYP450 enzymes in the gut is responsible for reduced F of a number of drugs.
Excretion
The primary purpose of hepatic metabolism is to increase a drug’s water solubility to facilitate its excretion through renal as well as nonrenal pathways. The kidneys also serve as the primary eliminating organ for drugs that do not undergo hepatic metabolism. Renal clearance comprises three main physiologic processes: glomerular filtration, reabsorption, and secretion. Filtration clearance is the product of fup and glomerular filtration rate (a physiologic parameter that diminishes with age). Renal reabsorption is a predominantly passive process dependent on physicochemical drug properties and on urine drug concentration and pH, whereas secretion is an active process facilitated by various transport mechanisms. The net of filtration, reabsorption, and secretion determines a drug’s total renal clearance.
Interindividual differences in drug pharmacokinetics can at least partially explain variability in drug response. Thus, a thorough understanding of the physiologic processes affecting drug disposition is essential to drug individualization and optimization.
7-4. Absorption and Disposition
Drug Input
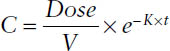
Drugs are administered to the body by one of two routes, intravascular or extravascular. For intravascular administration, drugs are usually administered in intravenous (IV) infusion (continuous, short term, or bolus). The concentration (C) is given by the following expressions.
IV bolus
IV infusion
For drugs that are administered extravascularly (by mouth, intramuscularly, or subcutaneously) and act systemically, absorption must occur. See section 7-6.
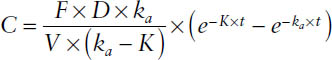
First-order absorption
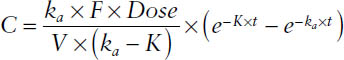
where ka = first-order rate constant for drug absorption; absorption half-life = 0.693/ka; K = first-order rate constant for drug elimination (CL/V); CL = F × Dose/AUC, oral clearance = CL/F = Dose/AUC; and F = bioavailability, or fraction of drug absorbed. F refers to the rate and extent of absorption.
7-5. Constant Rate Regimens
For many drugs to be therapeutically effective, drug concentrations of a certain level have to be maintained at the site of action for a prolonged period (e.g., β-lactam antibiotics, antiarrhythmics), whereas for others, alternating plasma concentrations are more preferable (e.g., aminoglycoside antibiotics such as gentamicin).
Two basic approaches to administering the drug can be applied to continuously maintain drug concentrations in a certain therapeutic range over a prolonged period:
■ Drug administration at a constant input rate
■ Sequential administration of discrete single doses (multiple dosing)
Drug Administration as Constant Rate Regimens
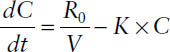
At any time during the infusion, the rate of change in drug concentration is the difference between the input rate (infusion rate R0/volume of distribution V) and the output rate (elimination rate constant K × concentration C):
Rate of change = input rate − output rate
In concentrations:
In amounts:
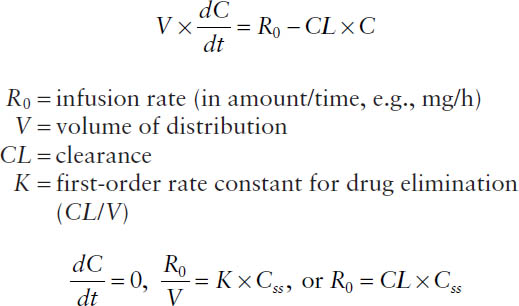
Hence, the steady-state concentration Css is determined only by the infusion rate R0 and the clearance CL.
Drug concentration at steady state:

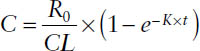
Drug concentration before steady state:
Time to Reach Steady State
For therapeutic purposes, knowing how long after initiation of an infusion reaching the targeted steady-state concentration Css will take is often critical.
Concentration during an infusion before steady state:
Concentration during an infusion at steady state:

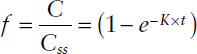
The fraction of steady-state f is then
After a duration of infusion of
1.0 t1/2 → 50% of steady state is reached
2.0 t1/2 → 75% of steady state is reached
3.0 t1/2 → 87.5% of steady state is reached
3.3 t1/2 → 90% of steady state is reached
4.0 t1/2 → 93.8% of steady state is reached
5.0 t1/2 → 96.9% of steady state is reached
The following conclusions can be drawn:
■ The approach to the steady-state concentration Css is exponential in nature and is controlled by the elimination process (elimination rate constant K), not the infusion rate R0.
■ Only the value of the steady-state concentration Css is controlled by the infusion rate R0 (and of course by the clearance CL).
■ If one assumes for clinical purposes that a concentration of > 95% of steady state is therapeutically equivalent to the final steady-state concentration Css, approximately five elimination half-lives t1/2 are necessary to reach steady state after initiation of an infusion.
Concentration-Time Profiles Postinfusion
The plasma concentration postinfusion cannot be distinguished from giving an IV bolus dose. Because the drug input has been discontinued, the rate of change in drug concentration is determined only by the output rate. If the drug follows one-compartment characteristics, then the plasma concentration profile can be described by
C = C′ × e−K×tpi
where C′ is concentration at the end of the infusion and tpi is time postinfusion (i.e., time after the infusion has stopped).
Thus, a general expression can be used to calculate the plasma concentration during and after a constant rate infusion:
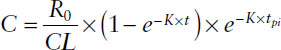
where t is the elapsed time after the beginning of the infusion and tpi is the postinfusion time—that is, the difference between the duration of the infusion (infusion time Tinf) and t: tpi = t − Tinf. For describing concentrations during the infusion, tpi is set to zero. For describing concentrations postinfusion, t is set to Tinf.
Four different cases can be distinguished:
1. During the infusion, but before steady state is reached:
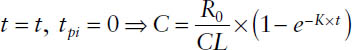
2. During the infusion at steady state:
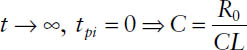
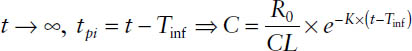
3. After cessation of the infusion before steady state:
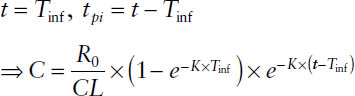
4. After cessation of the infusion at steady state:
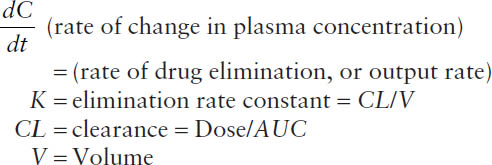
Determination of Pharmacokinetic Parameters
The elimination rate constant K and the elimination half-life t1/2 can be determined from
■ The terminal slope after the infusion has been stopped
■ The time to reach half of Css
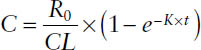
■ The slope of the relationship of ln(Css − C) versus t, based on
C = Css × (1 − e−K×t)
and the resulting ln(Css − C) = ln Css − K × t
The clearance CL from the relationship can be determined from

The volume of distribution from the relationship can be determined from

Loading Dose and Maintenance Dose
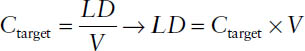
The loading dose LD is supposed to immediately (t = 0) reach the desired target concentration Ctarget. It is administered as an IV bolus injection or, more frequently, as a short-term infusion. Following is an expression of target concentration calculated for a drug with one-compartment characteristics:
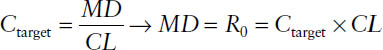
The maintenance dose MD is intended to sustain Ctarget. It is administered as a constant rate infusion. The maintenance dose is the infusion rate necessary to sustain the target concentration:
7-6. Multiple Dosing
Continuous drug concentrations for a prolonged therapy can be maintained either by administering the drug at a constant input rate or by sequentially administering discrete single doses of the drug. The latter is the approach more frequently used and can be applied for extravascular as well as intravascular routes of administration.
Multiple-dose regimens are defined by two components, the dose D that is administered at each dosing occasion, and the dosing interval τ, which is the time between the administrations of two subsequent doses. Dose and dosing interval can be summarized in the dosing rate DR:

Concentration-Time Profiles during Multiple Dosing
The multiple-dose function MDF can be used for calculating drug concentrations before steady state has been reached during a multiple-dose regimen:
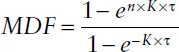
where K is the respective rate constant of the drug, τ is the dosing interval, and n is the number of the dose.
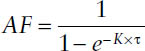
Once steady state has been reached, n approaches infinity, and MDF simplifies to the accumulation factor AF:
Multiple-Dosing Regimens: Instantaneous Input (IV Bolus)
For an IV bolus multiple-dose regimen, the concentrations during the first dosing interval, the nth dosing interval, and at steady state are described by the relationships shown in Table 7-1.
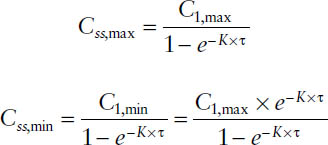
The peak and trough concentrations at steady state can thus be expressed as the peak and trough after the first dose multiplied by the accumulation factor AF:
Average steady-state concentration
By definition, the average drug input rate is equal to the average drug output rate at steady state. Whereas the average input rate is the drug amount entering the systemic circulation per dosing interval, the average output rate is equal to the product of clearance CL and the average plasma concentration within one dosing interval Css,av:
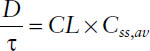
Table 7-1. IV Bolus Multiple-Dose Regimen
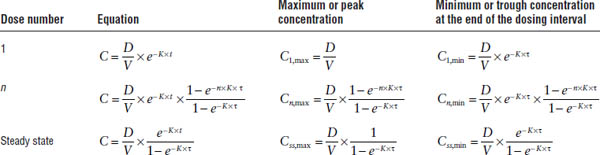
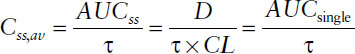
Thus, the average steady-state concentration Css,av during multiple dosing is determined only by the dose D, the dosing interval τ (or both together as dosing rate DR = D/τ), and the clearance CL:
The area under the curve resulting from administration of a single dose AUCsingle is equal to the area under the curve during one dosing interval at steady state AUCss if the same dose is given per dosing interval τ:
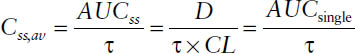
Thus,
AUCsingle = AUCss
Extent of accumulation
The extent of accumulation during multiple dosing at steady state is determined by the dosing interval τ and the half-life of the drug t1/2 (or the elimination rate constant K):
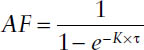
Thus, the extent of accumulation is dependent not only on the pharmacokinetic properties of a drug but also on the multiple-dosing regimen chosen.
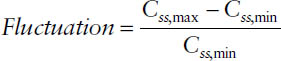
Fluctuation
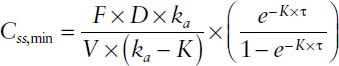
The degree of fluctuation between peak and trough concentrations during one dosing interval—that is, Css,max and Css,min—is determined by the relationship between elimination half-life t1/2 and dosing interval τ:
Multiple-Dosing Regimens: First-Order Input (Oral Dosing)
The average steady-state concentration Css,av is now determined by the bioavailable fraction F of the dose D administered per dosing interval τ and the clearance CL:
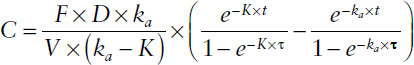
The concentration-time profile after a single oral dose is given by
Hence, the concentration at any time within a dosing interval during multiple dosing at steady state is determined by
Thus, the trough concentration is readily available, if one assumes that the absorption is completed:
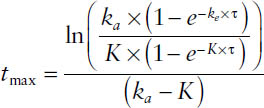
The peak concentration is assessable via the time-to-peak tmax, which is dependent on the rate of absorption and has to be determined through
7-7. Volumes of Distribution and Protein Binding
Drug distribution means the reversible transfer of drug from one location to another within the body. After the drug has entered the vascular system, it becomes distributed throughout the various tissues and body fluids. However, most drugs do not distribute uniformly and in a similar manner throughout the body, as reflected by the difference in their volumes of distribution. Thus, the following material focuses on the factors and processes determining the rate and extent of distribution and the resulting consequences for pharmacotherapy.
Following are factors affecting distribution:
■ Binding to blood or tissue elements
■ Blood flow (i.e., the delivery of drug to the tissues)
■ Ability to cross biomembranes
■ Physicochemical properties of the drug (lipophilicity, extent of ionization) that determine partitioning into tissues
Protein Binding
The fraction unbound in plasma varies widely among drugs. Drugs are classified as follows:
■ Highly protein bound:
fu ≤ 0.1(≤ 10% unbound, ≥ 90% bound)
■ Moderately protein bound:
fu = 0.1–0.4(10–40% unbound, 60–90% bound)
■ Low protein bound:
fu ≥ 0.4(≥ 40% unbound, ≤ 60% bound)
Factors Determining the Degree of Protein Binding
The reversible binding of a drug to proteins obeys the law of mass action,

where the expressions in brackets represent the molar concentrations of the components, and k1 and k2 are rate constants for the forward and reverse reactions, respectively. The equilibrium association constant Ka is defined as k1/k2.
This reaction results in the following relationship for the fraction unbound:
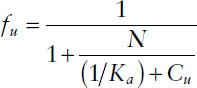
where N is the number of available binding sites and Cu is the unbound concentration.
Binding Proteins
Human plasma contains more than 60 proteins. Of these, three proteins account for the binding of most drugs. Albumin, which comprises approximately 60% of total plasma protein, fully accounts for the plasma binding of most anionic drugs and many endogenous anions (high-capacity, low-affinity binding site). Many cationic and neutral drugs bind appreciably to α1-acid glycoprotein (high-affinity, low-capacity binding site) or lipoproteins in addition to albumin. Other proteins, such as transcortin, thyroid-binding globulin, and certain antibodies have specific affinities for a small number of drugs.
Volumes of Distribution
Volume of distribution at steady-state Vss
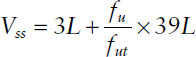
The volume of distribution at steady state is by definition the sum of the pharmacokinetic volumes of distribution for the different pharmacokinetic compartments. It is the theoretical
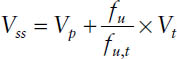
where Vp is the volume of plasma (3 L); Vt is the volume of tissue water (total body water minus plasma volume: 42 − 3 = 39 L based on a “standard” person); and fu and fut are the fraction unbound for the drug in plasma and in tissue, respectively.
Besides physicochemical properties of the drug, the relationship for Vss shows that the extent of distribution is largely determined by the differences in protein binding in plasma and tissue, respectively:
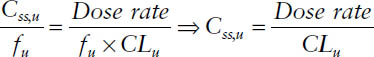
Unbound steady-state concentrations
The average steady-state concentration during a multiple-dose regimen or during a constant rate infusion is determined by
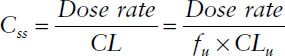
The free steady-state concentration Css,u is given by
Css,u = fu × Css
Thus, the unbound steady-state concentration Css,u is determined by
7-8. Bioavailability and Bioequivalence
The Food and Drug Administration (FDA) (21 Code of Federal Regulations 320) defines bioavailability as “the rate and extent to which the active ingredient or active moiety is absorbed from a drug product and becomes available at the site of action.” Because, in practice, drug concentrations can rarely be determined at the site of action (e.g., at a receptor site), bioavailability is more commonly defined as “the rate and extent that the active drug is absorbed from a dosage form and becomes available in the systemic circulation.”
Following are factors affecting bioavailability:
■ Drug product formulation
■ Properties of the drug (salt form, crystalline structure, formation of solvates, and solubility)
■ Composition of the finished dosage form (presence or absence of excipients and special coatings)
■ Manufacturing variables (tablet compression force, processing variables, particle size of drug or excipients, and environmental conditions)
■ Rate and site of dissolution in the gastrointestinal tract
■ Physiology
With respect to physiology, the following factors affect bioavailability:
■ Contents of the gastrointestinal tract (fluid volume and pH, diet, presence or absence of food, bacterial activity, and presence of other drugs)
■ Rate of gastrointestinal tract transit (influenced by disease, physical activity, drugs, emotional status of subject, and composition of the gastrointestinal tract contents)
■ Presystemic drug metabolism or degradation (influenced by local blood flow; condition of the gastrointestinal tract membranes; and drug transport, metabolism, or degradation in the gastrointestinal tract or during the first pass of the drug through the liver)
Absolute Bioavailability
Absolute bioavailability is the fraction (or percentage) of a dose administered nonintravenously (or extravascularly) that is systemically available as compared to an intravenous dose. If given orally, absolute bio-availability (F) is
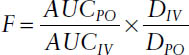
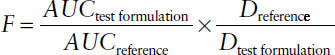
Relative Bioavailability
Relative bioavailability refers to a comparison of two or more dosage forms in terms of their relative rate and extent of absorption:
Bioequivalence
Two dosage forms that do not differ significantly in their rate and extent of absorption are termed bioequivalent. In general, bioequivalence evaluations involve comparisons of dosage forms that are
■ Pharmaceutical equivalents: Drug products that contain identical amounts of the identical active drug ingredient (i.e., the same salt or ester of the same therapeutic moiety, in identical dosage forms)
■ Pharmaceutical alternatives: Drug products that contain the identical therapeutic moiety, or its precursor, but not necessarily in the same amount or dosage form or as the same salt or ester
Biopharmaceutics Classification System
With minor exceptions, the FDA requires that bio-availability and bioequivalence of a drug product be demonstrated through in vivo studies. However, the Biopharmaceutics Classification System (BCS) can be used to justify the waiver of the requirement for in vivo studies for rapidly dissolving drug products containing active moieties or active ingredients that are highly soluble and highly permeable (Class 1 drugs).
The BCS divides drugs into classes on the basis of their solubility and permeability:
■ Class 1: high solubility and high permeability
■ Class 2: low solubility and high permeability
■ Class 3: high solubility and low permeability
■ Class 4: low solubility and low permeability
7-9. Elimination and Clearance Concepts
Clearance is defined as the irreversible removal of a drug from the body by an organ of elimination. Because the units of CL are flow (e.g., mL/minute or L/h), CL is often defined as the volume of blood irreversibly cleared of a drug per unit of time.
CL by the eliminating organ (CLorgan) is defined as the product of blood flow (Q) to the organ and the ER of that organ:
CLorgan = Q × ER
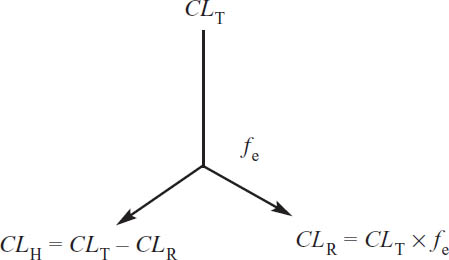
Individual organ clearances are additive. For the majority of drugs used clinically, the liver is the major—and sometimes only—site of metabolism; the kidneys are the major site of excretion for drugs and metabolites. Thus, the equation for total clearance can be written to include renal clearance (CLR) and hepatic clearance (CLH):
CL = CLR + CLH
The fraction of drug excreted unchanged by the kidneys (fe) indicates what fraction of the drug administered will be excreted into the urine:
7-10. Renal Clearance
Drugs may undergo three processes in the kidney. Two act to remove a drug from the body: filtration and secretion. The other acts to return a drug to the body: reabsorption. Thus, one may express renal clearance of a drug as follows:
CLR = [CLfiltration + CLsecretion]×(1 − freabsorbed)
Calculating Filtration Clearance of Creatinine
Normal serum concentrations of creatinine are 0.8–1.3 mg/dL for men and 0.6–1 mg/dL for women.
Creatinine is a useful marker of renal function because it is an endogenous by-product of muscle breakdown. The kidney eliminates creatinine at a rate approximately equal to the glomerular filtration rate (GFR). A number of formulas have been developed that allow creatinine clearance (CLcr) to be estimated from serum creatinine concentrations. The most widely used clinically is the Cockroft–Gault equation:
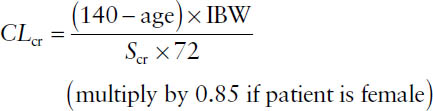
where Scr is the serum creatinine concentration in mg/dL, and IBW is the ideal body weight.
IBWmales(kg) = 50 + (2.3 × height in inches > 5 ft)
IBWfemales(kg) = 45.5 + (2.3 × height in inches > 5 ft)
Secretion Clearance
A drug in blood may also be secreted into the kidney tubule. This process occurs against a concentration gradient (concentration of a drug in the kidney tubule is very high because of water reabsorption) and therefore is an active process.
Cellular processes (e.g., presence of active transporters) exist to facilitate tubular secretion. The two most well characterized of these processes include transporters responsible for the secretion of basic (anionic) and acidic (anionic) drugs.
Reabsorption
Passive reabsorption of many drugs also occurs in the kidneys. Because reabsorption is a passive process (i.e., diffusion), reabsorption will depend on the physicochemical properties of the drug (e.g., molecular weight, polarity, and acid disassociation content pKa).
Weak bases: B + H+ ⇔ BH+
Low urine pH = more ionized, less reabsorption
High urine pH = less ionized, more reabsorption
Stay updated, free articles. Join our Telegram channel

Full access? Get Clinical Tree


