(1)
Swammerdam Institute for Life Sciences, van Leeuwenhoek Centre for Advanced Microscopy, Section of Molecular Cytology, University of Amsterdam, Amsterdam, The Netherlands
Abstract
Nowadays, fluorescent protein (FP) variants have been engineered to fluoresce in all different colors; to display photoswitchable, or photochromic, behavior; or to show yet other beneficial properties that enable or enhance a still growing set of new fluorescence spectroscopy and microcopy techniques. This has allowed the (in situ) study of biomolecules with unprecedented resolution, specificity, sensitivity, and ease of labeling. However, brighter FPs, more photostable FPs, and FPs that display an even better compatibility with biophysical microspectroscopic techniques are still highly desired. The key characteristics of FPs—absorption spectrum, emission spectrum, brightness, fluorescence lifetime, maturation rate, oligomeric state, photostability, pH sensitivity, and functionality in protein fusions—determine their application. This chapter will describe these key features and present several experimental protocols to optimize them.
The optimization procedure contains three steps. First the amino acid sequence of a template FP is changed via random or site-directed mutagenesis. A primary screening based on fluorescence intensity, fluorescence lifetime, and emission spectrum is applied on the FP libraries expressed in bacteria. The most promising mutants are isolated, purified, and characterized in vitro. In this step all key characteristics are determined experimentally. Finally the new FPs are evaluated for use in vivo. The protein production and maturation is monitored in bacteria, while transfected mammalian cells report on the photostability, relative brightness, and correct localization to various subcellular compartments.
Key words
Green fluorescent proteinFluorescence lifetime imaging microscopyExtinction coefficientQuantum yieldFluorescence fluctuation spectroscopySite-directed mutagenesisBrightnessmTurquoise21 Introduction
Fluorescent proteins (FPs) have become indispensable for visualizing structures and processes in molecular cell biological research [1]. FPs can be used for many purposes, for example, structural studies (i.e., cell organelle and protein labeling), but also for functional studies (i.e., biosensors and drug screening). Because an FP is genetically encoded, protein molecules or cellular structures of interest can be FP labeled within living cells. This minimizes perturbation of living systems. FPs have greatly accelerated developments in fluorescence spectroscopy and microscopy. Nowadays, FPs are available in multiple colors and have different photochromic behavior and optimized fluorescence properties. In conjunction, a growing set fluorescence spectroscopy and imaging techniques have emerged. This combination has enabled the study of biomolecules with unprecedented resolution, sophistication, sensitivity, and ease of labeling.
An FP consists of 220–240 amino acid residues. The residues are arranged in 11 β-sheets that form the β-barrel (Fig. 1a). A distorted helix on which the chromophore is situated is located in the center of the barrel (Fig. 1b), and thereby, the β-barrel provides a protected environment for the chromophore. The chromophore is formed after a series of autocatalytic reactions from amino residues 65–67 (numbering in accordance of the Aequorea victoria green fluorescent protein (avGFP)). These reactions are displayed in Fig. 2. Although the exact sequence of reactions and rearrangements are still under debate [2], it is evident that molecular oxygen is the only required external factor.
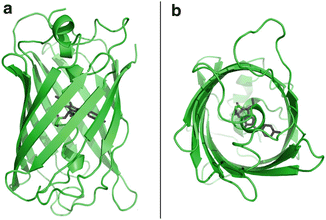
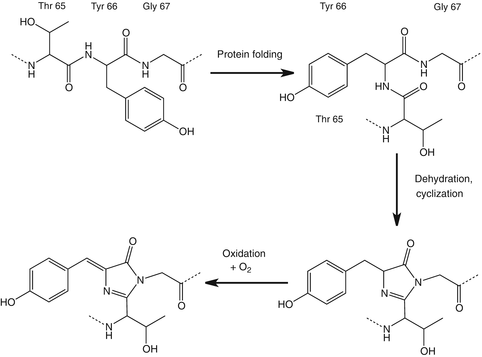
Fig. 1
Side view of crystal structure of avGFP (a) and bottom view (b) (pdb entry 1ema). The 11 β-sheets form a protective environment for the chromophore, which is located on a distorted helix in the center of the barrel
Fig. 2
avGFP chromophore formation. First a rearrangement takes place to facilitate the cyclization. Second, dehydration takes place, resulting in cyclization. In the last step one oxidation reaction occurs with molecular oxygen, resulting in a completely conjugated chromophore
Most engineered FPs that are used nowadays have been derived from intensely mutating avGFP or DsRed (a red FP from the Discosoma species). Substitution of amino acid residues located in the chromophore and/or its direct proximity can lead to altered excitation and emission spectra. Also, mutations near the chromophore have resulted in increased brightness and faster maturation speed. Amino acid substitutions in the barrel, especially on the outside, have caused a lowered tendency of FPs to dimerize or oligomerize. These characteristics will be discussed in more detail in the next section.
For example, the Tyr66Trp mutation of avGFP resulted in cyan fluorescent protein (CFP) [3]. The chromophore structures of avGFP and CFP are presented in Fig. 3. The structural difference caused a blue shift in the absorption and emission spectrum of avGFP. The bulkier chromophore has caused spatial shifts within the β-barrel, resulting in a reduced brightness. Further engineering resulted in enhanced cyan fluorescent protein (ECFP) [4], mCerulean [5], SCFP3A [6], mTurquoise [7], and recently mTurquoise2 [8]. The brightness and photostability are substantially increased from CFP to mTurquoise2.
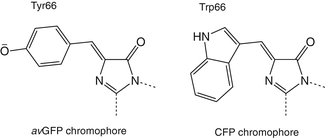
Fig. 3
Structure of the avGFP chromophore (left) and CFP chromophore (right), only amino acid residue 66 in the chromophore differs
1.1 Fluorescent Protein Characteristics
The key characteristics of FPs include absorption spectrum, emission spectrum, brightness, fluorescence lifetime, maturation rate, oligomeric state, photostability, pH sensitivity, and functionality in protein fusions. By mutating the DNA sequence, key FP characteristics can be optimized. However, optimizing one characteristic may lead to a downgrade of another one. During optimization all characteristics need to be monitored.
1.1.1 Brightness and Fluorescence Lifetime
The brightness is dependent on the molar extinction coefficient and the quantum yield. The molar extinction coefficient is a measurement for the efficiency of the chromophore to absorb photons and can be calculated using the law of Lambert–Beer. The molecular extinction coefficient is usually constant within an FP spectral class, due to the given physical size of the chromophore. Still largely varying extinction coefficients have been published even for the same FP by different laboratories. While measuring the absorbance of purified FPs in solution at the absorbance maximum is straightforward, the determination of the actual protein concentration easily introduces errors up to 10 %. Also the extent of fully matured protein within a purified sample or presence of impurities can seriously interfere with the extinction coefficient assay. In some cases indirect measurements of denatured protein and comparison to FP standards are used [9] in order to circumvent low extinction coefficient estimation, due to poor maturation. Another factor that can interfere when determining the extinction coefficient is the pH sensitivity of the chromophore. Especially in GFP and yellow fluorescent protein (YFP) spectral classes, protonation of the chromophore causes a dramatic (blue) shift in the absorbance spectrum at the cost of the absorbance of the deprotonated species [10, 11]. Hence, for these spectral classes absorbance measurements at relatively high pH (8.0) are advised. In this chapter we restrict ourselves to determine the extinction coefficient by measuring the absorbance of the chromophore and determine the protein concentration (Subheading 3.2.2). In addition, the relative intrinsic molecular brightness of an FP can be estimated with single-molecule fluctuation microscopy techniques (Subheading 3.2.5). The advantage of this method is that only fully maturated FPs contribute to the signal and nonfluorescent (non-folded) FPs do not contribute to the signal.
The fluorescence quantum yield is the ratio of the number of emitted photons over the number of absorbed photons. Hence, the quantum yield is minimally 0 and its theoretical upper limit is 1 (or 100 %). Ideally, a bright FP has a large extinction coefficient and a high quantum yield. These desired characteristics give the advantage that enough fluorescence is produced by the FP even under conditions of low levels of excitation light. Within cells, this reduces phototoxicity and undesired photobleaching of the FP (see Subheading 1.1.4). Furthermore, bright FPs characterized by high signal-to-noise ratios allow working at low, physiologically relevant concentrations of FP-labeled proteins in the cell.
In contrast to the extinction coefficient of a fully maturated protein, the fluorescence quantum yield can vary a lot within one spectral class of FPs. Usually decreased fluorescence quantum yields are paralleled by reduced excited state duration, hence shortened fluorescence lifetimes. This can be understood by realizing that the fluorescence quantum yield is the quotient of the rate of radiative decay over the rate of total decay, whereas the fluorescence lifetime is the inverse of the total decay rate. In addition, usually the radiative decay rate is constant for a fluorophore. Accordingly, decreased quantum yields or fluorescence lifetimes result from additional or enhanced non-radiative decay from the excited state. While proper determination of the quantum yield of a fluorophore generally requires purified protein, fluorescence lifetimes can be accurately measured even within living cells by fluorescence lifetime imaging microscopy (FLIM). Therefore, FLIM (Subheading 3.1.2) is an excellent technique for screening FP libraries for FPs with increased quantum yields [7]. Such screens will select FP variants with increased fluorescent lifetimes and quantum yields. Consequently, the selected FPs will show reduced non-radiative decay, which are believed to be related to minimized fluctuations of side chains or chromophore movements within the β-barrel. The presence of other chromophores within a close proximity of an FP can reduce its lifetime, resulting from Förster resonance energy transfer (FRET). A mono-exponential fluorescence lifetime decay can be greatly beneficial for the analysis of time-resolved lifetime measurements, for example, in FRET microscopy.
1.1.2 Maturation Rate
After synthesis at the ribosome, the folding of the protein structure and the formation of the chromophore by autocatalytic reactions determine the so-called maturation speed of the FP. When an FP is used as reporter gene, the maturation rate should be faster than the gene-induction process itself. In addition, maturation should occur at the incubation temperature of the cells or organism used. As shown in Fig. 2, the formation of the GFP chromophore only requires one oxidation step. The chromophore of a red fluorescent protein (RFP) requires an additional oxidation step, and therefore, the maturation rate of a RFP will be lower. Still, the two-step oxidation process for RFPs can be exploited for gene-induction studies: so-called timer variants were developed [12, 13] that showed a relatively fast first oxidation step leading to a green fluorescent intermediate and a slower second oxidation step yielding the final RFP. Here, the degree of red-to-green coloration seen in cells can be used to time the onset of gene expression.
1.1.3 Oligomeric State
Naturally occurring FPs have a tendency to dimerize or tetramerize (the latter especially occurs in the coral-derived FPs). For many applications, it is of great importance that FPs do not form oligomers. For instance, if the fusion protein to which the FP is attached can also oligomerize, FP oligomerization can lead to clusters and even larger protein aggregates. For FRET experiments where FPs are used to probe molecular proximity, FP oligomerization can be detrimental. Instead of observing interactions/proximity of the targeted objects, interactions between FPs themselves can cause “false-positive” FRET signals. Therefore, FPs ideally must be inert to each other and monomeric. This can be accomplished by altering certain amino acid residues located on the outside of the barrel. Note, when FPs are expressed at high (local) levels, e.g., when fused to membrane proteins, the possibility of very close proximity of even monomeric FPs remains. This causes (acceptor) concentration-dependent FRET also called “bystander FRET.” For other situations, oligomerization can even be desired, as for certain FRET-based biosensors.
1.1.4 Photostability
For quantitative measurements it is important that the fluorescence intensity of the sample is not declining over time due to photobleaching or photochromic changes [14, 15]. The photostability will vary under different illumination conditions, i.e., the selected light source (scanning laser, wide-field lamp illumination, spinning disk, or total internal reflection excitation), intensity, wavelength, and the frequency of pulsed light sources. The boundary conditions for setting the threshold for minimal desired FP photostability are dictated by the fluorescence microscopy technique of choice, the imaging time that is applied, and the desired signal-to-noise ratio. Preferably, newly developed FPs are photostable under all conditions.
1.1.5 pH Sensitivity
The pH within the cytoplasm and within cell organelles usually differs, and during a studied process pH fluctuations can occur. Therefore, it is important that FPs are stable under a wide pH range. For many FPs in the cyan and red spectral class, the pH sensitivity is rather low, in contrast to FPs in the green and yellow spectral classes. Especially for quantitative experiments, the difference in fluorescence intensity should not be a consequence of merely a pH shift. However, some highly pH-sensitive FPs are being exploited as intracellular pH sensors [16].
1.1.6 Functionality in Protein Fusions
As mentioned before, FPs are used for a wide variety of applications, and researchers want to express FPs in all sorts of cells and cellular compartments, either alone or as fusion protein. The justification for an FP that is properly produced in one compartment but not in another compartment is not always evident. However, FPs that are correctly produced in all compartments have great advantages for scientists. Also, FPs with low phototoxicity, which perform well in fusion proteins (like membrane or cytoskeletal fusion proteins) and which are insensitive to aggregation, are highly desired.
1.2 Design and Mutagenesis
Genetic engineering of FPs is usually performed by a combination of site-directed and random mutagenesis. Random mutagenesis has been very successful for optimization of FPs and usually identifies mutations that improve folding/maturation. Because multiple mutations can be introduced simultaneously, it is often uncertain what the contribution is of each of the individual mutations. However, it should be noted that with random mutagenesis the position at which a mutation will be introduced may be randomly selected, but mostly one base pair within one codon will be changed at a time. This severely limits or even prevents variations in the corresponding amino acids in view of the degenerate genetic code. Hence, random mutagenesis is very biased towards the chosen template. Site-directed mutations on the other hand allow encoding of all possible amino acids but only at a preselected position. The positional selection is usually based on structural information and targets specific areas within the protein, e.g., residues in proximity of the chromophore. Methods to introduce targeted mutations at multiple positions have been developed [17, 18]. Site-directed mutagenesis can also be used to introduce step-by-step mutations that have been previously identified by random mutagenesis. Site-directed mutagenesis can either be performed with a predefined mutation codon encoding a specific set of amino acids or with a degenerate codon. The degenerate codon encodes all 20 amino acid residues and will be inserted at a given position in the DNA sequence. Besides random and site-direct mutagenesis, DNA shuffling [19] and in vivo evolution approaches have been described. It is expected that, due to decreasing costs of gene synthesis, the use of synthetic gene libraries will become increasingly popular.
1.3 General Approach for Optimizing FPs
The general approach to optimize FPs is to start with a rational design on the chromophore structure and spatial structure of the FP. A schematic overview is shown in Fig. 4. The corresponding DNA modifications can be obtained either by site-directed mutagenesis or by random mutagenesis to a carefully chosen template. This results in a library of mutated FP DNA sequences, which can be expressed in bacteria. An example of a site-directed mutagenesis protocol is worked out below in Subheading 3.1.1. The advantage of using bacteria is that one bacterium will contain one mutated FP variant. After growing the bacteria on agar plates, a primary screen can be performed on bacterial colonies. In this round bacterial colonies producing improved FPs are selected and DNA can be isolated for sequence confirmation. The primary screening (Subheading 3.1) entails a screening based on fluorescence lifetime (Subheading 3.1.2) and on the emission spectrum (Subheading 3.1.3). By screening on basis of fluorescence lifetime and thereby indirect on intrinsic brightness, factors such as expression level, colony size, and maturation rate do not interfere with the screening results.
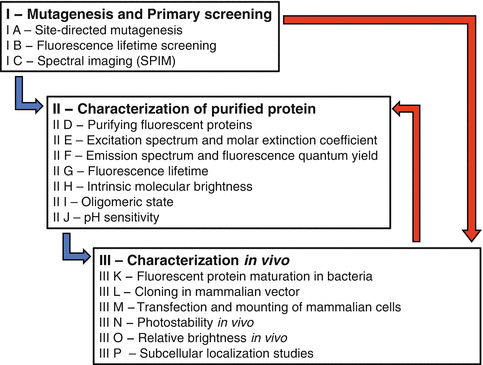
Fig. 4
General approach for optimizing FPs
In Subheading 3.2 spectroscopic characteristics will be measured that are most accurately determined from purified FPs, which are easily produced and isolated from bacteria (Subheading 3.2.1). In this round absorption spectrum and molar extinction coefficient are measured (Subheading 3.2.2), as well as the corrected emission spectrum and quantum yield (Subheading 3.2.3). We also provide protocols for quantifying the fluorescence lifetime (Subheading 3.2.4), relative intrinsic molecular brightness (Subheading 3.2.5), oligomeric state (Subheading 3.2.6), and pH sensitivity (Subheading 3.2.7).
Subheading 3.3 includes characterization in different expression systems. The maturation rate of the FP variants in bacteria is evaluated (Subheading 3.3.1). In addition, the photostability using different image techniques is determined in mammalian cells (Subheading 3.3.4). Furthermore, the relative brightness is determined in mammalian cells (Subheading 3.3.5). And finally, the functionality in protein fusions is assessed in different cell types and cellular compartments (Subheading 3.3.6).
The experiments in Subheadings 3.2 and 3.3 can be performed consecutively (blue arrows in Fig. 4), in opposite order (red arrows in Fig. 4), or simultaneously. There is no absolute order for the screening experiments. If the rational design of the new FP was targeted to one of the key characteristics, this screening could be performed as one of the first screenings. It is not required to complete all assays from Fig. 4 for every intermediate FP. As soon as the new characteristics of the newly synthesized FP are found as non-desired, one can return to design a new FP. However, by performing all experiments mentioned above, one might acquire more valuable information for the new design. In this chapter we describe the spectroscopic aspects of the screening methods. All methods are worked out for the optimization of CFP variants with which we have considerable experience. For characterization of FPs of other spectral classes and/or origin, the chosen FP libraries, the excitation and detection specifications, and fluorescence references given in these methods should be adapted accordingly.
2 Materials
2.1 Mutagenesis and Primary Screening
2.1.1 Site-Directed Mutagenesis
1.
Bacterial expression vector containing a leaky bacterial expression promotor and an FP template for mutagenesis (see Note 1).
2.
The selected bacterial expression vector containing a reference FP for the primary screening (see Note 2).
3.
Electro-competent bacterial cells which are suitable for protein production in combination with the selected vector, such as BL21(DE3) (NEB, C2527H), for expression with pRSET.
4.
Sequence primers for the FP, for RSET vector: T7 promotor (TAATACGACTCACTATAGGG) and T7 terminator (GCTAGTTATTGCTCAGCGG).
6.
Pfu polymerase (includes 10× Pfu buffer with MgSO4, Fermentas, EP0501).
7.
dNTPs (Fermentas, R1121).
8.
DpnI (Fermentas, ER1701).
9.
GeneRuler™ DNA Ladder Mix (Fermentas, SM0333).
10.
10× Orange G DNA loading buffer (100 mg of Orange G, 30 % (w/v) glycerol and ddH2O, total volume 50 ml).
11.
1 % (w/v) agarose gel (Roche 11388991001) in TAE (40 mM Tris, 1 mM ethylenediaminetetraacetic acid (pH 8.0), 2.2 ml glacial and ddH2O, total volume 50 ml).
12.
Growth medium, Luria-Bertani medium (LB): 10 g Bacto Tryptone, 5 g Bacto Yeast extract, 10 g NaCl and ddH2O, total volume of 1 l. Autoclaved.
13.
Agar plates, 1 l of LB supplemented with 15 g agar and 100 μg/ml ampicillin, 10 ml per Petri dish (diameter 90 mm) (see Note 3).
14.
Electroporation cuvettes, gap width 0.2 cm (Sigma Z706086).
15.
PCR apparatus.
16.
DNA electrophoresis equipment (cell, power source, UV visualization setup).
17.
Horizontal shaker for growing bacterial suspensions (37 °C and 250 rpm).
18.
Incubator at 37 °C.
19.
Electroporation equipment (Eppendorf electroporator 2510).
2.1.2 Fluorescence Lifetime Screening
1.
Bacteria producing the newly synthesized FP(s), bacteria producing a reference FP, and bacteria producing the template FP growing on agar Petri dishes (see Subheading 3.1.1). The colonies should be at least 1 day old. Depending on the fluorescent protein maturation rate, the agar plates with colonies can be older.
2.
Microscopy equipment: home-build frequency-domain FLIM setup. The custom-build apparatus comprises an inverted Zeiss fluorescence microscope (Axiovert-200 M), a II18MD modulated image intensifier (Lambert Instruments), a CoolSNAP HQ CCD camera (Roper Scientific), and two computer-controlled HF-frequency synthesizers (Rohde & Schwartz model SML 01), one driving the intensifier and the other driving a 440 nm modulated laser diode (PicoQuant, LDH-M-C-440) through an MDL-300 driver unit. For CFP variants the laser is intensity modulated at a frequency of 75.1 MHz. Excitation light is reflected by a 455DCLP dichroic mirror (Chroma) onto the sample, and the CFP emission is filtered with a D480/40 band-pass emission filter (Chroma). For reference phase and modulation measurements, a modified filter cube is used in which a mirror is mounted 90° tilted as compared to the normal orientation of a dichroic mirror that directly reflects the laser and passes it directly onto the image intensifier light, attenuated by an ND 5 neutral density filter [20].
3.
Software for control, acquisition, processing, and analysis of the data was written in C++, using MATLAB 6.1 (The Mathworks, USA) and the image processing library DIPlib (Pattern Recognition Group, TU Delft, the Netherlands, http://www.diplib.org/).
4.
Cardboard postal tubes (for A0 format poster) with plastic end caps, diameter 100 mm, length 1,000 mm (thickness of cardboard 2 mm): http://www.verzendkokers.nl.
5.
Low-magnification glass plano-convex lenses (Melles Griot, LPX-25.0-415.0-C-SLMF-400-700).
6.
A computer running ImageJ software (free download for different platforms: http://rsbweb.nih.gov/ij/).
7.
Alternatively, we use a commercially available time-correlated single-photon counting (TCSPC) detection module available from PicoQuant, implemented on an inverted Olympus FluoView 1000 confocal microscope. The excitation light of a 440 nm 20 MHz pulsing laser diode (PicoQuant) (see Note 4), as controlled by a Sepia II laser driver unit (PicoQuant), was attenuated ten times by a neutral density filter. The light was guided via a D440 primary dichroic mirror (Chroma) into the tube. The emission light was guided via a size-adjustable pinhole, set at 170 μm, through the Olympus confocal detection box to the fiber output channel. The optical fiber was coupled to a custom-made detection box (PicoQuant) containing four PDM avalanche photodiodes (MPD). The light is filtered by a 475/45 nm emission filter (Chroma) and directed into one of the MPDs. The photon arrival times were recorded by a PicoHarp 300 time-correlated single-photon counting system (PicoQuant) and controlled and analyzed using the SymPhoTime 5.2.3 (PicoQuant) software.
2.1.3 Spectral Imaging (SPIM)
1.
2.
Microscopy equipment: Axiovert 200 M motorized microscope (Zeiss, Germany), 10×/NA 0.3 air objective. AttoArc 100 W mercury lamp (Zeiss, Germany). CFP spectra are recorded using a 436/10 nm excitation and an 80/20 (transmission/reflection) dichroic mirror and a LP460 longpass filter, using a slit spectrograph (ImSpector, SPECIM, Finland), mounted in front of a CCD camera (ORCA II, Hamamatsu, Japan). The instrument is described in Subheading 2.1.2 and is a multimode platform for FLIM and SPIM [20, 21].
3.
Software for control, acquisition, processing, and analysis of the data was written in C++, using MATLAB 6.1 (The Mathworks, USA) and the image processing library DIPlib (Pattern Recognition Group, TU Delft, The Netherlands, http://www.diplib.org/).
2.2 Characterization of Purified Protein
2.2.1 Purifying Fluorescent Proteins
Ni2+ Affinity Columns
1.
0.1 M NiSO4 in ddH2O.
2.
50 mM EDTA pH 7.5–8.0 in ddH2O.
3.
20 % (w/v) ethanol in ddH2O.
4.
His-Bind resin (Novagen, 69670-2).
5.
15 ml tubes with screw cap.
6.
Table top swing-out centrifuge (Eppendorf 5810R).
Protein Isolation
7.
Bacterial strain optimized for protein production, e.g., BL21 DE3 (electro-competent).
8.
Bacterial expression vector with selected FP fused to a 6xHis tag and pRSET including 6xHis tag.
9.
Growth medium and medium with selection marker suited for protein production of the strain in combination with the vector. For BL21 DE3 in combination with pRSET vectors, LB supplemented with 100 μg/ml ampicillin can be used for protein production (see Subheading 2.1.1).
10.
Lysozyme (L7651, Sigma-Aldrich).
11.
Benzonase nuclease 25 U/μl (previously Novagen, now Merck/Millipore, 71205-3).
12.
100 mM phenylmethanesulfonyl fluoride (PMSF) in isopropanol.
13.
10 % NP40 (v/v) in ddH2O.
14.
Imidazole.
15.
Buffer 1: 20 mM Tris and 200 mM NaCl in ddH2O pH 8.0 (HCl).
16.
Buffer A (20 mM Tris–HCl in ddH2O, pH 8.5, filter sterilized 0.22 μm).
17.
Buffer B (20 mM Tris–HCl and 1 M NaCl in ddH2O, pH 8.5, filter sterilized 0.22 μm).
18.
Electroporator (Eppendorf 2510) and electroporation cuvettes (gap size 0.2 cm).
19.
Incubator at 37 °C, shaking at 250 rpm, for 250 ml Erlenmeyer flasks and 25 ml cultivation flasks.
20.
Table top swing-out centrifuge (Eppendorf 5810R).
21.
Centrifuge (Sorvall RC 5B plus, rotor Sorvall SS-34 with compatible buckets).
22.
Rotator at 4 °C.
23.
Sonicator (Branson Sonic Power Company, sonifier B12, with tip size ½″ diameter).
24.
50 ml tubes with screw cap.
25.
0.22 μm filter (Millipore) and syringe.
26.
Dialysis tube (molecular porous membrane tubing #3), dialysis clamps, beaker glass ~2 L, and large stirring bean.
27.
FPLC machine (ÄKTA FPLC, Amersham Bioscience).
28.
MonoQ 5/50 GL (GE Healthcare 17-5166-01).
Protein Concentration Determination
29.
BCA protein assay kit including bovine serum albumin reference (Thermo Scientific).
Protein Purity Assay: SDS-PAGE
30.
2× sample buffer: 2.5 ml 0.5 M Tris–HCl (pH 6.8), 2.0 ml 20 % (w/v) sodium dodecyl sulfate in ddH2O, 5 ml 100 % glycerol, 2 mg bromophenol blue, and 0.5 ml ddH2O.
31.
PageRulerTM protein ladder (Fermentas, SM0669).
32.
Coomassie staining (0.2 % Coomassie BB R-250, 2 % acetic acid, 50 % methanol).
33.
Protein cell and casting system (Biorad, Mini-PROTEAN II).
34.
Platform shaker.
2.2.2 Excitation Spectrum and Molar Extinction Coefficient
2.2.3 Emission Spectrum and Fluorescence Quantum Yield
2.
Buffer for diluting the selected FPs, CFP variants PBS or 10 mM Tris–HCl (pH 8.0).
3.
Reference fluorescence dye with known quantum yield and emission and excitation spectra comparable to the selected FPs with unknown quantum yield. For CFP variants fluorescein (borate buffer pH 9.1) can be used [22]. It is also possible to use a well-characterized FP with known quantum yield and comparable emission and excitation spectra.
4.
Spectral Fluorescence Standard Kit (certified by BAM) (Sigma 97003).
5.
Two quartz absorption cuvettes (200 μl).
6.
One quartz fluorescence cuvette (1 ml).
7.
Biochrom Libra S70 spectrophotometer.
8.
PTI QuantaMaster 2000-4 fluorescence spectrofluorometer (Photon Technology International, Lawrenceville, NJ).
9.
Acquisition software: FelixGX software.
2.2.4 Fluorescence Lifetime
2.
Purified FP solution of the same spectral class with known fluorescence lifetime, which can be used as reference.
3.
Phosphate buffered saline (PBS: mix 8 g of NaCl, 0.2 g of KCl, 1.44 g of Na2HPO4, 0.24 g of KH2PO4, and 800 mL of ddH2O. Set to pH 7.4, fill up to 1 l with ddH2O, and autoclave)
4.
96-well plate (black polystyrene, glass bottom, Whatman 7706-2370)
5.
Microscope equipment as described in Subheading 2.1.2, TD-FLIM, but no adaptations are performed on the inverted microscope. Here a standard microscope objective is used.
2.2.5 Intrinsic Molecular Brightness
2.
Purified FP solution of the same spectral class for molecular brightness comparison, for CFP variants ECFP was used.
3.
Calibration dye with known diffusion time [23] and roughly similar spectral characteristics as the selected FPs, e.g., Alexa 488 for CFP variants.
4.
10 mM Tris (pH 7.4).
5.
Diluted samples may be stabilized by adding bovine albumin serum (BSA) or TritonX-100 (Tx-100) [24].
7.
High-quality objectives are required, matching the refractive index of the sample like the 60× water immersed UPLS Apochromat, N.A. 1.2 (Olympus), and UPlanSApo 60× silicone, 1.30 N.A. (Olympus) for in vivo measurements.
8.
A computer running fluorescence fluctuation spectroscopy analysis software, e.g., FFS data processor 2.3 (www.sstcenter.com).
2.2.6 Oligomeric State
2.
3.
See Subheading 2.2.1 (Protein purity assay—SDS-PAGE) but a different sample buffer and additional FP references.
4.
2× sample buffer: 2.5 ml 0.5 M Tris–HCl (pH 6.8), 5 ml 100 % glycerol, 2 mg bromophenol blue, and 2.5 ml ddH2O.
2.2.7 pH Sensitivity
2.
pH-titration buffers: 50 mM citric acid/Na2+citrate (pH 3.0, 3.5, 4.0, 4.5, 5.0, 5.5), KH2PO4/Na2HPO4 (pH 6.0, 6.5, 7.0, 7.5, 8.0), and/or glycine/NaOH (pH 8.5, 9.0, 9.5, 10.0).
3.
96-well plate (black plate clear bottom, Costar 3603).
4.
Microtiter plate reader (BioTek Synergy Mx plate reader).
5.
Software: BioTek Gen5 Data analysis software.
6.
Plate reader settings: excitation 440 nm and emission filter 480/20 nm, measure from the bottom.
7.
A computer running KaleidaGraph or alternative software package in order to fit the data to a sigmoid equation.
2.3 Characterization In Vivo
2.3.1 Fluorescent Protein Maturation in Bacteria
2.
Vector containing a reference FP sequence (template, other related FPs for comparison, or optional dark FP) (see Note 6).
3.
Strain bacteria optimized for protein production in combination with the selected vector, e.g., BL21 (DE3) (electro-competent).
4.
Growth medium and medium with selection marker suited for protein production of the strain in combination with the vector (see Subheading 2.1.1). For BL21 (DE3) in combination with pRSET vectors, LB supplemented with 100 μg/ml ampicillin can be used for protein production.
5.
96-well plate (black plate clear bottom, Costar 3603) including lid.
6.
Small bacteria-cultivating flasks (volume 25 ml).
7.
Incubator at 37 °C and vigorous shaking (~250 rpm).
9.
Plastic cuvettes.
10.
Microtiter plate reader: BioTek Synergy Mx plate reader.
11.
Software: BioTek Gen5 data analysis software.
2.3.2 Cloning in Mammalian Vector
1.
Bacteria expressing the selected FPs.
2.
Equipment and kits for mammalian vector cloning.
2.3.3 Transfection and Mounting of Mammalian Cells
1.
FP mammalian expression plasmid (e.g., mTurqoise2-C1).
2.
1–3 μl of plasmid (~250 ng/μl; from a column purified miniprep (GeneJET PCR purification kit, #k0702, Fermentas)).
3.
Confluent T25 flask with HeLa cells.
4.
Growth medium (DMEM-GlutaMAX (#61965-059), 10 % FBS, penicillin (100 units/ml) and streptomycin (100 μg/ml) all from Invitrogen).
5.
Lipofectamine 2000 (Invitrogen).
6.
Opti-MEM (Invitrogen).
7.
Microscopy medium (140 mM NaCl, 5 mM KCl, 1 mM MgCl2, 1 mM CaCl2, 10 mM glucose, 20 mM HEPES (Sigma), pH 7.4) (see Note 8).
8.
70 % EtOH.
9.
6-well plate.
10.
Cover glasses (diameter 24 mm, thickness #1, Thermo Scientific).
2.3.4 Photostability In Vivo
Wide-Field Conditions
2.
Transient transfected cells with a reference FP (from the same spectral class) produced (see Subheading 3.3.3).
3.
Zeiss Axiovert 200 M.
4.
63× (Plan Apochromat NA 1.4 oil).
5.
10× objective (10× Plan Neofluar NA 0.3 air).
6.
100 W HBO Hg lamp.
7.
Princeton Instruments CCD camera with Kodak KAF1300 chip and ST-133 controller interfaced with a PCI board to a PC.
8.
For CFP variants: excitation filter 436/20, dichroic mirror 80/20, and emission filter LP460 nm.
9.
Melles Griot Broadband Powermeter (13PEM001).
10.
Stage micrometer (Agar Scientific, L4078).
11.
Grey filter (ND1.3).
12.
A computer running ImageJ software (free download for different platforms: http://rsbweb.nih.gov/ij/).
Laser Scanning Conditions
1.
Mammalian cells with the selected immobilized FP produced, e.g., HeLa cells with mTurquoise2 fused to histone2A to immobilize most FP protein to the DNA in the nucleus. This can be accomplished by transfecting HeLa cells with an mTurquoise-histone2A-C1 construct (see Subheading 3.3.3).
2.
Mammalian cells with a reference FP (from the same spectral class) immobilized in the same manner as the selected FP. It is of great importance to keep all settings equal for the different FP variant (see Subheading 3.3.3).
3.
Microscopy equipment: Nikon A1 laser scanning microscope, Nikon Plan Apo VC 60×, NA1.4 oil immersed objective. CFP was excited by a 443 nm diode laser and the fluorescence was detected using a 482/35 nm band-pass filter. The pinhole was opened completely.
4.
A computer running ImageJ software (free download for different platforms: http://rsbweb.nih.gov/ij/).
2.3.5 Relative Brightness In Vivo
1.
Mammalian cells that produced the selected FP, which is quantitatively coproduced with a reference FP. The selected FP and the reference FP must have separated spectra. The coproduction is realized by linking the DNA sequences of the selected FP and reference FP with a viral 2A peptide sequence [7]. Here we used CFP variants as selected FPs and SYFP2 as reference.
2.
Microscopy equipment: Zeiss 200 M inverted microscope, 40× Plan Neofluar (1.3 NA) oil-immersion lens (Zeiss). Illumination by a Cairn Xenon Arc lamp was selected by a monochromator (Cairn Research). For the CFP channel, excitation at 420 nm (slit 30 nm), reflection by a 455DCLP dichroic mirror, and fluorescence passing through a 470/30 nm band-pass filter. For the YFP channel, excitation at 500 nm (slit 30 nm), reflection by a 515DCXR dichroic mirror, and the emission passing through a 535/30 nm band-pass filter. Images are acquired with a Photometrics CoolSNAP HQ CCD camera (4 × 4 binning).
3.
Acquisition software: MetaMorph software (Molecular Devices).
4.
A computer running ImageJ software (free download for different platforms: http://rsbweb.nih.gov/ij/) and ObjectJ plug-in (http://simon.bio.uva.nl/objectj/) for ImageJ.
2.3.6 Subcellular Localization Studies
1.
Isolated DNA of the selected FPs.
2.
Mammalian vectors containing a target sequence. Plasmids encoding mTurquoise2 organelle markers are available (http://www.addgene.org/browse/article/5268/).
3.
Mammalian vector cloning kit.
4.
Commercial available organelle stains (e.g., MitoTracker, Life Technologies).
5.
Microscopy equipment: Nikon A1 laser scanning microscope, Nikon Plan Apo VC 60× oil objective N.A. 1.4. Excitation by a 443 nm diode laser. The fluorescence is directed by a 440/514/593 dichroic mirror, through a 482/35 nm band-pass filter.
Box 1 Design of Primers for Site-Directed Saturation Mutagenesis
Primer Design: We typically design our mutagenic primers by using 15 nucleotides before and 15 nucleotides after the codon that is targeted for annealing to the plasmid. For saturated random mutagenesis, we employ the degenerate codon NNK in the forward primer, while the reverse primer has the complementary codon MNN (N = A,C,G,T and K = G,T and M = A,C). These degenerate codons encode all 20 possible amino acids.
The GC content should be above 40 % and the nucleotide at the 3′-end is preferably a G or a C. For site-directed mutagenesis the melting temperature (T m) should be close to 78 °C or above. The T m can be calculated according to this equation:
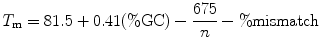 where n = total number of bases.
Since the codon is degenerate, the %GC and % mismatch will vary, depending on the exact codon that is present in the primer. Consequently, the T m is a range for a primer with a degenerate codon, rather than a single value. We do not calculate the T m and our simple design rules have worked so far for every primer tested (>10 different primers with degenerate codons). Example primers can be found in the following table.
Name
Stay updated, free articles. Join our Telegram channel
Full access? Get Clinical Tree
 Get Clinical Tree app for offline access

|
|---|