around the vertical axis (Y) fitting the histological data. As a result, we obtained a cochlea similar to the one presented in (Fig. 3).
One of the advantages of the method used to generate the cochlea is that it can be resized and adapted to individual cochlear shapes. Figure 3b presents a resized cochlea adapted to clinical CT scans of the temporal bone before implantation. The cochlear resizing is achieved by adapting the largest distance from the round window to the lateral wall (distance A) and the perpendicular distance (B) as defined in [5]. Additionally the cochlear length at different places (0.5, 1.5, 2, 2.5 turns of the cochlea) and the height of the cochlea can be adapted from clinical cone beam computed tomography (CBCT) data (Fig. 1a, b). As an example, the dimensions for two cochleas (“C1” and “C2”) are given in Table 1.


Fig. 1
a Cochlear dimensions estimated from clinical computer tomography. A- and B- value in CBCT data as clinical metric parameters. b Height of the cochlea starting from the lowest basal point to the apex
Table 1
Cochlear dimensions for the cochleas “C1” and “C2”
0.5 TL | 1 TL | 1.5 TL | 2 TL | 2.5 TL | A-value (mm) | B-value (mm) | Height (mm) | |
|---|---|---|---|---|---|---|---|---|
C1 | 11.61 | 22.39 | 32.44 | 39.02 | 43.95 | 7.74 | 5.21 | 6.74 |
C2 | 14.05 | 25.27 | 35.44 | 43.08 | 48.03 | 8.43 | 5.93 | 5.37 |

Fig. 2
Left Cochlea in sagital cross-section. 1 Basilar membrane, 2 Modiolus, 3 Spiral ligament, 4 Scala vestibuli, 5 Scala tympani, 6 Limbus laminae spiralis Center Cochlea in axial cross-section. 1 Spiral ligament, 2 Scala vestibuli, 3 Scala tympani, 4 Modiolus, 5 Osseous spiral lamina in contact to the basilar membrane, 6 Cochlear nerve in internal auditory meatus Right Cochlea in sagital cross-section 1 Facial nerve in facial nerve canal, 2 Scala vestibuli, 3 Spiral ligament, 4 Osseous spiral lamina in contact to the basilar membrane, 5 Modiolus, 6 Scala tympani, 7 Cochlear nerve in internal auditory meatus
Next, a CI electrode array was modelled using ball/sphere electrodes positioned inside the scala tympani. This simple approach was taken because it allows for an easy parameterization of experiments by simply shifting the positions of the electrodes. Additionally, the positions of the electrodes can be adapted to the individual position of each CI user by analyzing post-operative CT scans (Fig. 2). Each electrode was placed at a distance of 1.5 mm with respect to the next electrode. In total 16 electrodes were placed inside the scala tympani.
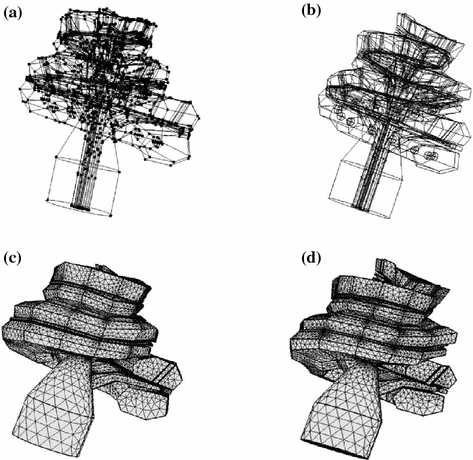
The cochlear geometry was discretized into elements with a minimum size of 0.2 mm leading to a total of 485654 and 441389 elements for the cochlea “C1” and “C2” respectively (Fig. 3c, d).


Fig. 3
Computed Aided Design (CAD) models and generated meshes adapted to the cochlear dimensions of two patients based on clinical CT images. Figures on the left correspond to the cochlea “C1” and figures on the right correspond to the cochlea “C2”
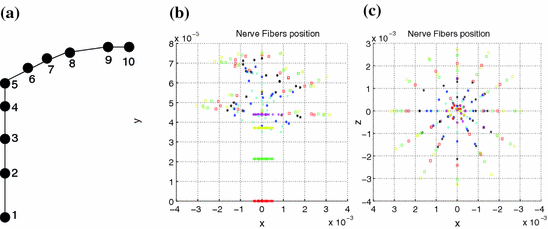
Along the CAD model of the cochlea, measurements of the electrical field were performed at the electrode positions, and at different positions of the spiral ganglions. Each spiral ganglion was modeled by 10 nodes (Fig. 4a). In total 3,000 spiral ganglions positions were modelled covering two and half turns of the cochlea as presented in Fig. 4.


Fig. 4
a Node positions for a single spiral ganglion inside, b and c node positions for all the spiral ganglions for the XY and XZ planes respectively
2.2 Materials
The geometry was classified into domains, and each domain was assigned a material property in the form of conductivity. The conductivity values are listed in Table 2.
Structure | Conductivity  |
|---|---|
Electrodes | 1000 |
Scala media | 1.67 |
Scala tympani | 1.43 |
Scala vestibuli | 1.43 |
Basilar membrane | 0.0625 |
Reissner membrane | 0.00098 |
Nerve | 0.3 |
Bone | 0.156 |
2.3 Finite Element Method (FEM)
FEM for the given geometry was solved using the COMSOL solver . In this paragraph we briefly review the electrostatic equations solved by the FEM. The different elements in which the geometry was decomposed are reconnected at nodes. Next the electric field is approximated at these nodes resulting in a set of algebraic equations. The basis for the equations is the Poisson equation which gives the electrostatic potential for a given charge distribution:

where  is the Laplacian operator given by:

And  is a d-dimensional domain (volume in 3d). The unknown function is the electrostatic potential
  and the given data is the charge distribution
  .
.

(1)
 is the Laplacian operator given by:
(2)
 is a d-dimensional domain (volume in 3d). The unknown function is the electrostatic potential
  and the given data is the charge distribution
  .
.Next, the Gauss’ law, also known as Gauss flux theorem, which is a law relating the distribution of electric charge to the resulting electric field is used. In its integral form, the law states that, for any volume  in space, with boundary surface
  , the following equation holds:

where the left hand side is called the “electric flux” through  ,
,  is the electric field
  is a surface integral with an outward facing surface with a normal orientation. The surface
  is the surface bounding the volume
  ,
,  is the total electric charge in the volume V,
  is the electric constant – a fundamental physical constant. Again using divergence theorem, the differential form of the Gauss’law is:

where  is the charge density. Since the line integral of the electric field around any close curve in space equals 0
  ,
,

Eliminating by substitution, we have a form of the Poisson equation:

In practice  can be calculated as the difference between the elecric potential at two positions divided by the distance between those positions as follows:

Therefore, if we know the electric field, we can calculate the voltage at different points. The current density in the medium  can be obtained from the Ohm law as follows:

where  is the electrical conductivity of the material in the model (S/m).
 in space, with boundary surface
  , the following equation holds:
(3)
 ,
,  is the electric field
  is a surface integral with an outward facing surface with a normal orientation. The surface
  is the surface bounding the volume
  ,
,  is the total electric charge in the volume V,
  is the electric constant – a fundamental physical constant. Again using divergence theorem, the differential form of the Gauss’law is:
(4)
 is the charge density. Since the line integral of the electric field around any close curve in space equals 0
  ,
,
(5)

(6)
 can be calculated as the difference between the elecric potential at two positions divided by the distance between those positions as follows:
(7)
 can be obtained from the Ohm law as follows:
(8)
 is the electrical conductivity of the material in the model (S/m).
2.4 Individual Model of a Degenerate Nerve Fiber
It has been shown that in persons with profound hearing loss, the dendrites are almost lost but the somas and axons survive, this is known as retrograde neural degeneration. It has been also shown that the degree of retrograde concerns only Type I auditory nerve fibers [20]. A degenerate version of the auditory nerve model similar to the one presented in [20] was used to simulate its effect. This was modelled by removing the first four nodes of each nerve presented in Fig. 4a.
Stay updated, free articles. Join our Telegram channel

Full access? Get Clinical Tree


