- the main features of the following study designs: (i) case series; (ii) ecological studies; (iii) cross-sectional studies; (iv) case-control studies; (v) cohort studies;
- the strengths and weaknesses of each type of study design;
- how to choose a study design for your research question.
Observational vs. intervention studies
Many doctors feel they know which treatments work best from clinical observation or experience. This may be reasonable in some circumstances. For example, when sulphonamides were introduced for the treatment of meningococcal meningitis the effect on mortality was striking. However few treatments have such dramatic effects and research studies are generally required to determine what works best.
The best currently available method of assessing the effectiveness of treatments is the randomised controlled trial (RCT). This is described in detail in Chapter 11. Other types of study design can also be used for testing hypotheses. These can be listed in the order of the likelihood that they will provide the best quality of evidence. Therefore, we can describe a hierarchy of evidence based on study design (see Box 5.1). This ordering, of course, assumes that each study is well-designed and conducted (see Chapter 8 on evidence-based medicine).
In an RCT (also known as an intervention or experimental study), the investigator tests whether changing something about the patient, or his/her treatment, alters the course of disease. For example, if a random half of smokers were given free nicotine patches and the other half were not, we could determine whether the intervention (i.e. nicotine patches) increased the proportion of participants who quit smoking over the subsequent year. The essence of an interventional study is that we intervene. One of the main advantages of an RCT is that, if randomisation is done properly, the likelihood of both known and unknown confounders are balanced across both groups so that any observed differences should be due to a causal effect of the intervention (assuming it isn’t due to chance) (see Chapter 3).
On the other hand, observational studies investigate whether certain exposures (or risk factors) are associated with the occurrence or progression of disease, without attempting to interfere with people’s life. For example, we could observe whether smokers are more likely to get a heart attack than nonsmokers (smoking status is our exposure and heart attack is the outcome). We do not intervene in any way, we simply observe. There are a variety of reasons why researchers need to conduct studies using observational studies, see Box 5.2.
- Meta-analysis of randomised controlled trials
- Randomised controlled trial
- Cohort study
- Case-control study
- Cross-sectional study
- Ecological study
- Case series
- Experimentation may be unethical, e.g. to study the effects of exposure to radioactivity we cannot allocate individuals to be exposed or not exposed.
- Experimentation may be difficult to implement, e.g. to test whether income supplementation improves health we would need to allocate subjects in poverty to either receive or not receive additional income.
- Experimentation may be inappropriate, e.g. to detect rare outcomes associated with a drug would require withholding a potentially highly effective treatment.
- If trials recruit atypical subjects, their results may not be generalisable. Patients who agree to participate in intervention trials are often different from all subjects with that disease (for example they may be more likely to adhere to therapy).
- Observational studies may be used to generate hypotheses that are subsequently tested in randomised trials. For example, associations between diet and cancer seen in observational studies have subsequently been tested in randomised trials of food supplements.
In this chapter we describe five types of observational study. Each has their own advantages and disadvantages, which are covered at the end of the chapter.
Types of study designs: an overview
Case series
A case series is a report, usually from a specialist, who has observed an unusual occurrence of either a ‘new disease’ (for example the observation of a rare type of lung infection amongst gay men in the USA heralded the discovery of HIV) or an association between an exposure and disease. In 1961 an Australian obstetrician called William McBride noted an increase in the incidence of around 20% of children born with shortened or absent limbs whose mothers reported taking a drug called thalidomide. This had been promoted as a treatment for morning sickness in 1958. McBride was startled by this much higher than expected incidence of disease. His very brief 100-word report to the Lancet resulted in confirmatory reports from Germany and other countries and subsequently led to the withdrawal of thalidomide (McBride, 1961). In general case reports are hypothesis generating and require higher-quality studies that have information about risk in both exposed and unexposed group as well as data on confounders.
Ecological studies
In most epidemiological studies, we measure exposures and outcomes on an individual level, and analyse these appropriately. An ecological study is a study in which the unit of analysis is a group rather than an individual; instead of measuring, for example, the number of hours of television an individual watches, and relating this to his/her blood pressure, we could analyse the association between the mean number of hours of television watched by people living in different parts of the country (as reported by monitoring of TV behaviour by the national TV broadcaster) and compare this with the average blood pressure measured in a health survey covering the same geographical areas. An advantage of this type of study is that it can often be performed using routinely published data or information found on the internet, so one can provide answers quickly and cheaply. However, the main problem is that on an individual level, the people who are exposed may not be the ones who experience the outcome (e.g. areas with higher TV watching may on average have higher blood pressure but the people who watch a lot of TV may not be the ones with the high blood pressure). If the associations that are detected on a group level do not hold on an individual level, the study suffers from a type of bias known as ecological fallacy.
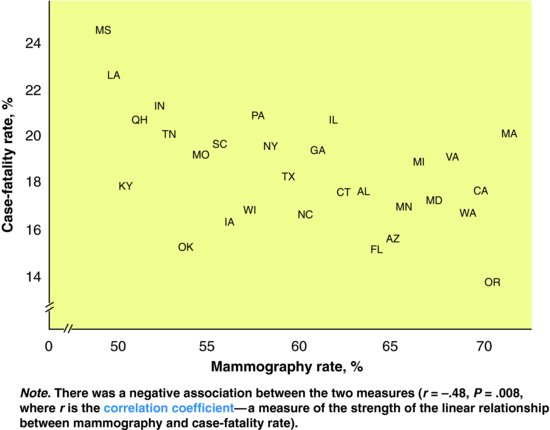
Example: Mammography use and breast cancer case fatality
To determine the association of mammography with breast cancer case fatality rates, an ecological study of white women aged over 64 years was conducted in the US (Cooper et al., 1998). The exposure variable was the proportion of eligible women in each state who had attended screening mammography. The outcome was the age-adjusted 2-year case-fatality rate for breast cancer. The results are shown in Figure 5.1. The authors conclude, based on these ecological data, that high screening rates are associated with lower breast cancer case fatality rates, presumably as a result of the diagnosis of earlier stage cancers.
Figure 5.1 Relation between average 1990/91 mammography rates and 2-year case fatality rates for 29 states.
Source: From Cooper GS, Yan Z, Bowlin SJ et al. (1998) An ecological study of the effectiveness of mammography in reducing breast cancer mortality. Am J Public Health 88: 281–4, with permission.
Cross-sectional studies
Cross-sectional studies are mainly used to measure the burden of disease in a population, though they can also examine risk-factor associations. It represents a ‘snapshot’ of disease in a population at one moment in time (e.g. on a pre-specified day – 1 July 2011 – taken as the prevalence day or a period (e.g. over a year – 2011). This is particularly helpful for diseases that do not necessarily present to doctors as patients may be asymptomatic, e.g. high blood pressure, maturity onset diabetes. Thus, if one screens participants, one will identify individuals both known and not known to have the disease. The latter group may often be more common and this phenomenon is referred to as the clinical iceberg, as medical services are only aware of the ice above the water line. This is important both for the introduction of any screening programme (see Chapter 16) as well as planning health care services.
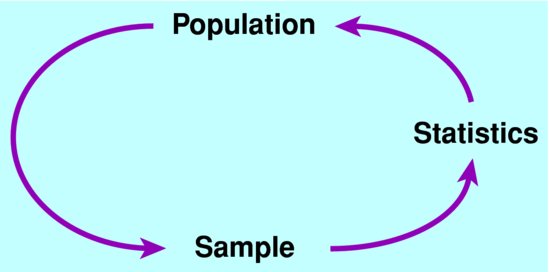
To undertake a cross-sectional study one must first define a target population. This is the population to which one wants to generalise the study findings (see Figure 5.2). Although one could try to measure disease in the complete target population this is usually not done as it is unnecessary and would greatly add to the cost of the study. Instead one takes a sample of individuals in the target population (selected sample). These subjects must be representative of the target population as otherwise the results will be biased. This is best done by either randomly sampling areas or individuals within areas. Random sampling implies that each individual has equal chance of being selected. These subjects are then invited to take part in the study though inevitably some will not wish to do so leaving you with data on a study sample. Again, if those not taking part are more or less likely to have the disease, the results will be biased in either over or under-estimating the prevalence of disease especially if the response rate is poor.
One then requires a standardised case definition to allow one to classify subjects into normal or disease (see Chapter 1). This may have more than one group such as probable disease and possible disease as some subjects may have some but not sufficient criteria to fulfil the complete case definition. One can then calculate a prevalence risk with a 95% confidence interval (CI), which indicates our degree of uncertainty around the estimate. In addition to classifying subjects as having disease or not one can also measure exposures either by questionnaire, examination or biosamples. As exposure is collected at the same time as disease status, this association needs to be treated with caution as it may reflect a reporting bias (e.g. cases of disease may be more aware and report of a positive family history than subjects without disease) or may be secondary to the disease, known as reverse causality (e.g. an association between serum inflammatory markers and atherosclerosis may be noncausal and due to damage to the arteries).
Example: The prevalence of diagnosed and undiagnosed diabetes and its association with ethnicity in the USA. (Harris et al., 1998)
NHANESIII is a large (18,825) cross-sectional study of US adults (>20 years) living in their own homes (target population). 81% of the randomly selected sampled population agreed to take part in an interview and examination (study sample). The interview classified subjects into non-Hispanic whites, African Americans and Hispanic whites. Subjects were also asked if they had a past history of diabetes diagnosed by a physician. Subjects had a blood sample after an overnight fast and some were given a glucose challenge test. 5.1% of subjects were known to have diabetes but 2.7% had undiagnosed diabetes and 6.9% of subjects had impaired glucose tolerance (a pre-diabetes stage that has a high risk of going onto diabetes). African American and Hispanic whites were 1.6 and 1.9 times more likely to have diabetes than non-Hispanic Whites. This could not be due to reverse causation or differential access to health care as both known and unknown cases were ascertained.
Case-control studies
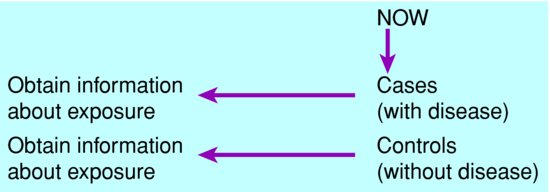
A case-control study compares the frequency of exposure among people with the disease (cases) with that in a comparable group without the disease (controls). Subjects are selected on the basis of the outcome, i.e. whether or not they have the disease, then exposure is measured retrospectively. The exposure data may be reported by each subject, or extracted from records if available, but always are collected after disease status has been ascertained. This is the opposite of a prospective cohort study (see ‘Cohort studies’ section, below, pp. 40–42). See Figure 5.3.
Stay updated, free articles. Join our Telegram channel

Full access? Get Clinical Tree


