CHAPTER 1 Normal blood cells
Erythrocytes
Morphology
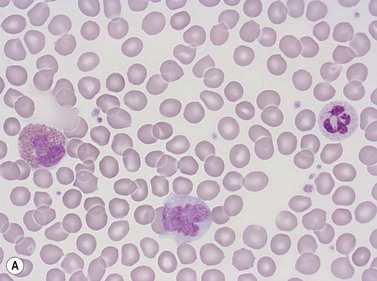
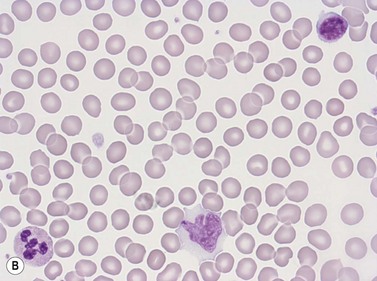
Erythrocytes are highly differentiated cells that have no nuclei or cytoplasmic organelles. Normal erythrocytes are circular biconcave discs with a mean diameter of 7.2 µm (range 6.7–7.7 µm) in dried fixed smears and about 7.5 µm in the living state. They are eosinophilic and consequently appear red with a central area of pallor in Romanowsky-stained smears (Fig. 1.1 A,B).
Red cell parameters
The three basic red blood cell parameters which can be measured are:1
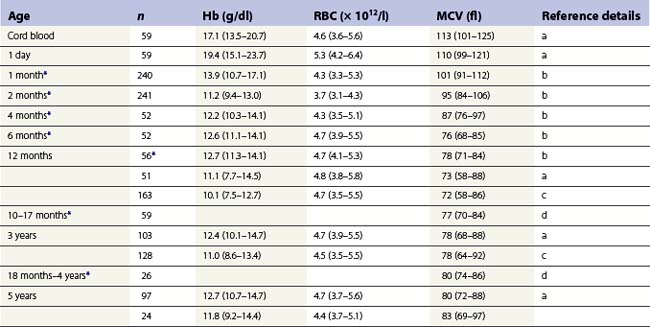
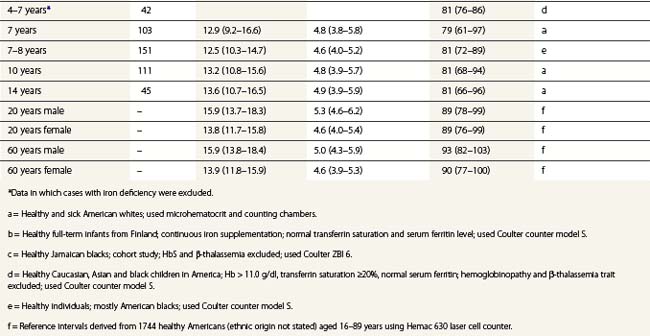
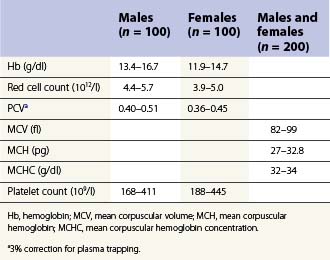
From the values obtained for the hemoglobin concentration, red cell count and hematocrit, it is possible to calculate the mean cell volume (MCV), mean cell hemoglobin (MCH) and mean cell hemoglobin concentration (MCHC) as shown in Table 1.1. Some automated blood-counting machines determine the MCV using electrical impedance or light-scattering techniques and calculate the hematocrit from the measured MCV and red cell count. Others determine the hematocrit directly by summing all the pulses in the red cell channel. The normal values for various red cell parameters at different ages are given in Tables 1.2 and 1.3; however, there are some differences based on the analyzer used and the method of measurement. Between the age of 2 years and the onset of puberty there is a gradual rise in the hemoglobin concentration in both males and females. There is a subsequent further rise in males but not in females with the result that the mean hemoglobin is higher in adult males than in adult females. In healthy infants aged 4 months and over, and in healthy young children, the average MCV is lower than in healthy adults. Whereas the lower limit for the MCV in unselected healthy adults is 82 fl, the corresponding figure for children between 1 and 7 years (who show no biochemical evidence of iron deficiency) is about 70 fl. The MCV increases progressively with age both in children and, to a much lesser extent, in adults.
Table 1.1 Calculation of red cell indices
| MCV (fl) | = Hcta ÷ RBC per liter × 1015 |
| MCH (pg) | = Hbb ÷ RBC per liter × 1013 |
| MCHC (g/dl) | = Hbb ÷ Hcta |
Hb, hemoglobin; Hct, hematocrit; MCH, mean corpuscular hemoglobin; MCHC, mean corpuscular hemoglobin concentration; MCV, mean corpuscular volume; RBC, red blood cells.
Table 1.2 95% reference limits for some hematologic parameters in healthy Caucasian adults (18–60 years) determined in the UK48
Red cell life span
The critical change that causes a red cell to be destroyed at the end of its life span appears to be the formation of denatured/oxidized hemoglobin (hemichromes) which induces clustering of the integral membrane protein, band 3. This clustering generates an epitope on the red cell surface that binds naturally occurring IgG anti-band 3 antibodies and the antibody-coated aged erythrocytes are recognized and phagocytosed by macrophages.2,3 A second mechanism that may be involved in the elimination of aged red cells by macrophages is the exposure of phosphatidylserine on the outer surface of their cell membrane; this is recognized by the macrophage scavenger receptor CD36 or, after combination with lactadherin, by macrophage integrin.3,4 Aging red cells also extrude microvesicles containing denatured hemoglobin that have the same membrane changes and are phagocytosed by the same mechanisms as the residual red cell.5
Functions of red cells
Normal function of the erythrocyte requires a normal red cell membrane and normal enzyme systems to provide energy and protect against oxidant damage. The erythrocyte membrane is composed of a lipid bilayer (containing integral proteins) and is bound to a submembranous cytoskeletal network of protein molecules including spectrin, actin and the proteins constituting bands 4.1a and 4.1b6 (Chapter 7). This cytoskeletal network is responsible for maintaining the biconcave shape of a normal erythrocyte. The membrane also contains adenosine triphosphate (ATP)-dependent cation pumps that continuously pump Na+ out and K+ into the red cell, against concentration gradients, thereby counteracting a continuous passive diffusion of ions across the membrane in the opposite direction. Mature erythrocytes derive their energy from glycolysis by the Embden–Meyerhof pathway (Chapter 8). They can also metabolize glucose through the pentose phosphate pathway, which generates the reduction potential of the cell and protects the membrane, the hemoglobin and erythrocyte enzymes from oxidant damage (Chapter 8). Both a normal cell membrane and normal energy production are required to enable the biconcave red cells to repeatedly and reversibly deform during numerous transits through the microcirculation.
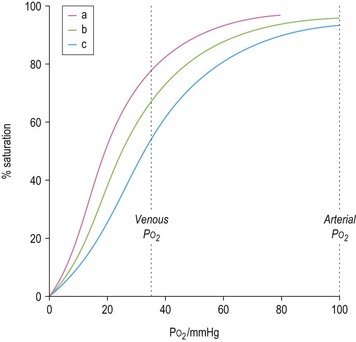
The ability of red cells to combine with and release oxygen is illustrated in the oxygen dissociation curve (Fig. 1.2). The shape of the oxygen dissociation curve of HbA is sigmoid and this is a function of the interaction between the four monomers which make up its tetrameric structure (heme–heme interaction); the combination of one oxygen molecule with one heme group causes a slight shape change in the Hb molecule due to movement at the α1–β2 contact facilitating the binding of oxygen to the next heme group. The shape of the oxygen dissociation curve of the monomer, myoglobin, is hyperbolic. The advantage of the sigmoid curve over the hyperbolic curve is that much more oxygen is released from the hemoprotein at the low PO2 values obtained in tissues (35–40 mmHg) with the former than with the latter. The percentage saturation of hemoglobin at this PO2 is about 70%. The capacity of hemoglobin to combine with O2 is referred to as its oxygen affinity and is expressed as the PO2 required to cause 50% saturation (P50). A decrease in pH leads to a shift of the oxygen dissociation curve to the right and a decrease in oxygen affinity. This effect, which is known as the Bohr effect, facilitates the release of oxygen at the low pH of tissues. A shift of the oxygen dissociation curve to the right also results from the combination of deoxyhemoglobin with 2,3-diphosphoglycerate (2,3-DPG) that is produced as a result of the metabolism of glucose via the Rapoport–Luebering shunt of the Embden–Meyerhof pathway (Chapter 8). In deoxyhemoglobin, the two β chains are separated slightly allowing one molecule of 2,3-DPG to enter and bind to the β chains; when hemoglobin combines with oxygen, the 2,3-DPG is ejected.
The biconcave shape of normal erythrocytes facilitates the diffusion of gases in and out of the cytoplasm and also imparts adequate flexibility and deformability to enable these cells repeatedly to traverse the microcirculation. The hemoglobin molecules within erythrocyes inactivate some of the endothelial cell-derived nitric oxide and consequently regulate the bioavailability of nitric oxide in the circulation. The inactivation results from the reaction of nitric oxide with oxyhemoglobin resulting in the formation of nitrite. Plasma nitrite may also be converted to nitric oxide by deoxyhemoglobin which has a nitrite reductase activity and by a nitric oxide synthase (NOS) located in the plasma membrane and cytoplasm of red cells. These three mechanisms affect nitric oxide-dependent vascular tone and nitric oxide generated by red cell NOS may affect red cell deformability.6–8
Reticulocytes
These are the immediate precursors of mature erythrocytes. They are rounded anucleate cells that are about 20% larger in volume than mature red blood cells and appear faintly polychromatic when stained by a Romanowsky method. When stained with a supravital stain such as new methylene blue or brilliant cresyl blue, the diffuse basophilic material responsible for the polychromasia (i.e. ribosomal RNA) appears as a basophilic reticulum. Electron-microscope studies have shown that reticulocytes are rounded cells with a tortuous surface and that in addition to ribosomes they contain mitochondria and autophagic vacuoles. Circulating reticulocytes mature into red cells over a period of 1–2 days during which there is progressive degradation of ribosomes and mitochondria and the acquisition of a biconcave shape. Reticulocytes actively synthesize hemoglobin and non-hemoglobin proteins. They contain enzymes of the Embden–Meyerhof pathway and the pentose phosphate shunt and, unlike the mature red cells, can also derive energy aerobically via the Krebs cycle that operates in the mitochondria and oxidizes pyruvate to CO2 and water. Supravitally stained preparations were traditionally used and are still frequently used to assess reticulocyte numbers by microscopy with an eyepiece micrometer disc to facilitate counting. In normal adults, the reference range for reticulocytes counted in this way is widely accepted to be 0.5–2.0% of the total circulating erythrocyte plus reticulocyte population. The usefulness of the reticulocyte percentage is increased by applying a correction for the hematocrit and the corrected reticulocyte percentage (usually corrected to a hematocrit of 0.45) is obtained by multiplying the observed percentage by [patient’s hematocrit ÷ 0.45]. Although several laboratories still express reticulocyte counts as a percentage, the absolute reticulocyte count (i.e. the total number per liter of blood) is clinically more useful. The latter is directly proportional both to the rate of effective erythropoiesis and to the average maturation time of blood reticulocytes. In normal adults the absolute reticulocyte count determined by microscopy is 20–110 × 109/l. Reticulocytes can be counted using automated machines employing flow cytometry and laser light after staining their RNA with fluorescent reagents such as acridine orange, thioflavin T, thiazol orange or auramine O. There are also automated methods in which the RNA is stained with supravital basic dyes and the extent of staining quantified using light absorbance or scatter. Results obtained by these automated methods are more reproducible than when counted by the traditional manual method as much larger numbers of reticulocytes are counted. The accepted reference range for reticulocytes in adults when counted by automated fluorescent-based methods is 20–120 × 109/l.9,10 The absolute reticulocyte count has also been shown to be higher in men than women. Reference values do depend on the method of measurement used and each laboratory should determine its own reference range. Semi-automated and fully automated discrete reticulocyte counters and some fully automated multiparameter hematology analyzers also provide various reticulocyte maturation parameters based primarily on the intensity of fluorescence (i.e. the amount of RNA), or, in the case of cells stained supravitally with a basic dye, on the extent of absorbance or scatter. These parameters include the immature reticulocyte fraction (immature reticulocytes have more RNA than mature ones), mean reticulocyte hemoglobin content and concentration and mean reticulocyte volume.11–12 Although these parameters have been shown to be of value in the assessment of certain clinical situations, they are not in regular use in clinical practice.
Granulocytes (polymorphonuclear leukocytes)
Neutrophil granulocytes
Morphology and composition
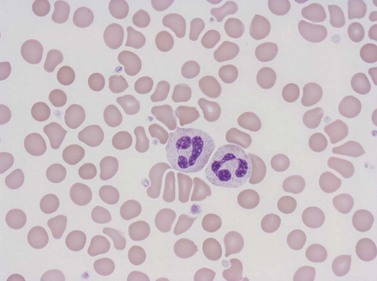
Neutrophil granulocytes have a mean volume of 500 fl and, in dried fixed smears, a diameter of 9–15 µm. Their cytoplasm is slightly acidophilic and contains many very fine granules that stain with neutral dyes; the granules stain a faint purple color with Romanowsky stains (Figs 1.1 and 1.3). The nucleus usually contains two to five nuclear segments; the percentages of neutrophils with two, three, four and five or more segments are 32, 45, 20 and 3%, respectively, with a mean of 2.9 segments. In the female up to 17% of neutrophls contain a drumstick-like appendage attached by a fine chromatin strand to one of the nuclear segments. These appendages correspond to Barr bodies (inactivated X-chromosomes). Neutrophils possess a variety of surface receptors including those for C3 and IgG-Fc and the CXC chemokine receptors.
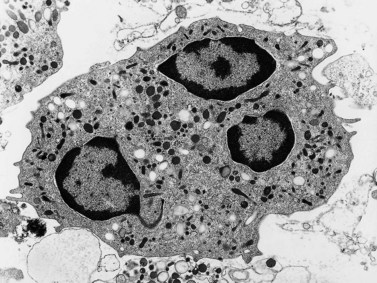
Neutrophils contain primary granules and specific (secondary) granules. Primary granules, first formed at the promyelocyte stage of differentiation, contain myeloperoxidase, lysozyme (muramidase), defensins, bacterial permeability inducer, acid phosphatase, β-glucuronidase, α-mannosidase, elastase, cathepsins B, D and G, and proteinase 3. On electron microscopy they are electron-dense, 0.5–1.0 µm in their long axis, and ellipsoidal in shape (Fig. 1.4). Specific granules are formed at the myelocyte (secondary granules) and metamyelocyte (tertiary granules) stages. They are less electron-dense and are very pleomorphic. Specific granules vary considerably in size, being frequently quite small (0.2–0.5 µm long), and the granule membrane contains NADPH oxidase (cytochrome b558), vitronectin and laminin receptors, formylpeptide receptors and CR3. The granule proteins include lysozyme, transcobalamin I (vitamin B12 binding protein), collagenase, β2 microglobulin, lactoferrin or lactoferrin and gelatinase, SGP28 (specific granule protein of 28 kDa), hCAP-18 (human cationic antimicrobial protein) and NGAL (a matrix protein). A third type of granule contains gelatinase but little or no lactoferrin (gelatinase granules) and neutrophils also contain secretory vesicles with molecules such as β2-integrins, formylpeptide receptors and CD14. The secretory vesicles are involved in adhesion of neutrophils to the endothelium, the gelatinase granules in migration through basement membrane and the primary and specific granules mainly in phagocytosis, killing and digestion of microorganisms.13–14 The alkaline phosphatase activity of neutrophils is present within membrane-bound intracytoplasmic vesicles called phosphosomes. In addition to the various organelles mentioned above, the cytoplasm contains a centrosome, a poorly developed Golgi apparatus, microtubules and microfilaments, a few small mitochondria, a few ribosomes, a little endoplasmic reticulum, occasional multivesicular bodies and numerous glycogen particles.
Number and life span
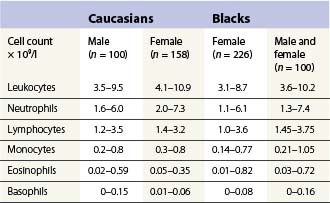
The number of neutrophil granulocytes in the peripheral venous blood of healthy Caucasians of different ages and genders are given in Tables 1.4 and 1.5. Healthy blacks have lower neutrophil counts than Caucasians (Table 1.4); Chinese and Indians have similar counts to those in Europeans.15 A single nucleotide polymorphism in the Duffy antigen receptor/chemokine gene is strongly associated with the neutropenia in Afro-Caribbeans and Africans but the mechanism by which this mutation causes neutropenia is not yet clear.16 Ethnic neutropenia has also been described in Yemenite Jews, Falashah Jews, black Bedouin and Jordanian Arabs.17 Considerably lower total leukocyte and neutrophil counts have been reported from East Africa than those shown in Table 1.4 for black Americans, and black West Indians and Africans living in England. However, the former studies have not allowed for the skewed distribution of leukocyte numbers in calculating reference ranges, and thus have exaggerated the difference between the black and Caucasian populations. Despite this, total white cell and neutrophil counts are probably genuinely lower in Africans living in African countries, particularly if taking an African diet, than in Africans living in Western countries.
Stay updated, free articles. Join our Telegram channel

Full access? Get Clinical Tree


