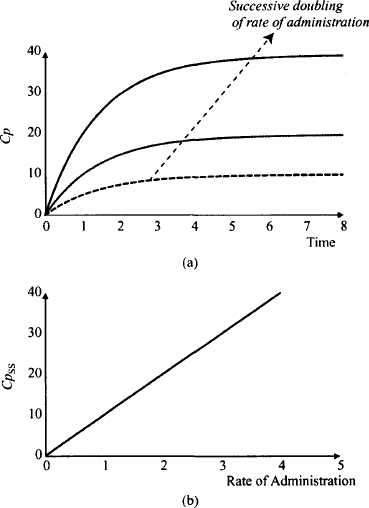
Figure 15.2 shows some important consequences of linear pharmacokinetics with extended drug administration. In Figure 15.2a it can be seen that plasma concentration doubles with every doubling of the rate of drug administration. Figure 15.2b shows an extremely important characteristic of linear pharmacokinetics: The average steady-state plasma concentration is directly proportional to the rate of drug administration. This relationship is used extensively when measured plasma concentrations are used to make dosage adjustments. For example, if a steady-state plasma concentration is half of its goal value, a doubling of the rate of drug administration (double the dose or halve the dosing frequency) should achieve the goal. If a patient is found to have only one-third of the normal clearance, the usual rate of drug administration would produce three times the usual plasma concentration (S. F. Ra = Cl. Cpss). Thus, for this patient the normal rate of administration should be reduced by one-third (reduce the dose by one-third or increase the dosing interval threefold).
FIGURE 15.2 Relationship between plasma concentration and the rate of drug administration for a drug that displays linear pharmacokinetics. A successive doubling of the rate of administration doubles the plasma concentrations at any time (a). The steady-state plasma concentration (Cpss) is directly proportional to the rate of drug administration (b).
Linear pharmacokinetics provides the basis of bioavailability and bioequivalence studies. As seen in Chapter 9;
(15.1) 
In linear pharmacokinetics, clearance is a constant for a given drug:
(15.2) 
Thus, the bioavailability (F) of a drug can be assessed from the dose-normalized AUC. Absolute bioavailability of an extravascular dose (FPO) is determined by comparing its dose-normalized AUC to that after intravenous administration (FIV = 1).
(15.3) 
In bioequivalence studies, where the bioavailability of two different formulations of a drug are compared,
(15.4) 
where the subscripts T and S stand for test and standard, respectively.
If Dτ = DS, relative bioavailability can be assessed simply by comparing the AUC values of the two products:
(15.5) 
Nonlinearity in the pharmacokinetics of a drug greatly complicates drug development, therapeutic drug use, and assessment of bioavailability. Nonlinearity can have a number of different origins but arises when a process in absorption, distribution, metabolism, or excretion (ADME) deviates from a first-order process, and/or when a drug’s pharmacokinetic parameters change with dose.
15.2 NONLINEAR PROCESSES IN ABSORPTION, DISTRIBUTION, METABOLISM, AND ELIMINATION
Most commonly, nonlinearity in pharmacokinetics arises when therapeutic drug concentrations are high enough to saturate an enzyme or another protein involved in ADME. Consequently, nonlinear pharmacokinetics has the potential to arise whenever a protein is involved in ADME. Table 15.1 lists processes in ADME that involve proteins and which as a result have the potential to become saturated. The outcome expected for the saturation is also shown.
Some clinical examples of the saturation of the processes listed in Table 15.1 include reduced absorption of riboflavin at higher doses as a result of a saturation of its uptake transporter in the gastrointestinal membrane; reduced presystemic extraction of propranolol with higher doses, resulting in higher bioavailbility; dose-dependent protein binding of valproic acid; saturable tissue uptake of methotrexate; and saturation of the metabolism of phenytoin and ethanol at higher doses.
TABLE 15.1 Examples of Processes in ADME That Can Become Saturated
| Process | Typical Outcome of Saturation |
| Absorption | |
| Uptake transporters | Less absorption at higher doses |
| Efflux transporters | More absorption at higher doses |
| Enzymes in enterocytes | More absorption at higher doses |
| Hepatic first-pass enzymes | More absorption at higher |
| Distribution | |
| Plasma proteins | Higher free fractions at higher doses |
| Uptake transporters | Lower tissue concentrations at higher doses |
| Efflux transporters | Higher tissues concentrations at higher doses |
| Metabolism | |
| Hepatic enzymes | Lower clearance, slower elimination at higher doses |
| Excretion | |
| Uptake transporters | Lower clearance, slower elimination at higher doses |
| Efflux transporters | Lower clearance, slower elimination at higher doses |
Nonlinearity can also arise through some other mechanisms. For example, drugs such as carbamazepine that induce their own metabolism will display nonlinear pharmacokinetics until the induction process stabilizes, which generally takes about 10 to 14 days. The bioavailability of drugs that are poorly soluble in gastrointestinal fluid may decrease with dose or changes in pH. For example, the dissolution and bioavailability of ketoconazole change with changes in gastric pH. Nonlinear pharmacokinetics can also arise from pharmacological or toxicological actions of a drug. For example, theophylline induces concentration-dependent diuresis, which results in increased renal excretion with dose. Interestingly, theophylline’s overall pharmacokinetics tend to be linear because it also displays saturable metabolism, and the increase in renal clearance and decrease in hepatic clearance that occur with higher plasma concentrations tend to offset each other. The clearance of aminoglycosides can decrease with dose as a result of dose-dependent renal toxicity.
The outcome of nonlinearity will depend on the specific process involved. For example, saturable absorption resulting from saturable uptake transporters or poor dissolution will result in larger doses, producing lower plasma concentrations than those predicted by linear pharmacokinetics. Conversely, with increasing doses, saturation of the other absorption processes listed in Table 15.1 will result in plasma concentrations that are higher than those expected from linear processes. Nonlinear or capacity-limited metabolism is the most common example of nonlinearity observed clinically, and the remainder of the chapter is devoted to this topic.
15.3 PHARMACOKINETICS OF CAPACITY-LIMITED METABOLISM
The most clinically important type of nonlinear pharmacokinetics is saturable metabolism, which is also referred to as capacity-limited metabolism, biotransformation, or elimination. It arises when therapeutic concentrations of a drug partially or fully saturate an enzyme(s) that plays an important role in elimination of the drug. To understand the factors that control nonlinearity and explain why only a fraction of the drugs that undergo metabolism are subject to nonlinearity, it is necessary to review the kinetics of enzymatic metabolism. This material, which was covered in Chapter 5, is reviewed here.
15.3.1 Kinetics of Enzymatic Processes
The kinetics of an enzymatic process such as metabolism often follow Michaelis–Menten kinetics, which provides the following relationship between the rate of the process (V) and the plasma concentration (Cp):
(15.6) 
where Vmax is the maximum rate of metabolism that is observed when all the enzyme is saturated with the substrate drug, and Km is the Michaelis–Menten constant, which is a dissociation constant (as affinity for the enzyme increases, Km decreases). The units of V are amount per unit time, and the units of Km are concentration.
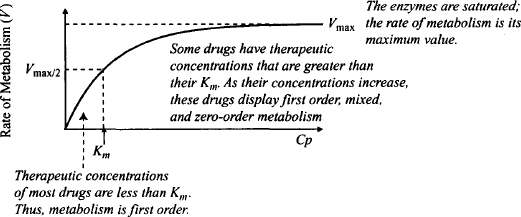
Accordingly, the typical hyperbolic relationship of a capacity-limited system is observed between the rate of metabolism and the plasma concentration (Figure 15.3). Also, as was shown in Chapter 5, the concentration that is associated with half the maximum rate is equal to the drug’s Km value. Two limiting situations exist for the rate of metabolism:
FIGURE 15.3 Michaelis–Menten kinetics. At low drug concentrations, excess enzyme is available to metabolize the drug, and the rate can increase in direct proportion to increases in concentration (first order). As the drug concentration increases, some saturation is seen and the rate of metabolism can no longer keep up with increases in the drug concentration. At high drug concentrations, the enzyme is completely saturated and the maximum rate of metabolism is observed. At this point, increases in drug concentration are not associated with any further increases in the rate of metabolism.
 Km), there is an excess amount of enzyme present. Under these circumstances, as the concentration of the drug increases, the rate can increase proportionally: The rate is proportional to the plasma concentration, and metabolism is an apparent first-order process (Figure 15.3). Mathematically, Cp
  Km, Km + Cp ≈ Km, and
 Km, Km + Cp ≈ Cp, and
It is very important to note that the therapeutic concentrations of most drugs are well below their Km values. As a result, the enzymatic metabolism of the majority of drugs used in clinical practice follow apparent first-order kinetics, and their pharmacokinetics are linear. A small number of drugs, however, have therapeutic plasma concentrations that approach or exceed their Km value. For example, the average Km value for phenytoin is 4 mg/L, which compares to a therapeutic range of 10 to 20 mg/L.
15.3.2 Plasma Concentration–Time Profile
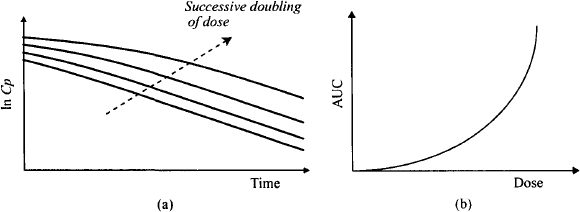
Figure 15.4 shows the fall in the plasma concentration with time on a semilogarithmic scale after a series of intravenous doses of a drug that displays saturable metabolism (Figure 15.4a). The different plots represent a successive doubling of the dose. It can be seen that the profile from the smallest dose resembles that observed with linear pharmacokinetics: a typical straight-line relationship between ln Cp and time. But notice that with the larger doses, the initial fall in the plasma concentration is much less steep than that found with linear pharmacokinetics. At higher concentrations the initial fall takes on a concave profile. This is the result of a saturation of the enzymes at higher concentrations and the inability of the rate of metabolism to increase in proportion to the increase in concentrations. The rate is less than it would be for a first-order process. As a result, the AUC increases disproportionately with dose (Figure 15.4b). The initial plasma concentration (Cp0) for drugs that display saturable metabolism is proportional to dose, as it is dependent on the drug’s volume of distribution and is independent of its elimination characteristics.
FIGURE 15.4 Impact of nonlinear elimination on the plasma concentration–time profile after single doses. Graph (a) is a semilogarithmic plot of plasma concentration against time after a successive doubling of an intravenous dose. After large doses, the initial fall in the plasma concentration with time is less steep than with linear pharmacokinetics. Graph (b) shows that the area under the plasma concentration time curve (AUC) increases with dose for drugs that display saturable elimination.
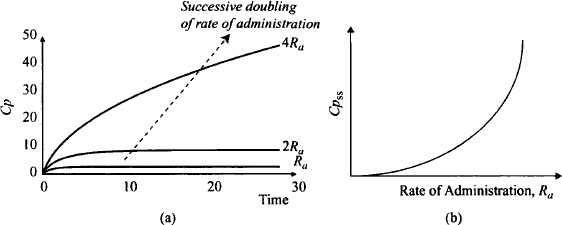
The typical plasma concentration profile seen with the extended administration of drugs that display nonlinear metabolism is shown in Figure 15.5. The profile shows the effect of a successive doubling of the rate of drug administration. Notice that the first doubling produces about a three- to fourfold increase in the steady-state plasma concentration. A further doubling results in an over eightfold increase in the plasma concentration. Figure 15.5b shows the relationship between the steady-state plasma concentration and a wide range of rates of drug administration. It can be seen that increases in the rate result in disproportionate increases in the steady-state plasma concentrations. At high rates the concentration tends toward infinity.
FIGURE 15.5 Impact of nonlinear elimination on the pharmacokinetics of chromic drug administration. Graph (a) shows the plasma concentration–time profile after a successive doubling of the rate of administration from an infusion. After the first doubling, the plasma concentration at any time increases by slightly more than double. After the second doubling, the plasma concentration at any time into therapy increases severalfold. Steady state has not been achieved over the observation period but the steady-state plasma concentration will be over eightfold greater than that from the previous dose. Graph (b) shows that the steady-state plasma concentration (Cpss) increases disproportionally with the rate of drug administration. At a high rate of administration, the Cpss tends toward infinity.
15.4 PHENYTOIN
Stay updated, free articles. Join our Telegram channel

Full access? Get Clinical Tree


