The pharmacokinetics of oral drug administration was introduced in Chapter 9, where it was seen that the pharmacokinetic model contains two absorption parameters: F, the fraction of the dose that reaches the systemic circulation and ka, the first-order rate constant for absorption. It follows that a focus of the discussion on the pharmacokinetics of multiple oral doses should be on how these two special absorption parameters influence the plasma concentration–time profile.
The clearest way to demonstrate the influence of these parameters is, first, through a consideration of the equations for multiple oral doses, and then through computer simulations. In this chapter we concentrate on steady-state concentrations. It is not uncommon for bioavailability and bioequivalence studies to be carried out at steady state. Thus, an additional and related topic discussed in this chapter is the justification and validation for conducting bioavailability and bioequivalence studies at steady state.
14.2 STEADY-STATE EQUATIONS
As discussed in Chapter 13, steady-state equations for multiple dosing therapies can be obtained as follows:

and
(14.1) 
where kn is a rate constant in an exponential expression in the single-dose equation.
In the equation for single oral doses,
(14.2) 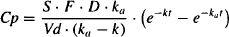
it can be seen that it contains two exponential functions. To derive the steady-state equations for multiple doses, each exponential function has to be multiplied by its own accumulation ratio. The steady-state plasma concentration after multiple oral doses may be expressed
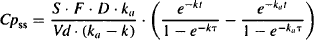
where t is the time since the last dose and τ is the dosing interval or time between doses.
The typical profile observed after multiple oral doses and the one predicted by equation (14.3) is shown in Figure 14.1, where the typical accumulation of drug up to steady state is present, as is fluctuation. We also see that the peak plasma concentration (Cmax) does not occur at time zero (i.e., when a dose is given) but later. In common with the symbols used for single oral doses, the time of the peak plasma concentration is Tmax. After single doses, these parameters are important measures of the rate and extent of drug absorption, and as a result they are used to assess bioavailability. The determinants of Cmax and Tmax at steady state are addressed next.
14.2.1 Time to Peak Steady-State Plasma Concentration
At the time of a peak during multiple oral doses, the rate of absorption is momentarily equal to the rate of elimination, and the rate of change of Cp with time is zero. The expression for the time of the maximum steady-state plasma concentration can be obtained by differentiating equation (14.3) and setting dCp/dt = 0. Upon rearrangement, the following equation is obtained (1):
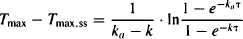
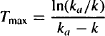
where Tmax is the time of the peak plasma concentration after a single dose and Tmax,ss is the time of the peak during a steady-state dosing interval. Recall from Chapter 9 that
Several important points can be made from a consideration of equation (14.4):
The determinants of Tmax,ss are discussed further in Section 14.2.5.
14.2.2 Maximum Steady-State Plasma Concentration
The peak plasma concentration at steady state occurs when the time after the dose is equal to Tmax,ss. Thus, the expression for the peak plasma concentration at steady state is obtained by substituting the expression for Tmax,ss [equation (14.4)] into the equation for the plasma concentration during a steady-state dosing interval [equation (14.3)] (2).
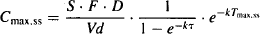
A consideration of equation (14.5) shows that in common with the peak after a single dose, the peak at steady state is directly proportional to bioavailability (F), and through its dependence on Tmax,ss is also dependent on the rate of drug absorption. If F increases, the value of the peak plasma concentration will increase, and vice versa. If the absorption rate constant increases, Tmax,ss will decrease and Cmax,ss will increase. These relationships are discussed further in Section 14.2.5.
14.2.3 Minimum Steady-State Plasma Concentration
Assuming that ka > k at later times during a dosing interval, e−kat in equation (14.3) will tend to zero. Additionally, the trough concentration occurs when t = τ. Thus, equation (14.3) will simplify to
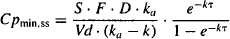
From equation (14.6) it can be seen that the trough at steady state is equal to the plasma concentration at the same time after a single dose multiplied by the accumulation ratio.
14.2.4 Average Steady-State Plasma Concentration
The average steady-state plasma concentration is equal to the area under the curve during a steady-state dosing interval divided by τ:
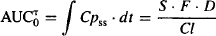
Note that the area under the curve during a steady-state dosing interval is exactly the same as the area under the plasma concentration time curve from zero to infinity after a single dose (Figure 14.2). Additionally, equation (14.7) shows that for a given drug (Cl
Stay updated, free articles. Join our Telegram channel

Full access? Get Clinical Tree


