and Jordan Smoller2
(1)
Department of Epidemiology, Albert Einstein College of Medicine, Bronx, NY, USA
(2)
Department of Psychiatry and Center for Human Genetic Research, Massachusetts General Hospital, Boston, MA, USA
The life which is unexamined is not worth living.
Plato, Dialogues
428–348 B.C.
I love long life better than figs.
Shakespeare
(Anthony and Cleopatra)
The two quotes above illustrate how differently people view the quality of their lives and how difficult it is to pin down this concept.
A welcome development in health-care research is the increasing attention being paid to the quality of life issues in epidemiological studies and when evaluating competing therapies. A key aspect is the measurement of the effects of symptoms of illness, as well as of the treatment of these symptoms, on well-being, which is a subjective and relative state. Therefore, it is quite appropriate that measurement of improvement or deterioration in quality of life be based on the patient’s perception and self-report. A person who has had severe and disabling angina may perceive improved well-being as a result of treatment if he can walk without pain, whereas a young ski enthusiast may experience marked deterioration if he is unable to ski. For that reason, in studies on this issue, the individual often serves as his or her own control, and the measures used are change scores in some quality of life dimensions from before to after treatment. However, it remains important to have an appropriate control group to compare the changes, because people show changes in these dimensions over time that may be unrelated to the particular treatment being evaluated.
The principles and techniques described in this book apply to research in any health-related field. However, there are certain analytic methods that are particularly appropriate to investigations concerning psychological or emotional states. The primary principle is that if it is to be scientific research, it must adhere to scientific standards, which means that first of all, the variables of interest must be quantified. Fortunately, almost any concept related to the health fields can be quantified if one is ingenious enough.
7.1 Scale Construction
The scales used to measure quality of life dimensions reflect the degree of distress with particular symptoms or psychological states as well as degree of satisfaction and general well-being. There are many such scales available, which have been well constructed and tested on different populations. Sometimes, however, investigators find it necessary to construct their own scales to fit particular circumstances.
There are three characteristics of such scales that are important: reliability, validity, and responsiveness.
7.2 Reliability
Reliability is the ability to measure something the same way twice. It rests on the assumption that a person’s score on a scale or a test is composed of his true (but unknown) score plus some component that is subject to variation because of error (by which we mean random variability).
Reliability of a scale is related to its repeatability, or how close the responses are on two administrations of the scale. To measure how close they are, we can calculate the correlation coefficient between the two administrations of the scale to the same subjects. But often we can’t give the same scale to our patients twice under exactly the same circumstances, since in reality a patient responding twice to the same questions would respond differently either because something has intervened between the two occasions or because he remembered the previous responses or just because there is inherent variability in how one feels. The next best thing would be to give two equivalent scales to the same group, but that has its problems as well. How do we know the two scales are really equivalent?
Fortunately, there are various measures of what we call “internal consistency” that give us the reliability of a scale or test. The most common one is called Cronbach’s alpha. There are many software packages for personal computers that readily calculate Cronbach’s alpha, including SPSS, SAS, STATA, and many others. Thus, it is not necessary to calculate it yourself, but the following explanation indicates what it really means and how to interpret it.
![$$ \alpha =\left[\frac{k}{k-1}\right]\times \left[\frac{variance\; of\; total\; scale- sum\; of\; variances\; of\; individual\; items}{variance\; of\; total\; scale}\right] $$](/wp-content/uploads/2016/11/A270404_4_En_7_Chapter_Equa.gif)
Variance is the standard deviation squared. Section 3.4 shows how to calculate it. (When we talk about variance here, we actually mean the population variance, but what we really use are estimates of the population variance that we get from the particular sample of people on whom we develop the test or scale, since obviously we can’t measure the entire population.)
This formula is really a measure of how homogeneous the scale items are, that is, to what extent they measure the same thing. If you have a scale that is composed of several different subscales, each measuring different things, then the Cronbach’s alpha should be used for each of the subscales separately rather than the whole scale. Cronbach’s alpha gives the lower bound for reliability. If it is high for the whole scale, then you know the scale is reliable (repeatable, highly correlated with the “true,” but unknown, scores). If you get a low alpha for the whole scale, then either it is unreliable or it measures several different things.
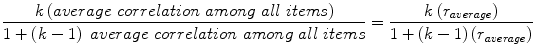
Reliability can also be looked upon as a measure of correlation, and in fact it does reflect the average correlation among items of a scale, taking into account the total number of items. Another way to get reliability is from the Spearman–Brown formula, which is