Microarrays
Mark Watson
I. INTRODUCTION. Nucleic acid microarrays are an ordered arrangement of DNA molecules (probes or features) on a solid surface. A sample of DNA or RNA derived from cells or tissue (target) is then hybridized to the array to quantify the level of nucleic acid corresponding to each probe. Microarrays can be utilized for a number of different experimental and clinical applications (Fig. 61.1).
A. Array comparative genomic hybridization (aCGH). This microarray-based assay is used to compare genome copy numbers between biospecimens. Often, a patient tumor DNA sample is directly compared with a corresponding nonmalignant or germline DNA sample from the same individual to assess quantitative changes in a tumor genome. This approach is routinely used in clinical molecular diagnostics and provides a higher-resolution complement to more traditional cytogenetic and fluorescent in situ hybridization (FISH) assays.
B. Genotyping. Microarray technology can be used to assay single nucleotide polymorphism (SNP) genotypes or copy number variation (CNV) across 1 to 2 million genomic loci in a single DNA sample. This approach is useful for identifying correlations between phenotype and genotype in familial linkage or genome-wide association (population-based) studies and can be used clinically to identify CNV polymorphisms associated with inherited or constitutional traits.
C. Sequencing. Sequencing by hybridization utilizes microarray technology to determine the complete nucleotide sequence of a DNA target, usually 100 to 300 kilobases in length. Unlike conventional sequencing chemistry using capillary gel electrophoresis, the target sequence need not be a contiguous stretch of DNA, but may consist of a set of regions of diagnostic relevance distributed throughout the genome.
D. Genome tiling. Very high density microarray designs contain nucleotide probes with 10 to 35 nucleotides spaced across the entire genome. These high-resolution probe arrays allow for identification of methylation and DNA-protein binding patterns at the single nucleotide level.
E. Gene expression. By hybridizing cellular RNA to microarrays with probes directed to mRNA or microRNA (miRNA) targets, it is possible to perform qualitative (i.e., detection of alternative splicing) and quantitative gene expression analysis simultaneously on 30,000 to 50,000 genes from a single-RNA specimen. Measurement of transcript abundance (i.e., gene expression profiling) has been the most common use of microarray technology in investigative and diagnostic pathology to date.
II. MICROARRAY TECHNOLOGY. Nucleic acids microarrays are fabricated using several different technologies and probe types, depending upon the intended application (Fig. 61.1).
A. Bacterial artificial chromosome (BAC) arrays. BAC-cloned DNA is deposited onto a solid surface (usually a glass microscope slide) by a robotic, mechanical spotting device. Each BAC clone represents a large stretch of genomic DNA from a specific chromosomal region, usually several hundred kilobases in length. BAC arrays have been particularly useful in assessing genome-wide DNA copy number changes in tumor specimens, and when employed in a CGH have enhanced the resolution of traditional cytogenetic studies. Validated BAC arrays are used in a number of clinical laboratories, although compared with newer, oligonucleotide-based platforms, they suffer from poor resolution and require a sufficient laboratory infrastructure to grow and maintain BAC libraries which are used to generate the DNA probes. BAC arrays have been largely supplanted by oligonucleotide arrays for these reasons.
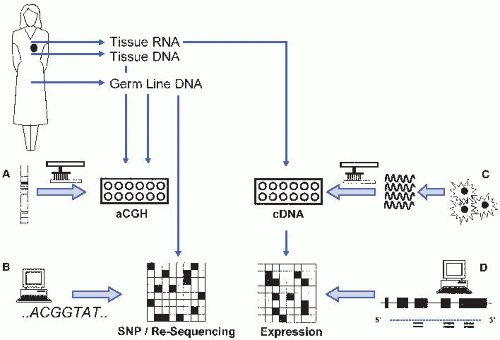
Figure 61.1 Microarray applications and technology. Microarray technology can be used for many different applications, depending upon the nucleic acid composition of the array (probes) and the test material (target) that is hybridized to it. A: For aCGH assays, fragments of genomic DNA (i.e., BACs) are spotted as probes onto the microarray surface using robotics. Genomic DNA from the patient’s tissue and germ line are then cohybridized to the array to identify regions of chromosomal gain or loss. B: Alternatively, genomic DNA sequence can be used to computationally design oligonucleotide probes that detect specific alterations in DNA samples (either germ line or tissue) for either SNP genotyping or DNA resequencing studies. C: cDNA clones generated from cellular RNA also can be spotted as probes onto the microarray and patient tissue RNA subsequently hybridized to quantify relative mRNA transcript abundance for gene expression profiling experiments. D: Similarly, oligonucleotides can be designed based upon known gene exon structure and spotted on the array surface to perform quantitative or qualitative assessment of mRNA or miRNA expression.
B. cDNA microarrays. Some of the earliest microarray designs utilized cDNA probes. Messenger RNA (mRNA) from a defined tissue or cell source is converted into a double stranded cDNA clone library. Plasmid DNA from each clone is then spotted onto the microarray surface. Genome sequence information is not necessarily required for microarray design, a particular advantage for studying the few remaining experimental organisms where genome sequence information is not available. However, because cDNA probes correspond to relatively long stretches of transcribed mRNA, cross-hybridization and lack of specificity can often limit the accuracy of cDNA microarray results. Like BAC arrays, the effort and infrastructure necessary to store, grow, purify, monitor quality control, and track individual cDNA clones are considerable and not easily standardized. This last constraint has and will continue to limit the use of cDNA microarrays as clinical diagnostic tools.
C. Oligonucleotide microarrays. The availability of the completely sequenced and annotated human genome, coupled with improved synthesis chemistries, has shifted the fabrication of nucleic acid microarrays toward the use of synthetic oligonucleotide probes, usually 60 to 75 nucleotides in length. Probe sequences may be customized for specific genes, gene transcripts, or gene transcript segments using defined nucleic acid sequences. Sophisticated bioinformatics programs can select optimized oligonucleotide sequences for any gene or transcript of interest while minimizing cross reactivity with other sequences, and at the same time standardizing hybridization properties such as melting temperature and G/C sequence content. This level of customization has provided a new level of standardization and flexibility to the design of sequence content on nucleic acid microarrays that is aptly suited for clinical diagnostic assays.
D. In situ synthesized microarrays. Another strategy for microarray design involves simultaneously synthesizing specific oligonucleotide probes in situ using combinatorial photochemistry. Affymetrix GeneChip® microarrays use a series of micron-scale “masks” to direct light to specific locations on the microarray surface. Photoreactive nucleotides (A,C,G,T) are sequentially passed over the array surface in the presence of each mask. Depending upon the mask pattern, a specific nucleotide is added to the growing chain of oligonucleotides at a specific position. In this combinatorial method, the use of 25 different masks sets (A, C, G, T) in 100 sequential nucleotide addition steps can result in 425 (1 × 10¹⁵) different sequences that are simultaneously created on the array surface.
Alternate methods use a “maskless” approach for in situ probe synthesis in which a sheet composed of micron-scale electronic mirror is programmed to direct light to specific areas of the microarray during sequential steps of photochemical oligonucleotide synthesis. The method is similar to GeneChip® fabrication, but does not rely on the creation of fixed lithographic masks and therefore allows for flexible design on a single array basis.
E. Bead arrays. An alternate approach to traditional microarray design involves the use of a beaded microarray. In this approach, micron-sized beads, each containing a unique oligonucleotide gene sequence in tandem with a unique nucleotide address sequence, are allowed to randomly assemble onto a solid surface. By repeated interrogation of each bead address sequence, the identity of each bead at each position is deduced. The “decoded” array can then be used for its intended hybridization assay.
III. MICROARRAY ASSAYS. Microarray assays are complex (e-Fig. 61.1)*, both because of the amount of data generated and the exacting specimen requirements that are necessary to produce high quality data.
A. Study design. To date, most microarray-based studies have been designed as biomarker discovery experiments, with the aim of defining a panel of multiple biomarkers that can then be transitioned into a more conventional clinical assay. Microarray experiments generally fall into several classes.
1. Class discovery. In such studies, experimental specimens are classified based solely upon their microarray data values, and the results of the classification are reviewed to identify new, previously unappreciated clinical or pathologic classifications. Perhaps the most elegant illustration of this approach has been the reclassification of breast adenocarcinoma based upon microarray-generated gene expression profiles (Clin Cancer Res. 2005;11:5678). Similar studies have effectively identified other molecular subtypes of tumors as well (J Clin Oncol. 2006;24:5079; N Engl J Med. 2003;348:1777).
2. Class distinction. This type of study is designed to identify novel predictive biomarkers, patterns of gene expression, CNVs, or sequence alterations that demonstrate a correlation to an already known parameter such as clinical outcome or treatment response (J Clin Oncol. 2009;27:1160).
3. Single sample classification. Ultimately, to achieve clinical utility, it is necessary to create a robust molecular signature that can be prospectively applied to individual patient specimens to accurately predict clinical phenotype. Typically, a specific subset of probes on a microarray (sometimes a customized array designed for a specific diagnostic purpose) is examined and a weighted discriminate index is calculated. The resulting index provides a probability measure that a given specimen falls into a specific, predefined diagnostic category. Studies which independently validate a previously identified signature are relatively rare to date, but are obviously a critical step in transitioning any assay into routine clinical use (Clin Cancer Res. 2010;16:5222).
B. Statistical considerations. In principle, microarray data analysis is no different than evaluating whether a single biomarker demonstrates a statistically significant difference between defined sample classes using traditional statistics. By definition, a traditional significance threshold of p = 0.05 allows for a 5% false-positive (false discovery) rate. Therefore, when analyzing 50,000 to 2,000,000 independent biomarker values obtained by a microarray assay, as many as 100,000 values will appear to be “significant” by chance alone. To contend with this problem of multiple testing, several methods have been applied to calculate a true significance threshold when analyzing thousands of variables in relatively few numbers of samples (Genome Biol. 2003;4:210). Although these approaches minimize false-positive results for a given sample set, they can in no way substitute for data validation using multiple, independent sets of samples across different technology platforms and laboratories.
C. Specimen requirements. Because of the inherent complexity of microarray-based assays, specimen quality assurance is essential.
1. Specimen collection. Careful consideration must be given to specimen collection for microarray studies. While DNA and DNA methylation patterns are relatively stable and probably less sensitive to environmental conditions, the same is not true for mRNA and miRNA when targeted in microarray-based gene expression profile assays. Global changes in gene expression can occur in tissue biospecimens as a result of tissue warm ischemia time (J Clin Oncol. 2006;24:3763), creating artificial differences in gene expression patterns seen between specimens based on collection procedures rather than important
clinical differences. For peripheral blood and bone marrow specimens, the method in which a specimen is collected and processed can also influence gene expression signatures (Physiol Genomics 2004;19:247). Finally, most tissue specimens are inherently heterogeneous collections of many cell types. Variable cellular composition between tissue specimens may lead to differences in genomic and transcriptional profiles generated from microarray assays. For example, two prostate tumor samples, one of which contains 5% neoplastic cellularity and a second which contains 70% neoplastic cellularity, may demonstrate two different gene expression signatures based simply on the content of neoplastic epithelial cells present in the tissue. Similarly, measurement of a tumor-associated change in DNA copy number will vary considerably depending upon the content of neoplastic epithelial cells. For this reason, many investigators use techniques such as laser microdissection to isolate more homogeneous cell populations for both gene expression and DNA copy number microarray analysis (see Chap. 62).
Stay updated, free articles. Join our Telegram channel

Full access? Get Clinical Tree


