Metabolic Bone Disease: Part I


Metabolic Bone Disease: Part I


Tissue Pathologic Features of Metabolic Bone Disease

The term metabolic bone disease encompasses a group of illnesses that are, in some respects, unrelated, semantically confusing, both rare and extremely common, and, in general, poorly understood. Theoretically, any disease affecting collagen or mineral deposition could adversely affect bone and therefore constitute disease involving bone metabolism. Practically speaking, our attention is focused on osteoporosis, osteomalacia, Paget’s disease, and hyperparathyroidism—osteoporosis for the simple magnitude of the problem ($18 billion spent annually to treat more than 1.5 million fractures) (1); Paget’s disease, because of the complications of arthritis, fracture, and sarcoma; and osteomalacia and hyperparathyroidism because they are, in general, curable.

The complexity of this broad range of disorders is perhaps best exemplified by considering the disease entity known as osteomalacia, the term osteomalacia including a wide range of disorders seen in association with deficiencies of vitamin D, phosphorus, or the enzyme alkaline phosphatase. It may also be seen with metal poisoning, such as with aluminum, and in association with certain bizarre bone and soft tissue tumors, so-called oncogenic osteomalacia. Although the classic roentgenographic findings are symmetrical pseudofractures, they are usually not readily detectable. Routine radiographs may reveal a normodense, osteopenic, or even radiodense appearance. Symptoms are protean and may, in fact, be entirely extraskeletal in description by the patient. Is our use of one term for all this too simplistic? Although tetracycline labeling has allowed a more sophisticated morphologic definition, experts vary in their diagnostic criteria for this entity. An increase in osteoid seam thickness, the presence of at least five birefringent lamellar lines in the osteoid seams at any one point or in a significant proportion of osteoid seams, surface osteoid greater than 25 percent, a decrease in the distance between two spaced tetracycline labels (i.e., decreased calcification rate), a decrease in the number of osteoid seams taking up tetracycline, and prolonged mineralization lag time have all been offered as diagnostic criteria. To date, these specific types of morphologic changes have not been correlated with particular etiologic causes of osteomalacia, offering exciting possibilities for future investigatory work.

Selective use of roentgenograms and careful analysis of routine serum and urine chemistries may lead to a diagnosis. However, the search for sensitive and specific serum markers for bone formation and resorption continues. Paget’s disease, for example, is suspected by radiography and elevated alkaline phosphatase. Classic osteomalacia is usually suspected when multiple, often symmetric fractures are seen in the setting of a low vitamin D level and/or a low calcium or low phosphorus level with an elevated alkaline phosphatase level. However, subtle cases and absolute certainty may require tissue examination of the bone. Although routine evaluation of some anemias may require a bone marrow biopsy, there is reluctance to perform the same tissue biopsy for the diagnosis of metabolic bone disease. In particular, a bone biopsy may be necessary to verify clinical suspicion of osteomalacia and to evaluate an atypical radiograph in Paget’s disease for sarcoma. Studies have shown that it is the only reliable way to evaluate the relative presence of osteomalacia, osteoporosis, secondary hyperparathyroidism, hemosiderosis, and paratrabecular fibrosis in the complicated picture of renal-related bone disease. In clinical investigation, the bone biopsy has become an important diagnostic procedure in the
evaluation of idiopathic (postmenopausal) osteoporosis because it allows precise quantitative and qualitative evaluation of the bone and marrow in a disorder that is usually accompanied by inexact serum and urine analysis.


Bone Biopsy Protocol for Evaluating Osteoporosis and Osteomalacia

Pathologists may be asked to assist in the evaluation of unusual cases of osteoporosis and osteomalacia through the bone biopsy (2). A thorough investigation requires several steps: first, an appropriate and adequate biopsy; second, use of undecalcified sectioning; third, quantitation vis-à-vis histomorphometry; and, in some instances such as the diagnosis of osteomalacia, labeling and evaluation of tetracycline labels (Fig. 3.1). The use of a bone biopsy is prompted by the fact that roughly 40 percent of skeletal mass must be lost before routine x-rays demonstrate osteoporosis unequivocally, in many instances osteomalacia requires biopsy confirmation, and neoplastic marrow disorders may mimic primary skeletal abnormalities.

Because of the systemic nature of certain metabolic bone disease (osteoporosis, osteomalacia, and hyperparathyroidism), most cancellous bone sites would be theoretically acceptable for biopsy. However, fracture sites, except for suspicion of metastases, should be avoided because ensuing remodeling changes may obscure the diagnosis. The iliac bone has received considerable attention for several reasons. It is a safe site with few complications reported, it provides bone and bone marrow for analysis, and data have been generated based on histomorphometric analyses at this site. A thorough qualitative and quantitative evaluation of a metabolic bone disease requires a biopsy sample larger than that used for routine hematologic analyses. To evaluate osteoclastic resorptive activity adequately in hyperparathyroidism, and the calcification rate in mineralization defects, the larger 5-mm core biopsies are necessary (3,4).

Therefore, a biopsy resulting in a bone core with at least a 5-mm diameter is recommended. Such large cores can be achieved using a trephine or trocar. Although motorized instruments are commercially available, a manually operated instrument is preferred to avoid excessive bone dust and shattering artifact. Several of these instruments have been described and are available commercially (4).

The preferred site is one- and one-half inch inferior and posterior to the anterior superior iliac spine. The iliac crest is to be avoided because of poor cortical bone demarcation and variation in bony architecture. It tends to fan out at the crest. In general, an adequate specimen consists of a full-thickness biopsy, cortex to cortex, with cortices roughly parallel.


Undecalcified Sectioning

Undecalcified bone sections are required for several reasons. Most importantly, standard chelating and acidic decalcification techniques used routinely in hospital laboratories to process bone tissue eliminate the osteoid-mineralized bone distinction, which is critical in diagnosing osteomalacia and high-turnover osteoporosis states. Moreover, decalcification techniques usually disrupt the bone lining cell activity by cleaving this zone, eliminating the ability to analyze osteoblast and osteoclast numbers and the bone surface relationship; the latter is important in quantifying degrees of bone resorption and formation. In addition, the mineralization front, the basophilic line separating osteoid and mineralized bone and the site of intense enzyme and cation activity, may be obscured. Tetracycline (in antibiotic administration), iron (in certain osteomalacias and thalassemics), aluminum (in dialysis osteomalacia), and fluoride (in treated osteoporosis) are examples of some clinically relevant substances that may exert local metabolic influence at this site.

The biopsy tissue is immediately fixed in 10 percent buffered neutral formalin. If a preceding period of double labeling of bone with tetracycline has occurred, 70 percent ethanol is recommended to preserve the label.

Undecalcified sectioning requires plastic embedding. This can be accomplished with either glycol or methyl methacrylate. Glycol methacrylate is more rapid, but results in more bone-cracking artifact. Both plastics result in excellent marrow morphology. Either medium requires dehydration prior to infiltration.

The recommended section thickness is 5 to 10 µm. Although the clinically important information can be derived from either glycol methacrylate- or methyl methacrylate-embedded sections cut with glass knives, and microtomes such as a DuPont Sorvall JB4 microtome, histomorphometry for research purposes is best accomplished with methyl methacrylate-embedded sections, which are cut with a sledge microtome such as the Jung model K (Jung Instruments, Heidelberg, Germany).


Histomorphometry

The basis for diagnosis and recommending further clinical and laboratory evaluation requires precise evaluation of the sectioned tissue. In particular, the clinician needs to know the amount of mineralized bone present (to quantitate the degree of osteoporosis) and the relative amount of osteoid (to diagnose osteomalacia). In addition, the quantification of osteoblast and osteoclast activity is helpful in defining particular conditions such as endocrinopathies and, in particular, subclinical hyperparathyroidism. Table 3.1 (2,5,6,7,8,9,10) gives a practical grouping of distinguishing features and lists appropriate reference values. The “rule of two” will help the practicing pathologist involved with these problems (Table 3.2). For example, consider two parameters: osteoid and trabecular bone measurements.


Osteoid

Osteoid is that portion of bone that is unmineralized and consists mostly of type I collagen. An accurate assessment requires the use of a special stain, such as the von Kossa stain, which stains the mineralized component of bone black and the osteoid pink. We know from investigatory work that, under normal conditions, roughly 20 percent of trabecular bone surfaces should be covered by osteoid, less than 2 percent of the bone should be made up of osteoid, the osteoid thickness should not exceed 12 µm, and only a small percentage of osteoid surfaces should be covered by plump osteoblasts (Fig. 3.2). When there are deviations from these parameters, a disorder can be suspected. Obviously, precision in measurement requires histomorphometry. In osteomalacia, all the aforementioned parameters are dramatically increased, whereas in endocrinopathies, considerable variation may be shown. Mild to moderate elevations in osteoid parameters have been termed hyperosteoidosis, but its specificity and clinical relevance require further assessment by prior tetracycline labeling to ascertain whether the osteoid


accumulation is due to lack of mineralization (osteomalacia) or increased formation by active osteoblasts (hyperparathyroidism).


FIGURE 3.1. Protocol for the evaluation of osteoporosis and osteomalacia.


TABLE 3.1 Parameters and Reference Values in the Histomorphometric Analysis of Iliac Bone


Parameter


Definition


Literature Reference Values (±SD)


References


Indices of trabecular bone mass


Trabecular bone volume (%)


The percentage of the medullary cavity occupied by mineralized and osteoid trabecular bone


22.5 ± 3.5%


Melsen et al. (9)


Trabecular width (µm)


The mean width of all bone trabeculae


213 ± 65 µm


Vigorita et al. (4)


Indices of cortical bone mass


Cortical bone volume (%)


The percentage of the bone biopsy covered by mineralized and osteoid cortical bone


None


Mean cortical width (µm)


The mean thickness of both cortices calculated as the area of the biopsy covered by cortical bone divided by the mean width of the biopsy


909 ± 98 µm


Melsen et al. (9)


Cortical porosity (%)


The percentage of cortical bone volume occupied by canals (haversian and Volkmann)


6.3 ± 0.6%


Melsen et al. (9)


Indices of osteoid tissue


Trabecular osteoid surface (%)


The percentage of trabecular bone surface occupied by osteoid


19.3 ± 3.0%


Melsen et al. (9)


Osteoid seam width (µm)


The trabecular osteoid area divided by the millimeters of trabecular bone surface covered by osteoid


9.5 ± 0.6 µm


Melsen et al. (9)


Trabecular osteoid volume (%)


The percentage of osteoid and mineralized trabecular bone consisting of osteoid


1.9 ± 0.4%


Melsen et al. (9)


Index of osteoblast activity


Trabecular osteoblastic osteoid (%)


The percentage of trabecular bone surfaces covered by osteoid that is lined by typical cuboidal osteoblasts


1.3 ± 0.5%


Whyte et al. (10)


Indices of resorption


Trabecular resorptive surface (%)


The percentage of trabecular bone surfaces showing a scalloped change, including those with and without osteoclasts


5.1 ± 0.6%


Melsen et al. (9)


Osteoclastic resorptive surface (%)


The percentage of trabecular bone surface lined by osteoclasts


0.13 ± 0.06%


Whyte et al. (10)


Osteoclasts/mm2 medullary space


The number of osteoclasts per medullary space area


0.11 ± 0.4a


Whyte et al. (10)


Osteoclasts/mm trabecular bone perimeter


The number of osteoclasts millimeter of trabecular bone perimeter


0.03 ± 0.1a


Whyte et al. (10)


Osteoclasts/mm2 trabecular area


The number of osteoclasts per mineralized and osteoid trabecular bone area


0.20 ± 0.14


Korkor et al. (6)


Indices of bone formation (tetracycline-derived)


Percentage trabecular bone surface labeled


The percentage of trabecular bone surface labeled by both single and double tetracycline labels


14.5 ± 1.5%


Melsen and Mosekilde (7)


Percentage osteoid labeled by tetracycline


The percentage of trabecular osteoid surfaces that take up a tetracycline label


73.4 ± 26.5%


Melsen (5)


Apposition (calcification) rate (µm/d)


The average distance between all tetracycline double labels divided by the number of days between the administration of the two labels


0.64 ± 0.01 µm/d


Melsen and Mosekilde (8)


Bone formation rate (µm/d)


The apposition rate multiplied by the percentage of trabecular bone surface labeled by tetracycline


0.48 ± 0.19 µm/d


Melsen and Mosekilde (8)


Mineralization lag time (d)


The mean osteoid seam width divided by the bone formation rate


29.9 ± 3.0 d


Melsen and Mosekilde (8)


a Standard error of the mean.
Modified after Vigorita VJ, Anand VS, Eihorn TA. Sampling error in diagnosing hyperparathyroid changes in bone in small needle biopsies. Am J Surg Pathol. 1986;10:140-142.


Trabecular Morphology

In general, bone spicules should be smooth and should measure approximately 200 µm in width. Therefore, thin bone spicules with readily recognizable ragged surface appearance indicate pathology (Fig. 3.3). Although osteoclasts are normally present in bone, they are seen only rarely in routine histologic sections. Rough estimates are that only 0.1 percent of bone surfaces should show active osteoclast resorption. Roughly, 0.2 osteoclasts should be seen per square millimeter of trabecular bone area, and only 5 percent of bone surfaces should show scalloped morphology. These are guidelines that can be used in identifying high bone resorptive activity. For comparison, in hyperparathyroidism, these resorptive values are significantly elevated. In addition, there are a few unusual observations that merit mention. Osteoclasts are rarely seen on osteoid, and when present, they are almost always interfaced with mineralized bone. Subperiosteal osteoclasts are rare and, when present, are indicative of a high-resorbing state, classically seen in hyperparathyroidism.


TABLE 3.2 Rule of 2


Bone volume


>20%


Osteoid surface


<20%


Osteoid volume


<2%


Mean trabecular width


200 µm


Osteoclasts


0.2/mm2 bone


Calcification rate


1/2 µm/day


Mineralization lag time


20 day


In remembering normal trabecular bone morphology of the ilium, approximately 20% of the marrow space should be occupied by bone (TBV [%]); approximately 20% of the bone surface should be covered by osteoid [trabecular osteoid surface—TOS (%); less than 2% of the bone should be osteoid (trabecular osteoid volume—TOV [%]); approximately 0.2 osteoclast should be present per mm2 of bone; the average width of a bone spicule should be 200 µm; the calcification rate should be roughly 0.5 µm/d; and the mineralization lag time should be 20 d.


Modified after Vigorita VJ, Anand VS, Eihorn TA. Sampling error in diagnosing hyperparathyroid changes in bone in small needle biopsies. Am J Surg Pathol. 1986;10:140-142.


FIGURE 3.2. Osteoid. In normal states (A), osteoid constitutes less than 2 percent of the volume of bone, covers less than 20 percent of bone surfaces, and is usually barely perceptible at low-power microscopy. With increasing pathology, osteoid surface and volume increase (B-D). Von Kossa stain, undecalcified section.

Measurement can be done with micrometer eyepieces or ocular grids by counting the intersections juxtaposed on the slide. For example, consider a grid of 25 intersections in evaluating the amount of trabecular bone present. If 7 of the 25 intersections were juxtaposed on bone, the trabecular volume would be estimated to be 28 percent (7 divided by 25). More advanced techniques using semiautomatic systems such as planimeters or automatic image analysis are currently marketed by the major microscope companies and offer the advantage of speed and accuracy. In the use of the semiautomatic system, there are three essential components: an electromagnetic sensitive x-ray tablet or plate, a cursor, and a computer for calculations. The slide is viewed directly in the light microscope. With a manually operated cursor or pen, the image is superimposed by use of an optical drawing tube (Fig. 3.1). As the desired features are manually traced, or counted, coordinates are electronically sent to a memory computer programmed to generate the appropriate data. Automatic image analysis systems with supportive software programs to generate quantitative histomorphometry are commercially available. Recent monographs on histomorphometry techniques are suggested for reference. For measurement purposes, slides prepared with hematoxylin and eosin (H&E) and von Kossa stain will suffice, the latter for measurement of osteoid parameters. Some investigators
prefer other stains such as the Goldner stain or modified trichrome stains or the Villaneuva stain for osteoid evaluation.


FIGURE 3.3. Trabecular bone, thin and ragged, indicating pathology (histology).


FIGURE 3.4. Osteomalacic bone is characterized by the large increase in both volume and surface extent of osteoid tissue (seen here as the red tissue). Osteomalacia, however, may have an increased (A), normal, or decreased (B) amount of bone (i.e., mineralized and unmineralized or osteoid tissue taken together). The biopsy in (B) is clearly that of a patient with osteomalacia who also has osteoporosis.

The purpose of using histomorphometric analysis is to obtain a precise measurement of bone mass and osteoid mass and to quantify rates of bone activity (11). This is done in two parts: first, by examination of stained sections using light microscopy to evaluate “static” parameters such as bone volume, and second, by examination of unstained sections using fluorescent microscopy for the evaluation of tetracycline labels. It is important to emphasize here that the reliability of the data generated is predicated by the quality of the bone biopsy itself. For cross-institutional reference data, the biopsy should be a full-thickness transcortical iliac biopsy with both cortices intact. The most appropriate specimen is one in which the cortices are parallel.


Static Histomorphometry

Obviously, the number of possible measurable parameters is infinite. If one considers a trabecular bone spicule, for example, one could measure its area, perimeter, width, number of osteocytes, average osteocyte lacunar space, and so on. Practically speaking, however, there are a few items of clinical significance (Table 3.1) (2,5,6,7,8,9,10). Clinically important is the amount of bone that is present (as an index of osteoporosis and, presumptively, the propensity to fracture), the amount of osteoid that is present (as an index of osteomalacia), and the number of osteoclasts that are present (as an index of bone resorption). In osteoporosis, there is a decreased amount of bone. In the iliac biopsy specimen, this can be seen by the loss of connecting spicules and thinning of the spicules with the resultant appearance of small bone patches isolated in the marrow. Sophisticated analyses of cancellous bone architecture include such measurements as marrow space star volume, trabecular bone pattern factor, node-to-terminus ratio, trabecular number, and trabecular separation (12). There may or may not be increased resorptive activity, but where present, this may often be correlated with concurrent endocrinopathies or steroid therapy. Trabecular bone is lost first, and later, cortical bone becomes thinned. The loss of cortical bone is accelerated in some patients and most likely predisposes that group to femoral neck fractures. In osteomalacia, there is extensive osteoid accumulation. However, the mineralized bone component may be normal, decreased, or even increased when compared with “normal” bone (Fig. 3.4). Resorptive activity is usually increased, but this finding is quite variable. In secondary hyperparathyroidism, resorption is excessively high, and although much of the bone surface shows metabolic activity, including increased osteoid surfaces, the amount of osteoid is less than that seen in osteomalacia. Punched-out holes in the spicules with intratrabecular tunneling resorption are the classic findings.

Standardization of histomorphometry nomenclature and symbols has been proposed by the American Society of Bone and Mineral Research has been proposed (13) (see Appendix VI). Sample definitions and literature reference values for histomorphometry are listed in Table 3.1. In some instances, the terms are imprecise. For example, trabecular bone “volume” (TBV) is actually derived by tracing and recording the “area” of the slide occupied by bone, but volume is the usual reference term.

The cost of setting up a bone laboratory requires additional and often excessive expenditures by the hospital laboratory, including equipment and technical time. Measuring equipment can be assembled for under $10,000, but undecalcified processing requires time-consuming plastic processing and specialized microtome equipment. When the technical time for the histomorphometry is added to this, the procedure becomes cost-effective only in those laboratories in which it is performed in high volume. Therefore, reference laboratories should be used when possible.


FIGURE 3.5. When tetracycline is given to a patient and bone is processed in an undecalcified fashion (A), bone surfaces will show distinct linear uptake at roughly 20 percent of bone surfaces (B), when unstained sections are viewed with standard fluorescence microscopy. If two doses are given separated in time, a calcification or apposition rate can be calculated by dividing the measurable distance between the two labels by the known time between dosage administration. Here, a normal apposition rate of approximately 0.6 µm/day is noted by the two distinct dual tetracycline lines in trabecular (C) and cortical (D) bone. Normal (left) versus osteomalacia bone is contrasted in (E). Unstained, undecalcified section, fluorescent microscopy.


Dynamic Histomorphometry—Tetracycline

Because of tetracycline antibiotics’ autofluorescence, they can be visualized on unstained tissue using routine fluorescent microscopy (Fig. 3.5). Because tetracycline attaches to the mineralizing areas, it is localized to the bone surface of mineralization fronts. Qualitative information is derived by assessing the extent of tetracycline uptake and the distinctness of the labels. In hypermetabolic states, such as that seen in Paget’s disease, increased bone surface uptake is demonstrated, whereas most non-endocrine-influenced, aging osteoporotic bone shows limited tetracycline activity. In osteomalacia, there is more tetracycline surface activity, but it reflects the aberrant mineralization by having a smudged appearance.

When tetracycline has been administered on two separate occasions prior to biopsy, the rate of calcification can be calculated.
For example, if the interval between tetracycline administrations was 12 days, and the tissue sample revealed a distance of 10 µm between the two tetracycline labels, the rate of calcification is calculated to be 10 µm per 12 days (10 divided by 12) or 0.83 µm per day. In classic osteomalacia, the rate of calcification is decreased, whereas in hypermetabolic endocrinopathies, such as hyperthyroidism, the rate is increased. Other tetracycline-derived information, although of tremendous academic interest, has limited clinical applicability at this time. Consider for a moment our knowledge of bone formation. A primitive cell is transformed into an osteoblast that produces collagen (osteoid) that is subsequently mineralized at the calcification front (the site of tetracycline uptake). Theoretically, a condition in which the calcification rate is normal but the osteoblasts are making osteoid at a fast rate would result in wide osteoid seams, which are the hallmark of classic osteomalacia. However, to the best of our knowledge, osteoblast function is normal in most types of osteomalacia. Wide osteoid seams may be due to a prolonged or defective mineralization of the osteoid (osteomalacia) or increased osteoid formation (e.g., hyperparathyroidism). Only tetracycline labels can make the distinction. They would show a very prolonged mineralization lag time in osteomalacia.

Experts differ in the morphologic definition of osteomalacia. An increase in osteoid seam thickness, the presence of at least five birefringent lamellar lines in the osteoid seams at any one point or in a significant proportion of osteoid seams, or surface osteoid greater than 25 percent have all been used on histologic grounds alone. However, the imprecision of these criteria is emphasized by the knowledge that endocrinopathies such as hyperthyroidism and hypersteroidism may lead to measurable osteoid increases. The use of the autofluorescence of tetracycline has enlarged our analytic capabilities. Because tetracycline attaches to the mineralization front, qualitative information regarding mineralization can be obtained by assessing the extent of tetracycline uptake and the morphologic appearance of the labels. For example, a decrease in the number of osteoid seams taking up tetracycline indicates pathology. For optimal assessment, the patient should be double labeled with tetracycline prior to biopsy. This allows determination of a calcification (apposition) rate of bone formation by measuring the distance between the tetracycline labels and dividing it by the known interval in days between administration. A well-established protocol is as follows: oxytetracycline 250 mg, 3 times per day for 3 days; no medication for 12 to 14 days; Declomycin 300 mg, 2 times per day for 3 days; and biopsy performed 1 week after the completion of the second label.

The antibiotics are given over several days to allow fixation at the mineralization zones. The 12-day interval is subjective, but the longer the wait, the better, particularly in mineralization defect cases such as osteomalacia. A delay of several days prior to biopsy allows better fixation of the second label. The use of dyes and radioactive isotopes prior to interventional diagnostic studies is a well-established medical precedent to such a line of investigation. It should be noted that intravenous tetracycline administration will also be effective in labeling bone, so patients on total parenteral nutrition may be evaluated. Evaluation of tetracycline labels is done using a standard fluorescent microscope.


Osteoporosis

Osteoporosis is best defined as a decrease in the amount of bone with microarchitectural deterioration to the point of spontaneous fracture or fracture following minimal trauma. In the United States alone, there are 1.5 million osteoporotic fractures per year, with a direct annual cost of $18 billion (1). Although microarchitecture, that is, bone quality, cannot be measured clinically, bone mineral density (BMD) can be measured by dual-energy x-ray absorptiometry (DEXA), and by using such measurements, a National Institute of Health consensus conference defined normal bone density as a value for BMD that is no more than 1 standard deviation (SD) below the young adult mean value; a low bone mass (or osteopenia) as a value for BMD that lies between 1 and 2.5 SD below the young adult mean value; osteoporosis as a value for BMD that is more than 2.5 SD below the young adult mean value; and severe osteoporosis as a value for BMD that is more than 2.5 SD below the young adult mean value in the presence of one or more fragility fractures (Fig. 3.6).

Although many different disorders (Table 3.5) may contribute to a loss of bone mass, the term osteoporosis is often used more specifically for a condition with no readily definable underlying collagen or mineral abnormality. It is most commonly seen in postmenopausal white women and usually manifested by a fracture of a vertebra (spinal compression fracture syndrome), the proximal end of the femur, or the distal radius (Colles fracture) (Fig. 3.7).


TABLE 3.4 Histologic and Histomorphometric Hallmarks of Classic Metabolic Bone Disorders


Disorder


Histologic Features


Histomorphometry


Osteoporosis


Decreased bone mass


↓TBV, ↓MTW


Osteomalacia


Increased osteoid (poorly mineralized bone) Smudged irregular tetracycline uptake


↑TOS, ↑TOV, ↑MOSW ↓CR, ↑MLT


Hyperparathyroidism


Increased osteoclasts Osteoclastic tunneling resorption Bone spicules with “punched-out” holes


↑TRS, ↑ORS ↓MTW


Paget’s disease


Woven bone of variable thickness Increased osteoclasts Large, bizarre osteoclasts


↑TBV, ↑CR ↑TRS, ↑ORS


TBV, trabecular bone volume; MTW, mean trabecular width; TOS, trabecular osteoid surface; TOV, trabecular osteoid volume; MOSW, mean osteoid seam surface; CR, calcification rate; MLT, mineralization lag time; TRS, trabecular resorptive surface; ORS, osteoclastic resorptive surface; ↑, increased; ↓, decreased.


FIGURE 3.6. Bone mineral content at the distal forearm in women as a function of age. (Modified after Kanis JA, Melton LJ, Christiansen C, et al. The diagnosis of osteoporosis. J Bone Miner Res. 1994;9:1137-1141.)


TABLE 3.5 Disorders Associated with Generalized Osteopenia or Osteoporosis


I.


Postmenopausal osteoporosis, age-related osteoporosis, juvenile osteoporosis


II.


Endocrine abnormalities


1.


Adrenal cortex


a. Cushing disease


b. Addison disease


2.


Estrogen deficiency


3.


Pituitary


a. Acromegaly


b. Hypopituitarism


4.


Pancreas


a. Diabetes mellitus?


5.


Thyroid


a. Hyperthyroidism


b. Hypothyroidism


6.


Parathyroid


a. Hyperparathyroidism


III.


Marrow disorders


1.


Myeloma


2.


Lymphoma


3.


Metastatic cancer


4.


Gaucher disease


5.


Certain anemias (sickle cell, thalassemia)


6.


Hemosiderosis


IV.


Drugs and other substances


1.


Steroids


2.


Heparin (osteoporosis)


3.


Anticonvulsants (osteomalacia)


4.


Alcohol


V.


Collagen disorders


1.


Osteogenesis imperfecta


2.


Homocystinuria


3.


Vitamin C deficiency (scurvy)


4.


Marfan syndrome


VI.


Osteomalacia (Tables 3.15 and 3.17)


VII.


Immobilization, inactivity


VIII.


Ischemic bone disease


The diagnosis of osteoporosis is complicated by the fact that routine x-rays are not sensitive enough to pick up osteoporosis at an early age or stage and there are no laboratory tests that can help screen either for the diagnosis or for a population at risk. It has been estimated that roughly 40 percent of the skeletal mass must be lost before an x-ray can begin to show signs of osteopenia. Osteoporosis does not reveal any consistent metabolic abnormalities detected by standard laboratory tests and certainly none to predict a fracture at any given time in a specific patient.

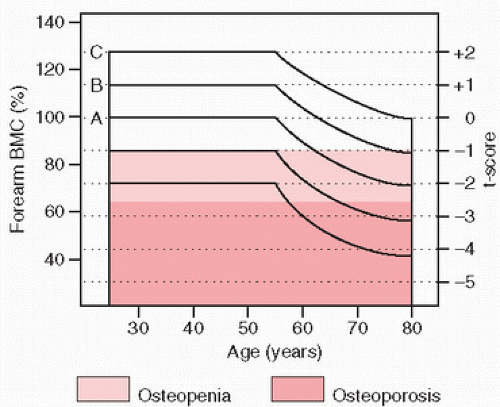
Bone loss appears to begin at about the age of 35 years, occurring at a rate of approximately 0.2 percent per year until menopause, at which time a precipitous decline ensues (Fig. 3.8). Over time, there is an imbalance between bone formation and bone resorption, with bone loss increasing disproportionately. It has been estimated that over a lifetime, a woman loses approximately
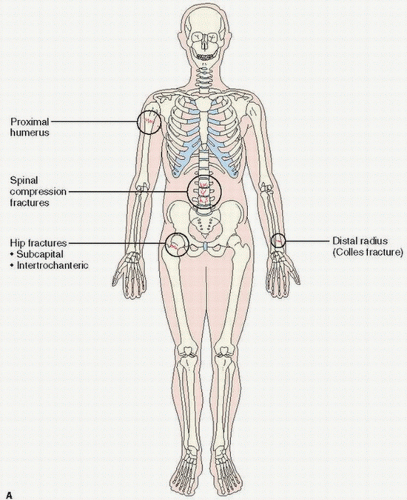
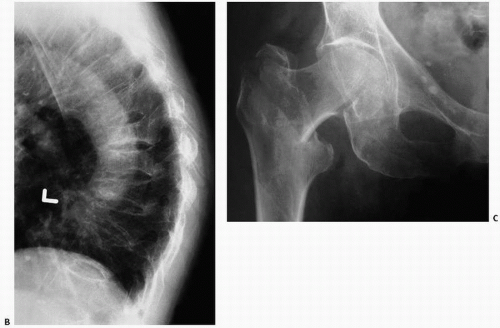
35 percent of her cortical bone and 50 percent of trabecular bone. Therefore, bones with greater trabecular bone constituting their surface area, such as the vertebrae of the spine, may be preferentially affected (Fig. 3.9). Whereas cortical bone predominates in the shaft of the long bone, trabecular bone predominates in the pelvis, flat bones, and ends of long bones. Being more metabolically active, trabecular bone is more subject to change in variations in mineral homeostasis. Although osteoporosis usually develops as a systemic loss of bone, it may occur regionally (14) and at different rates in the cortical and trabecular bone compartments. In fact, two types of osteoporosis have been proposed on the basis of this compartmentalization of bone. For cortical bone loss, deterioration begins around age 40 years in both sexes at a rate of 0.4 percent per year, increasing with age until slowing or cessation later in life. In women, there is an accelerated superimposed cortical bone loss following menopause with the rate of loss approximately 2 to 3 percent per year, decreasing for over a decade. In addition, there is a loss of hematopoietic bone marrow throughout the skeleton, although it occurs at different rates in different anatomical sites. As bone marrow is increasingly exploited for its source of mesenchymal stem cells (and osteoblast precursors), we have learned that age- and site-specific stem cell depletion may be a significant contributory risk factor.


FIGURE 3.7. Osteoporosis at a glance. (A) Osteoporotic fracture sites. (Continued)

To summarize, bone loss occurs throughout aging, beginning approximately at age 35 years, and affects both cortical and trabecular bone. There are different rates of loss in different parts of the skeleton. In women, the superimposed accelerated loss at or about menopause leads to considerable bone loss over a period of 10 years, producing the now well-recognized significant risk for fractures and their associated morbidity and mortality.


Risk Factors

Although there are numerous risk factors for the development of osteoporosis (Table 3.6), the occurrence of a previous osteoporotic (“fragility”) fracture is the strongest indicator of risk for a future fracture. Patients with a low-energy fracture of the wrist, hip, proximal humerus, or ankle have a nearly fourfold greater risk for a future fracture than individuals who have not. Osteoporotic vertebral fractures predict additional vertebral fractures and fractures of the hip. Wrist fractures (distal radius) often predate hip and spine fractures by 15 years and presage lower energy osteoporotic fractures elsewhere.


FRAX

FRAX, released in 2008 by the World Health Organization, is a Fracture Risk Assessment Tool available online at www.shef.uk/FRAX. It is a tool that calculates the 10-year probability of a major osteoporotic fracture in the proximal part of the humerus, the hip, the wrist, or a clinical vertebral fracture (Fig. 3.10) (14). The clinical risk factors utilized in FRAX are listed. Other fracture risk calculators include the Q Fracture Score (QFS), a more complex tool than FRAX as it requires the use of more variables (1). Algorithms for fragility (osteoporotic) fracture risk have followed suit (1).


Genetics

Estrogen deficiency and genes involved in sex steroid metabolism such as those coding for aromatase (CYP19 genes) and other sex steroid hormone receptors are probable contributory factors in the expression of osteoporosis (15). For example, the CAG repeat polymorphism (CAGR) in the androgen receptor gene has been associated with decreased BMD and the increased incidence of vertebral fractures in males.


FIGURE 3.7. (Continued) (B) Spinal compression fracture syndrome. (C) Fractured hip. (Continued)

Additional osteoporosis candidate genes are being investigated (16). X-linked traits with osteoporosis and fractures have been reported for over 35 years and most recently in five families with pathogenic variants of plastin 3 (PLS3), a protein involved in the formation of filamentous actin (F-actin) bundles, which are important in bone health (17).

Vitamin D receptor gene polymorphisms have been shown to affect BMD variation and fracture rates, and may interact with calcium and estrogen to modulate BMD. Studies of collagen genetics suggest that an Sp1 polymorphism in the COL 1A1 gene may be associated with osteoporotic fractures—not surprising, because collagen 1 defects are ubiquitous in osteogenesis imperfecta. Because high serum homocysteine levels have adverse effects on bone methylene tetrahydrofolate reductase (MTHFR). which affects the methylation of homocysteine to methionine, they may be an important contributor to the development of osteoporosis. Other candidate factors include ApoE, a lipid-transporting glycoprotein; insulin-like growth factor 1 (IGF-1), a growth factor related to growth plate chondrocyte proliferation and matrix mineralization; interleukin 6 (IL-6), a cytokine that promotes osteoclast differentiation; LRP5, whose mutations can lead to both high- and low bone mass syndromes; and SOST, a gene that can lead to sclerosteosis, a bone dysplasia characterized by bone overgrowth.


FIGURE 3.7. (Continued) (D) Dual-energy x-ray absorptiometry (DEXA) report of hip showing osteoporosis as defined as a T-score less than 2.5 standard deviations below that of a young adult mean value. (E) Coronal section of spine showing architectural deterioration. The horizontal bone plates have been largely lost (gross specimen). (F and G) A normal (F) and severely osteoporotic (G) transcortical iliac biopsy showing in the osteoporotic microarchitectural deterioration. There are loss of bone, thinning of remaining bone, and lack of connectivity of the thinning bone (von Kossa stain).


FIGURE 3.8. Bone loss percentages with age and sex in cortical and trabecular bone.


FIGURE 3.9. Severe osteoporosis with vertebral spinal compression fractures. Lateral spine roentgenographs (A and B). Gross (C). Measurements of the fraction of collapse of vertebrae have been used to give cumulative osteoporosis indices.


TABLE 3.6 Risk Factors Associated with Osteoporosis


Clinical history


Previous fragility fracture


Family history of a fragility fracture


Profile


Caucasian or Asian


Low weight


Small frame


Lean


Long hip axis length


Low bone mass at skeletal maturation


Dietary profile


Low calcium intake


High phosphorous intake


High protein intake


Lactase deficiency


Lifestyle


Inactive or low physical activity


Smoking


High alcoholic intake


Other


Home environmental hazards predisposing to tripping


Medications inducing decreased alertness or impaired vision


Medical conditions predisposing to falls (neurologic, cardiac)


FIGURE 3.10. FRAX. The World Health Organization’s Fracture Risk Assessment Tool.

Most clinical and experimental research has historically focused around the contributions of calcium or estrogen deficiency in causing osteoporosis (18) and the disturbance of the bone remodeling cycle. Although there is no definitive or widely accepted evidence to suggest that calcium deficiency is directly related to the production of osteoporosis, there exists a substantial body of scientific literature supporting an important role for calcium. Classic studies of bone status and fracture rates from an epidemiologic point of view are convincing. In a classic study in the former Republic of Yugoslavia, a lower fracture rate was noted in patients coming from areas of dietary high-calcium intake compared with the fracture rates in low-calcium dietary regions (19).

There is little question that the development of osteoporosis in women is temporarily linked to the postmenopausal state, a period of estrogen deficiency due to either waning ovarian function or amenorrhea. We now can construct a larger number of risk factors based on the clinical profiles of women with osteoporosis. The typical osteoporotic patient is usually a white or Asian postmenopausal woman of lean body build with a positive family history, low dietary calcium intake, and a history of relatively little weight-bearing physical activity. Significant contributing factors include hyperparathyroidism or increased thyroid activity, including thyroid medication as well as corticosteroids or anticonvulsive therapy.

Parathyroid hormone may have contrasting effects. Whereas continuous elevated parathyroid secretion as seen in parathyroid
adenomas is linked to increased bone resorption, transient or intermittent administration of parathormone (PTH) can have a stimulatory effect on bone formation, the latter providing a scientific basis for new treatments of osteoporosis with PTH (20).

Perhaps the most important risk factor is the history of a previous fragility fracture. Fractures do predict fractures in the aging and postmenopausal states. The risk of future fractures after having sustained an osteoporotic fracture increases from 1.5- to 9.5-fold (21).

Other risk factors for osteoporosis include smoking, caffeine intake, alcoholic intake, and high-protein diets.

Cigarette smoking decreases BMD and increases the risk of nonunion and delayed union of fractures. Nicotine and carbon monoxide decrease microperfusion and tissue oxygenation, increase platelet aggregation and blood viscosity, resulting in microclotting (22) and, therefore, potential osteonecrosis. Soft tissue and wound healing is also impaired, and smokers are at greater risk for infection, back pain and degenerative disc disease, rheumatoid arthritis, and even rotator cuff tears.

Gastrectomy may also adversely affect the bone mass. Bauer et al. (23) have estimated risk factors, in decreasing strength of positive association, estrogen use, non-insulin-dependent diabetes, thiazide use, increased weight, greater muscle strength, later age at menopause, and greater height. The effects of growth hormone and acromegaly are complex and less clear. Androgens, such as testosterone, lead to increased bone mass (22).

Other risk factors include bone ischemia as typically seen in conditions such as regional or transient osteoporosis, hip axis length, and skeletal age at maturity. Associations with hemosiderosis, fatty marrow, arthritis, Marfan syndrome, depression, and pregnancy have been made. Increased body weight, exercise, or obesity may be protective. With disuse and the skeletal deloading effects of microgravity, osteoporosis occurs. For a long time, NASA scientists worried that astronauts, losing 1 to 2 percent of their bone density per month in space, would return to earth with weaker bones. Improved exercises on treadmills in space and antiosteoporotic drugs have lessened that concern. Increased bone mass in the dominant arm in sports such as tennis, squash, and baseball is well documented. Whether diabetes is associated with bone loss or gain is still debatable.

The effect of glucocorticoids has been most extensively studied (24). Both a decrease in bone formation and an increase in bone resorption have been postulated. A downregulation of the synthesis of extracellular matrix proteins and integrins, cell-surface receptors, by osteoblasts has been demonstrated experimentally (25). In addition, tissue culture experiments have demonstrated glucocorticoid-stimulated increases in osteoclasts and measurable release of calcium into culture medium.

Dexamethasone has been found to upregulate the expression of the osteoblast inhibitory factor Dickkopf 1 (or DKK-1), which interacts with the Wnt coreceptors LRP5 and LRP6, thereby inhibiting the Wnt signal (24). In addition, glucocorticoids suppress the expression of RUNX2/Cbfa1 critical for osteoblastogenesis. Other actions include suppression of insulin-like growth factor and osteoclastic promotion via increasing the expression of RANKL and inhibiting the expression of osteoprotegerin, the osteoclast decoy signal.

A typical osteoporotic profile is that of a woman of short stature with low body weight and low-calcium dietary intake, who is a heavy smoker. Norwegians have estimated that lean women who smoke have essentially added 10 years to their “bone age” (26). Daughters of women with osteoporosis have reduced bone mass in the lumbar spine and perhaps the femoral necks, suggesting, at least in some studies, a genetic factor to the transmitted risk for osteoporosis.

Postmenopausal osteoporosis may also result from a relatively low peaked bone mass at skeletal maturation, a factor that is often implicated in the lack of significant osteoporosis in the average black woman. Blacks, especially black women, have less osteoporotic fractures at comparable ages than whites.

Of particular interest is the association of lactase deficiency with patients with the spinal fracture compression syndrome and non-ankle weight-bearing bones (27). It is reasonable to presume that the avoidance of milk products associated with this condition could lead to low bone mass as a result of long-term suboptimal calcium ingestion in the diet. The association of lactose deficiency with osteoporosis is controversial in that populations where the prevalence of lactase deficiency is generally highest are those in black Americans and sub-Saharan Africa.

Mechanical loading on the skeleton is important in maintaining bone density and strength. Well-known clinical observations include the precipitous loss of bone in astronauts in space and the rarity of osteoporosis in the obese. In fact, bone loss during diet-induced weight loss in the obese has been considered a physiologic normalization. Lack of exercise is a significant factor in osteoporosis observed in men and women.

Mechanical loading is thought to have a protective effect by maintaining bone remodeling in its normal coupling phenomenon: In non-weight-bearing bones, bone resorption is increased and bone formation is decreased. Direct stimulation of osteoblasts in mechanical loading has been postulated.

The osteoporotic man, a rarer phenomenon, is more difficult to characterize although glucocorticosteroids, whether endogenously produced or therapeutically given, alcohol intake, hypogonadism, inactive lifestyle, osteomalacia, and neoplasia are important factors (15). Greater bone mass at all ages, shorter life expectancy, and no equivalent to menopause have been used as explanations that osteoporosis is less common in men. Although hip fracture rates are indeed higher in women than in men, with increasing age, the lifetime risk of fractures of the femur is substantial in the male population. The major factors for hip fracture appear to be heavy alcoholic use. In a well-studied medical chart review in a veteran population, preadmission ambulatory problems, confusion, and overall low body mass have been documented. These studies confirm known traditional risk factors for the osteoporotic hip fractures in women, which include medical conditions predisposing to falls such as neurotropic cerebrovascular and cardiovascular arrhythmias, environmental hazards leading to tripping and falls, and medications that induce decreased alertness, dizziness, and impaired vision.

Osteoporosis in the pediatric age group remains the most perplexing group of all, but certainly includes subtle cases of osteogenesis imperfecta.

From a clinical point of view, osteoporosis is suspected in any elderly patient with a hip fracture and any postmenopausal woman complaining of back pain or recent or gradual loss of height. Although the causes of back pain are protean, osteoporosis should be suspected in a woman with progressive thoracic kyphosis—a dowager’s hump—especially if she has the risk criteria mentioned before. The occurrence of low trauma fracture almost anywhere in the skeleton is associated with future substantial risk of fracture. Healy and Lane (28) have emphasized scoliosis as an important complication in these women. As mentioned, the concern about
osteoporosis is directly linked to its relationship to the development of skeletal fractures. In one large prospective cohort study, it was shown that with age, in non-black women older than 65 years of age, the risk of fractures of the wrist, foot, humerus, hip, toe, leg, pelvis, hand, and clavicle was significantly related to reduced bone mass. Fractures of the ankle, elbow, finger, and face, however, were not significantly at risk for loss of bone mass. In this regard, an enormous effort has been undertaken to perfect early roentgenographic diagnosis.


Radiographs and Imaging Procedures

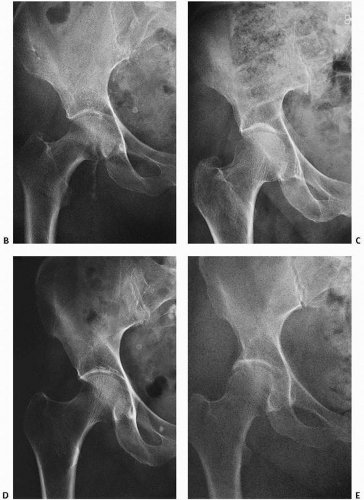
Routine x-rays are not sensitive enough to diagnose osteoporosis before substantial bone loss has occurred (Fig. 3.9). Nonetheless, analysis and semiquantitative measurements of roentgenograms of the femur, vertebra, calcaneus (29), and hand have been proposed as well as ultrasound analyses (30). The most popular measurement today is that of bone densitometry (vida infra).


FIGURE 3.11. Singh index. (A) Diagrammatic representation of Singh index. (Continued)

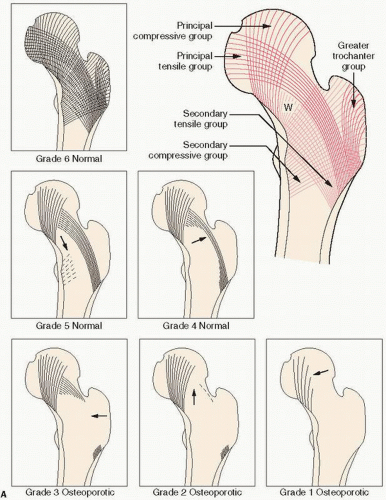
Of historical interest is the Singh index, a measurement of trabecular bone patterns of the proximal femur (31) (Fig. 3.11). In this technique, one evaluates the internal architecture of the proximal femur, which is composed of two major trabecular systems produced during weight bearing. The Singh index proposes that, with increasing osteoporosis, bone loss follows a predictable pattern with loss of secondary trabeculae first. Ward triangle enlarges, and then there follows loss of tensile trabeculae, and finally compressive trabeculae. The preferential pattern of loss is thought to reflect the mechanical means of weight bearing. A comparable system has been used in the calcaneus.


FIGURE 3.11. (Continued) Roentgenographs: Singh Grade 5 (B), Singh Grade 3 (C), Singh Grade 2 (D), and Singh Grade 1 (E).

Meema and Meindok (32) have extensively evaluated peripheral skeletal measurements using an x-ray of midshaft of the index finger metacarpal measuring the total diaphyseal width and combined cortical thickness, with fractions of the latter over the former being used as an osteopenia index (Fig. 3.12).

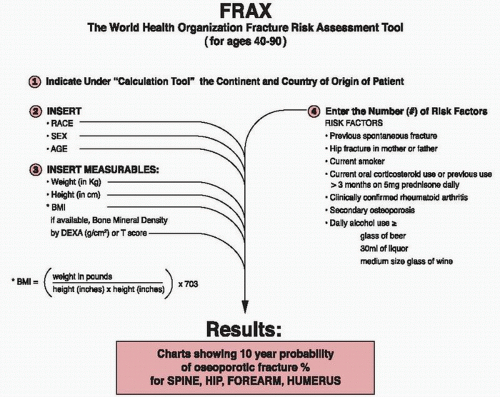
In general, there are three methods (
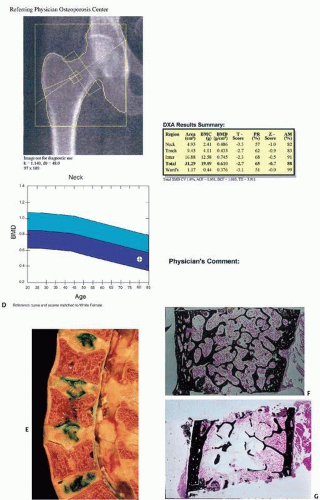
Table 3.7) for the noninvasive quantitative estimation of bone loss: (a) routine imaging procedures, which are descriptive in nature and used to evaluate items such as the presence or absence of bone trabeculae, or cortical bone thickness; (b) semiquantitative procedures, which use routine x-rays to grade trabecular bone patterns, such as the Singh index or measurement of the thickness of cortices; and (c) quantitative procedures, which are utilized to attempt to measure bone density at different sites with techniques using ultrasound or various types of radiation. Of these, DEXA is considered the current gold standard (Fig. 3.13).

In DEXA, x-ray beams of two distinct energies are passed through a specific region of bone, and differences in the absorption of each beam are computer analyzed to distinguish between the mineral content of bone and that of adjacent tissues to determine bone density. Although most DEXA is used to measure BMD of the lumbar spine and hip, it has been shown to correlate with heel ultrasound in discriminating a first hip fracture (30).


FIGURE 3.12. Semiquantitative bone measurement of hand x-ray (82).


TABLE 3.7 Methods Used For the Evaluation of Bone Loss


Descriptive imaging assessments


Radiologist’s impression


Semiquantitative procedures


Assessment of architectural features such as trabecular patterns (Singh index)


Cortical thickness


Assessment of bone density


Ultrasound


Dual-energy x-ray absorptiometry


The frequency with which DEXA testing should be performed is currently controversial. In 2012, Medicare paid for bone density testing every 2 years. Many medical groups recommend testing as early as 50 years of age, but there are little data to guide such decisions. It has been estimated that osteoporosis would develop in less than 10 percent of older, postmenopausal women during rescreening intervals of approximately 15 years for women with normal bone density or mild osteopenia, 5 years for women with moderate osteopenia, and 1 year for women with advanced osteopenia (33).

Limitations in the DEXA measurement of bone are well known. DEXA provides only a two-dimensional assessment of bone, a three-dimensional tissue. Disturbances in three-dimensional geometry and microarchitectural deterioration are not captured. DEXA scans can also be distorted by tissue calcifications such as those seen in aortic calcification.

Specific examples of DEXA’s limitations are seen in Figure 3.4A, in which DEXA would measure a normal amount of bone but the tissue is clearly osteomalacic. DEXA would also miss the profound trabecular bone osteoporosis in Figure 3.7G because there is a significant amount of cortical bone.

Thus, BMD as measured by a technique such as DEXA is a limited predictor of fracture risk. To improve the ability or predict fracture risk, information in addition to BMD is needed such as analyses of microarchitectural structure and material properties of the bone.

Both ultrasound (30) and DEXA have been applied to other bone sites such as the calcaneus in an attempt to quantify bone mass and predict fracture risk. In general, the specificity of calcaneus DEXA measurements to predict osteoporosis at the axial sites such as the hip or spine is excellent but sensitivity poor.

With specific regard to the foot, foot fractures are more likely to be osteoporotic in etiology than ankle fractures (34).

When taking into consideration increasing numbers of known risk factors for osteoporosis, low BMD as assessed by DEXA has been correlated with a higher rate of hip fractures (35).

In quantitative computed tomography (CT), the attenuation of an x-ray beam as it passes through a bone usually L1 to L4 is used. It is related to bone density using a phantom that includes a bone mineral, K2HPL4, and soft tissue, water, and glycerol equivalent. Despite widespread use of these techniques for investigational purposes, the search for a fracture threshold has been elusive. This is readily explained by the complex etiology of fracture in which bone mass is only one contributing factor. Other important considerations are the degree of trauma, the mechanical strength of the remaining bone, the overall structural integrity of the skeleton in other locations, and the aforementioned contribution of lifestyle risk factors. Nevertheless, values do exist in these diagnostic modalities at which severe osteoporosis may be presumed to be present (Table 3.8) (36). Caution is advised in extrapolating bone mass measurement at one site to be representative of bone mass at other sites.


Laboratory Findings

There is no diagnostic laboratory test for osteoporosis. Routine serum urinalyses are unremarkable in the typical osteoporotic patient. This precludes, of course, that patient with a severe acute fracture, in whom an elevated alkaline phosphatase is expected. Nevertheless, the search for serologically or urinary derived factors that may be of help in diagnosing a high-resorbing skeleton continues. Unlike high-turnover metabolic disorders such as Paget’s disease or primary hyperparathyroidism, in which the laboratory can readily reflect the high turnover of the skeleton, osteoporosis is a condition in which subtle changes in bone remodeling occur “silently” over a long period of time. Nonetheless, biochemical markers of bone turnover have been used in both clinical and experimental work (Fig. 3.14).

Only gold members can continue reading. Log In or Register to continue

Stay updated, free articles. Join our Telegram channel

Jul 24, 2016 | Posted by in PATHOLOGY & LABORATORY MEDICINE | Comments Off on Metabolic Bone Disease: Part I

Full access? Get Clinical Tree

Get Clinical Tree app for offline access