CHAPTER 19 Measures of Effect
ODDS RATIO
The same calculation can be done for subjects who are healthy. Both groups have some degree of exposure. When we compare the fractions, as shown in Figure 19-1, we are comparing the odds that cancer subjects were exposed to cigarettes versus the odds that the healthy controls were exposed. This is known as the odds ratio.
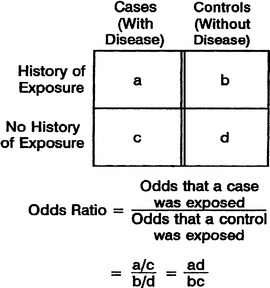
If there is no difference in exposure, the result will be close to 1, which supports the conclusion that the exposure has no association with the disease. The farther the odds ratio is from 1, the stronger the association. Using the formula in Figure 19-1, a number greater than 1 supports an association between cigarette exposure and lung cancer. In some cases, the exposure may be protective, such as the exposure of seat belt use in subjects who suffered car crash mortalities versus those who lived. In this case, the odds ratio would be smaller than 1, which would indicate that the odds of having used a seat belt in car crash mortality victims are less than the odds of seat belt use in those who survived a car crash.
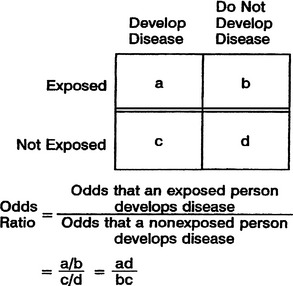
It is also possible to use a prospective study to calculate an odds ratio. This scenario is shown in Figure 19-2. The relative odds in both case–control and cohort studies results in the same number. It is an effective way to measure whether a specific exposure is associated with a disease.
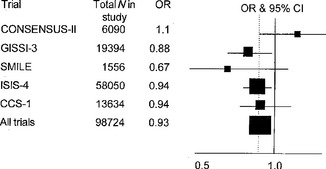
The odds ratio is often reported as a single number followed by a confidence interval in parentheses. On a graph, the confidence interval may be represented by a bar. If the range of the confidence interval includes the number 1, then the result was not found to be statistically significant. Figure 19-3 is an illustration of the odds ratios from a few studies that looked at short-term mortality in patients with acute myocardial infarction (AMI) and the benefit of starting a medication called an angiotensin-converting enzyme (ACE) inhibitor in these individuals.