and Jose R. Tusell1
(1)
Department of Chemistry and Biochemistry, Montana State University, Bozeman, MT, USA
Abstract
Principles behind quenching of tryptophan (Trp) fluorescence are updated and extended in light of recent 100-ns and 1-μs molecular dynamics (MD) trajectories augmented with quantum mechanical (QM) calculations that consider electrostatic contributions to wavelength shifts and quenching. Four studies are summarized, including (1) new insight into the single exponential decay of NATA, (2) a study revealing how unsuspected rotamer transitions affect quenching of Trp when used as a probe of protein folding, (3) advances in understanding the origin of nonexponential decay from 100-ns simulations on 19 Trps in 16 proteins, and (4) the correlation of wavelength with lifetime for decay-associated spectra (DAS). Each study strongly reinforces the concept that—for Trp—electron transfer-based quenching is controlled much more by environment electrostatic factors affecting the charge transfer (CT) state energy than by distance dependence of electronic coupling. In each case, water plays a large role in unexpected ways.
Key words
TryptophanFluorescenceQuantum yieldLifetimeProteinMolecular dynamicsQuantum mechanicsQM-MMMD + QMElectrostatics1 Introduction and Overview
The use of fluorescence-based methods to study cellular biology at the molecular level of detail has become a rapidly growing billion dollar industry. Most of these methods depend upon changes in the intensity and/or wavelength of light emitted from a probe molecule when a protein or nucleic acid undergoes a functional process.
The aims of this chapter—which involve a unique ability to compute fluorescence intensity and wavelength from first principles—are strongly linked by a common theme: the extraordinary ruggedness of the spatial and temporal electrostatic landscape within proteins is mirrored in the ruggedness of the fluorescence intensity and wavelength landscape of environment-sensitive fluorophores. This is significant because the diversity and strength of electric fields in these biopolymers is increasingly recognized as key to their function as enzymes [1–4]. The ability of enzymes to undergo rapid changes between defined conformations is almost certainly an important part of their overall catalytic activity, because fluctuations to specific reactive conformations are likely at the heart of enzyme specificity and reactivity [5].
Fluorescence generates enormous amount of data that correlates with protein motions. Clearly the ability to compute fluorescence behavior from molecular dynamics (MD) simulations not only points the way towards understanding of the underlying processes but also provides confidence for the same types of computations that can predict enzymatic efficiency.
Our computations over several years have clearly shown that the electrostatic landscape—including solvent—is absolutely the key to predicting fluorescence behavior of environment-sensitive probes [6–25]. Thus, the fluorescence of Trp (and a few other fluorophores) is well poised to help reveal the emerging view of protein dynamic disorder that involves transitions between multiple minima in a rough energy landscape, leading to nonexponential correlation functions [26]. Continued effort in these areas is encouraged by the emerging view that the catalytic power of enzymes is largely due to a specifically oriented, preorganized electrostatic environment, whose energy may come from reduction in folding energy [27]. We have noted on several occasions that an ordered electrostatic environment coupled with large fluctuations is precisely what determines whether fluorescence will be strong or weak, and whether its average wavelength will be short or long. This meshes perfectly with the exciting recent observation by Marcus and others that the nonexponential autocorrelation time behavior of fluctuations of electrostatic interaction energy on time scales as long as milliseconds to seconds at a local site in enzymes is in agreement with measurable dielectric dispersion of enzymes and is in common with single molecule experimental observations of catalysis rate, fluorescence lifetime, and spectral diffusion—all occurring over the time scale of biological importance (milliseconds to seconds) [28, 29].
Such a time scale is mostly unreachable by real-time computational trajectory simulations today, but the millisecond barrier has been broken in one laboratory [30]. Simulations are increasingly able to reveal fine details of biological system function by generating microscopic descriptions of behavior that are experimentally testable [5]. Vendruscolo and Dobson [31] have provided a recent analysis based on Moore’s Law that suggests that within less than 10 years MD simulations will routinely reach the time scale of biological importance.
The ubiquitous nonexponential decay of Trp fluorescence is a direct consequence of its sensitivity to the electrostatic environment. Though often lamented, nonexponential decay may be considered a great asset by virtue of providing a unique window on protein and solvent dynamics that are relevant to the basic function of proteins and is routinely exploited with the aim of gaining insight into solvation dynamics near proteins [32]. The main theme of this chapter is, however, to provide a microscopic view of underlying mechanisms for nonexponential fluorescence decay from Trp in proteins arising from heterogeneity in excited state population decay due to quenching by electron transfer. This is based on much longer (100 ns to 1 μs) MD + QM simulations than have typically been reported in our previous studies. With 2–3 orders of magnitude longer simulations, discrete subpopulations become much more evident, and the variable nature of these populations begins to be seen. This has also led to a new emphasis on the interesting intermediate case in which discrete populations interconvert on the same time scale as the excited state lifetime. In such a case, decay curves may be fit well to two or three exponentials, but the decay constants cannot be attributed to directly as belonging to a physical species.
1.1 Outline
Subheading 2 is a summary of the underlying principles.
In Subheading 3, we present the enigmatic case of what is not nonexponential decay: the pure mono-exponential decay of the fluorescence from N-acetyltryptophanamide (NATA), the most commonly used model for Trp behavior in proteins. A major frustration for several years has been our inability to fathom why NATA exhibits almost purely exponential decay. We introduce a new concept in which quantum yield and lifetime reduction comes about by rare, short-lived, specially solvated forms that have little to do with rotamer state [33, 34].
In Subheading 4, we describe how 1-μs simulations of Trp fluorescence quenching during the folding of the extensively studied, small, fast-folding villin headpiece, lend insight into the efficacy of local Trp fluorescence quenching for reporting the global folding rate [25].
Subheading 5 takes advantage of the recent advances in the speed of MD simulations that allow us to examine 100-ns simulations of fluorescence dynamics from 19 Trps in 16 selected proteins. On this time scale, the proteins begin to exhibit a range of tendencies for transitions between discrete states that affect fluorescence lifetimes and quantum yields [33, 34].
Subheading 6 presents an MD-QM study of cyclic peptides that reveals a universal understanding of how heterogeneity in Trp fluorescence lifetimes almost always gives rise to what we call pseudo-time-dependent fluorescence Stokes shifts (pseudo-TDFSS), a phenomenon arising from what has been a mystifying strong correlation of the wavelength and lifetimes of DAS [17, 24].
Subheading 7 is a synopsis of methods relevant to this chapter.
The long simulations underlying all these topics will help understand how to quantitatively compute fluorescence lifetimes and intensities for proteins that display the type of fluctuations between conformations that are also important in enzyme catalytic activity. A common theme is the importance of water and how Trp fluorescence quenching is almost always controlled by the electrostatically controlled energy gap between the charge transfer (CT) and fluorescing state (1La).
2 Some General Principles Behind Trp Fluorescence Quenching and Spectra
The change in electronic state of environment-sensitive fluorophores accompanying emission of a photon always involves a large instantaneous change in electronic charge distribution. Within a protein or solvent, there are strong Coulombic interactions between the fluorophore electrons and all the atoms of the protein, which means that the energy of the emitted photon will depend sensitively upon the changed positions of the electrons in the fluorophore relative to those of the protein. Several quantum mechanical studies unanimously predict that the ground → 1La state involves a large change in permanent dipole moment arising from electron density shifting from the pyrrole ring to the benzene ring of the indole moiety [8]. QM-MD simulations found good correlation of predicted and experimental Trp fluorescence wavelengths, assuming that 1La was always the emitting state [10]. Subsequent fluorescence anisotropy experiments demonstrated that even for the extremely blue-shifted, structured fluorescence from Trp 48 of azurin, the emission is 100 % from 1La [35]. Only Trp 72 of the M97V mutant of transhydrogenase has been reported to emit partly from the 1Lb state [36].
Much the same may be said about the energy difference between the 1La state and the CT state. Quenching rate and wavelength shift are caused by the same phenomenon acting on different electronic states: wavelength is determined by the position of charges acting on the electron density difference between the ground and fluorescing state; quenching is determined by the position of charges acting on the electron density difference between the fluorescing state and a CT state. The most common CT states active in quantum yield reduction of Trp in proteins involve electron transfer from the indole ring to one of two nearby backbone amides. While this is the focus of this chapter, quenching by a nearby histidine cation is featured in Subheading 4.
No two single-Trp proteins will have exactly the same fluorescence λ max, quantum yield (Φf), and decay profile. That is because the average surrounding atomic configuration for a Trp in a given protein will be unique to that protein. We have constructed a relatively simple scheme that is reasonably successful for understanding and predicting the main properties of Trp fluorescence quantum yields and lifetimes [9, 11–16, 18–25]. The fluorescence quantum yield is estimated with

where k r is the radiative rate constant, k nr is the nonradiative rate constant in the absence of electron transfer. The electron transfer rate constant, k et,i (t), includes time dependence and the possibility of heterogeneity with the subscript i indicating “species” i.

(1)
Typically k r = 4 × 10⁷ s−1 and k nr = 9 × 10⁷ s−1for 3-methylindole (3MI) in aqueous solution [37]. The corresponding fluorescence decay times (τ f,i ) are estimated as


(2)
All variability in τ fi and Φfi comes from k et,i (t). k r and k nr are considered effectively constant in comparison to k et,i (t), which is found to fluctuate rapidly with high amplitude, and is the primary source of quantum yield variability and lifetime heterogeneity. Although proton transfer quenching may be a possibility, there has been little convincing evidence for this outside of free Trp in solution and has not been considered in our predictions to date.
Most generally k et(t) is computed from the Fermi golden rule expression (see Subheading 7), which is proportional to the product of the square of the electronic coupling matrix element, V et 2, and the Franck–Condon-weighted density of states (FCDS). The FCDS (i.e., number of states in resonance with the fluorescing state), ρ(ΔE 00), a function of the separation of CT and 1La state zero point energies, ΔE 00, (which will be often referred to here as the “energy gap”). Details of how these are calculated are addressed further in Subheading 7 and elsewhere [23–25].
We note that the golden rule, which is derived from first-order time-dependent quantum mechanics under certain approximations that are usually reasonable, underlies a vast number of phenomena besides electron transfer, e.g., absorption of light by atoms and molecules, and Förster resonant energy transfer (FRET).
A primary thesis of this chapter is that quantum yield and lifetime for Trp in proteins are almost always dictated by the CT-1La energy gap. This is so for three reasons: (1) only the two nearest backbone amides are significant quenchers, (2) the amide CT states are almost always at considerably higher energy than the 1La state, and (3) V et is so large for the two local amides that the quenching is very high during brief periods of resonance. In other words, the rate limiting step in quenching is waiting for a fluctuation that creates resonance, not the speed of the V et controlled rate of quenching during the times of resonance. The reason quenching is dominated by the two nearest amides is due to the ~1 eV greater electrostatic stabilization due to the attraction of the negatively charged amide and positively charged indole ring in the CT state compared to more distant amide CT states.
The energy gap is essentially the difference in electric potential energy for an electron in the excited ring and one in the empty orbital localized on the C of the amide. This is another way of saying that the fluorescing state and the CT state must have the same energy or electron transfer cannot happen.
Alternatively, this may be stated in terms of the electric field direction. If an electron experiences a field that forces it from the ring to the amide, electron transfer will require less energy. For example, a positive charge near the amide of Trp and/or a negative charge near the Trp ring will create a smaller energy gap than will the opposite case (a negative charge near the amide and/or a positive charge near the ring). Therefore, hydrogen bonding to the oxygen of the Trp amide nearly always reduces the energy gap (whether by participation in a helix or beta sheet or by water accessibility) [14, 20, 21, 23]. Although hydrogen bonds are particularly effective, this principle applies quite generally to all surrounding atoms with a significant partial charge. In particular, oxygen atoms of carbonyl, carboxylate groups, and water, when close to the Trp ring, stabilize the CT state.
Given these electrostatic guidelines, there can be little doubt that different rotameric configurations of Trp could plausibly have different energy gaps and therefore different quenching rates by the local amide, but we will see that rotamer variation is not the only mechanism to achieve a low-energy gap.
2.1 Interaction
Ab initio calculations have provided quite large values for the electronic coupling, V et, for electron transfer between the Trp ring and amide [18]. When χ 1 ≈ −60°, V et is always close to 900 cm−1 and never reaches zero. In contrast, a χ 1 of either 60° or ±180° yields a |V et| that fluctuates from 0 to 400 cm−1. Either of these couplings are so strong that at any distance possible for the two amides, the quenching rate would be ~1012 s−1 for an activationless (resonant) process. This is obviously not the case because it would lead to a quantum yield ~1 × 10⁻⁴. If the energy gap did not matter, no Trp would fluoresce in proteins. Figure 1 shows the average V et for 19 different single-Trp proteins in 16 different protein environments. The magnitude of V et is determined for the most part by the χ 1 dihedral angle. It is seen that there is no correlation of quantum yield with V et.
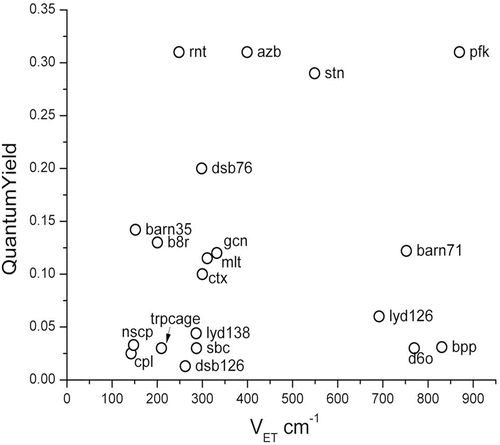

Fig. 1
Plot of observed quantum yield vs. average root mean square of electron transfer coupling element, illustrating the lack of correlation. This is because the electrostatically modulated CT-1La energy gap is usually the controlling factor
3 Why NATA Has Single Exponential Decay: It Is the Water
A main theme of this chapter is to provide a view of underlying mechanisms for nonexponential fluorescence decay from Trp in proteins, based on MD + QM simulations. We begin with a spectacular case of what is pure mono-exponential decay: the fluorescence decay from N-acetyltryptophanamide (NATA). A major frustration for several years has been an inability to understand why NATA exhibits almost purely exponential decay using MD + QM methods. Recent near microsecond simulations have confirmed earlier observations that the short lifetime and low quantum yield relative to the unquenched 3MI is caused by rare solvation events [25, 34].
Figure 2 shows QM-computed amide CT (black) and 1La (red) transition energies during a 600-ns MD simulation. The main feature to notice from this figure is the rare outlying excursions of the CT energy to exceptionally low values. These appear to lie outside the normal Gaussian distribution. The top panel of Fig. 3 shows how the all important energy gap (the difference between the two curves of Fig. 2) fluctuates in time during this 600-ns simulation. The second panel shows how the excited state lifetime varies with time, as computed by the Fermi rule, in which the energy gap is the controlling factor. The most extreme downward fluctuations of the energy gap due to large stabilization by water are seen to correspond exactly to high quenching rates that compete with the unquenched rate (~1.2 × 10⁸ s−1). This is illustrated graphically in Fig. 4. Similar simulations in which coordinates are saved at 2 fs intervals show that these excursions typically form and dissolve in ~50 fs, i.e., the inertial response time of water molecules in liquid water [38]. The lower three panels of Fig. 3 plot the three dihedral angles of importance showing that all rotamers are significantly populated. Careful examination shows virtually no correlation with the extreme quenching events. The C-terminal amide is overwhelmingly the site of electron transfer, regardless of rotamer.
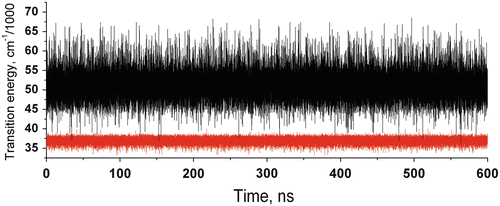
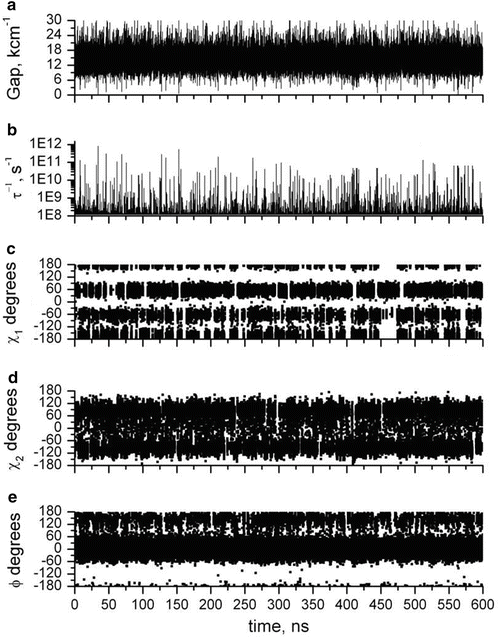
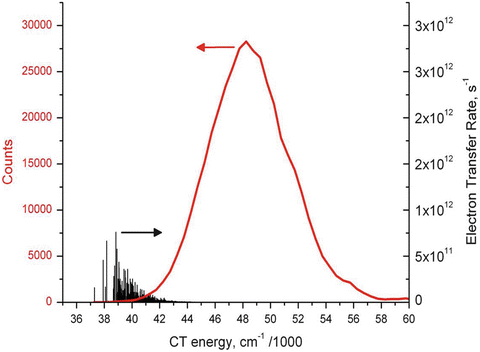

Fig. 2
600-ns MD + QM trajectories of 1La (red) and lowest CT state (black) transition energies of NATA in water showing extreme downward fluctuations (small energy gap) of the CT state caused by super stabilization by water that are primarily responsible for the lower fluorescence quantum yield and lifetime of NATA relative to 3-methylindole

Fig. 3
600-ns MD + QM trajectories for NATA in water of properties related to the single exponential decay. (a) CT-1La energy gap in thousands of cm−1. (b) Instantaneous fluorescence decay rate, showing the rare extreme decay rates from quenching by electron transfer to the amide CT state. (c–e) Trajectories of the χ 1, χ 2, and Ψ dihedral angles, respectively, showing numerous rotamer state transitions. The high quenching rates seen in panel b do not correlate with rotamer state

Fig. 4
Distribution of instantaneous CT state energies (in cm−1) calculated from QM, and the corresponding instantaneous electron transfer rate constants (vertical black lines) derived from a 600-ns MD + QM trajectory. Most of the electron transfer happens during fluctuations in solvation stabilization that shift the instantaneous CT energy to low energies close to that of 1La. This reveals the basic explanation for the single exponential decay fluorescence decay for NATA
These simple observations suggest a picture that more naturally explains the observed single exponential decay than the traditional rotamer-based correlation with distance of the amide from the ring. To better understand how this new picture robustly predicts single exponential decay, we summarize the pertinent aspects of a generalized solution of the kinetic equations describing fluorescence decay [25, 39–41].
3.1 Theory
In general, the nature of the heterogeneity predicted from the simulations has a profound effect on how quantum yield and lifetime is to be calculated. Two “species” are identified, one designated “F” in which the energies of the CT and 1La states are too far apart for effective quenching and one designated “C” in which the energies of the CT and 1La states are close, for which fluorescence is strongly quenched by electron transfer to an amide. There are two obvious extremes. When interconversion between the rapidly quenched C species and slowly quenched F species is much slower than the fluorescence lifetime of either species, the quantum yield is given simply by the average of the individual quantum yields

where f C and f F are the fractions of time spent in the close and far conformations. At the other extreme, when the two species exchange at rates much faster than the fluorescence decay rate, the quantum yield becomes


(3)

(4)
Even when f C << f F, if k et,C is large enough, the quantum yield can become very small according to this equation.
Our simulations on NATA in water show a fast mean exchange rate between the two populations because the stabilized CT states persist typically for only ~100 fs. This means that the environment of the excited molecule will be a hybrid of the two pure species and that the equilibrium between the two species will be perturbed because the rapidly depleted close species will be replenished by the fast exchange process. This effect, which is not given by Eqs. 3 and 4, represents a condition under which the two limits just mentioned will be in considerable error. In this intermediate region, we expect to see two decay constants that are not the pure lifetimes of each of the species, a consequence of the environment changing during the excited state lifetime. This can be seen from a simple compartmental analysis consisting of the F and C species, connected by rate constants shown in Fig. 5. In this scheme, it is not necessary to include the ground states, because the excitation process is assumed to have already occurred at time zero. It is implicit that the disappearance of the excited species means return to the ground state, whose population has no effect on the excited state dynamics in our simplified scheme, wherein the exchange rates between the two species is independent of electronic state.
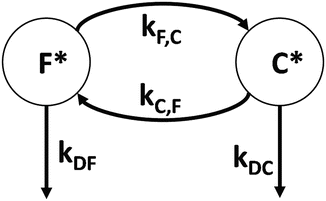

Fig. 5
Simple compartmental scheme consisting of the slow decaying, far-apart energy gap (F) species and fast decaying, close-together energy gap (C) species, which exchange by rate constants k CF (C → F, slow), k FC (F→C, fast), k DC (fast), and k DF (slow)
This type of analysis has been used in numerous applications to multiple fluorescent species with somewhat different focus and emphasis [40, 42, 43]. The decay rates out of the two excited species are

where k r, k nr, k et,F, and k et,C are the radiative, nonradiative, and electron transfer rate to amide in the far and close states. The coupled rate equations generated from the scheme in Fig. 5 are shown in Eq. 6.
![$$ \left[\begin{array}{lll} {-\frac{\mathrm{ d}\mathrm{ C}}{{\mathrm{ d}t}}} \\{-\frac{\mathrm{ d}\mathrm{ F}}{{\mathrm{ d}t}}}\end{array}\right]=\left[\begin{array}{ll}({k_{\mathrm{ C},\mathrm{ F}}}+{k_{\mathrm{ DC}}}){-{k_{\mathrm{ F},\mathrm{ C}}}}\\{-{k_{\mathrm{ C},\mathrm{ F}}}}({k_{\mathrm{ F},\mathrm{ C}}}+{k_{\mathrm{DF}}})\end{array}\right]\left[\begin{array}{ll}\mathrm{ C}\\\mathrm{ F} \end{array}\right] $$](/wp-content/uploads/2017/03/A299540_1_En_8_Chapter_Equ00086.gif)

(5)
![$$ \left[\begin{array}{lll} {-\frac{\mathrm{ d}\mathrm{ C}}{{\mathrm{ d}t}}} \\{-\frac{\mathrm{ d}\mathrm{ F}}{{\mathrm{ d}t}}}\end{array}\right]=\left[\begin{array}{ll}({k_{\mathrm{ C},\mathrm{ F}}}+{k_{\mathrm{ DC}}}){-{k_{\mathrm{ F},\mathrm{ C}}}}\\{-{k_{\mathrm{ C},\mathrm{ F}}}}({k_{\mathrm{ F},\mathrm{ C}}}+{k_{\mathrm{DF}}})\end{array}\right]\left[\begin{array}{ll}\mathrm{ C}\\\mathrm{ F} \end{array}\right] $$](/wp-content/uploads/2017/03/A299540_1_En_8_Chapter_Equ00086.gif)
(6)
These coupled equations are solved by standard procedures [39–41] after finding the eigenvalues of the matrix. The reciprocals of the two eigenvalues are the two exponential decay times describing the relaxation and decay of the coupled excited species and are given by
![$$ {\lambda_{\pm }}=\frac{{({k_{\mathrm{ F},\mathrm{ C}}}+{k_{\mathrm{ DF}}})+({k_{\mathrm{ C},\mathrm{ F}}}+{k_{\mathrm{ DC}}})}}{2}\pm \sqrt{{\left[ {\frac{{({k_{\mathrm{ F},\mathrm{ C}}}+{k_{\mathrm{ DF}}})-({k_{\mathrm{ C},\mathrm{ F}}}+{k_{\mathrm{ DC}}})}}{2}} \right]^2+{k_{\mathrm{ F},\mathrm{ C}}}{k_{\mathrm{ C},\mathrm{ F}}}}} $$](/wp-content/uploads/2017/03/A299540_1_En_8_Chapter_Equ00087.gif)
![$$ {\lambda_{\pm }}=\frac{{({k_{\mathrm{ F},\mathrm{ C}}}+{k_{\mathrm{ DF}}})+({k_{\mathrm{ C},\mathrm{ F}}}+{k_{\mathrm{ DC}}})}}{2}\pm \sqrt{{\left[ {\frac{{({k_{\mathrm{ F},\mathrm{ C}}}+{k_{\mathrm{ DF}}})-({k_{\mathrm{ C},\mathrm{ F}}}+{k_{\mathrm{ DC}}})}}{2}} \right]^2+{k_{\mathrm{ F},\mathrm{ C}}}{k_{\mathrm{ C},\mathrm{ F}}}}} $$](/wp-content/uploads/2017/03/A299540_1_En_8_Chapter_Equ00087.gif)
(7)
In the slow exchange limit, λ + and λ − are simply the fast and slow decay components, k DC and k DF of the true species. In the fast exchange limit, λ + approaches k F,C + k C,F, i.e., the relaxation rate constant for equilibration between the two species while λ − approaches the equilibrium average of k DF and k DC. These limiting rates give the quantum yields expressed in Eqs. 3 and 4 as a function of the relative populations. In the intermediate cases, the averaging is stochastic. The eigenvectors represent deviations from equilibrium concentrations that will decay exponentially. The initial concentrations may be decomposed into a linear combination of the eigenvectors, depicted here as c F+, c F−, c C+, and c C−, which are the projections of the eigenvectors on the ground-state equilibrium concentrations established by the equilibrium constant given by the ratio of the exchange rates. We assume for simplicity that the exchange rates between F and C are the same in the ground and excited states.


(8)

(9)
The quantum yield is then equal to
![$$ \begin{array}{lll}\Phi ={k_{\mathrm{ r}}}\int\limits_0^{\infty } {\left[ {({c_{{\mathrm{ F}+}}}+{c_{{\mathrm{ C}+}}}) \exp(-{\lambda_{+}}t) + ({c_{{\mathrm{ F}-}}}+{c_{{\mathrm{ C}-}}}) \exp(-{\lambda_{-}}t)} \right]\mathrm{ d}t} \cr ={k_{\mathrm{ r}}}\left\{ {\frac{{({c_{{\mathrm{ F}+}}}+{c_{{\mathrm{ C}+}}})}}{{{\lambda_{+}}}}+\frac{{({c_{{\mathrm{ F}-}}}+{c_{{\mathrm{ C}-}}})}}{{{\lambda_{-}}}}} \right\} \hfill \\\quad ={k_{\mathrm{ r}}}\left\{({c_{{\mathrm{ F}+}}}+{c_{{\mathrm{ C}+}}}){\tau_{+}}+({c_{{\mathrm{ F}-}}}+{c_{{\mathrm{ C}-}}})\right\}{\tau_{-}} \hfill \\\end{array} $$](/wp-content/uploads/2017/03/A299540_1_En_8_Chapter_Equ000810.gif)
![$$ \begin{array}{lll}\Phi ={k_{\mathrm{ r}}}\int\limits_0^{\infty } {\left[ {({c_{{\mathrm{ F}+}}}+{c_{{\mathrm{ C}+}}}) \exp(-{\lambda_{+}}t) + ({c_{{\mathrm{ F}-}}}+{c_{{\mathrm{ C}-}}}) \exp(-{\lambda_{-}}t)} \right]\mathrm{ d}t} \cr ={k_{\mathrm{ r}}}\left\{ {\frac{{({c_{{\mathrm{ F}+}}}+{c_{{\mathrm{ C}+}}})}}{{{\lambda_{+}}}}+\frac{{({c_{{\mathrm{ F}-}}}+{c_{{\mathrm{ C}-}}})}}{{{\lambda_{-}}}}} \right\} \hfill \\\quad ={k_{\mathrm{ r}}}\left\{({c_{{\mathrm{ F}+}}}+{c_{{\mathrm{ C}+}}}){\tau_{+}}+({c_{{\mathrm{ F}-}}}+{c_{{\mathrm{ C}-}}})\right\}{\tau_{-}} \hfill \\\end{array} $$](/wp-content/uploads/2017/03/A299540_1_En_8_Chapter_Equ000810.gif)
(10)
3.2 Results
Keying on the MD + QM trajectories shown in Fig. 2, we discovered that treating the smaller, rapidly quenched population as “species” C and the remainder as F gives a robustly single exponential decay, for a model wherein k F,C remains constant at ~109 s−1, providing k DC ≅ k C,F is ≥ k F,C. This is shown in Fig. 6 for the case in which k F,C = 0.4 × 10⁹ s−1, a choice that gives Φf = 0.135 and a nearly single exponential decay with τ f = 3 ns over the range of k DC = k C,F = 1 × 10¹⁰ to 1 × 10¹² s−1 with essentially undetectable amounts of the shorter lifetime component, i.e., in close agreement with experiment.
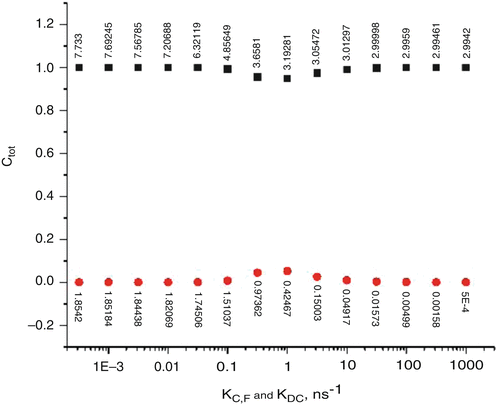

Fig. 6
Transition from slow exchange limit (pure heterogeneity) to the fast exchange limit as function of log10(k C,F). k C,F is the rate of exchange from the “C” to the “F” species and is held equal to k DC, the rate of decay of the excited state for the “C” species to the ground state, as shown in Fig. 5. The vertical axis gives the fractional amplitudes of the long-lifetime (upper curve, filled squares) and short-lifetime (lower curve, circles) exponentials, whose corresponding lifetimes in nanosecond are shown as numbers attached to the points. Note that in the presence of interconversion between the species, there is no direct correspondence between the “species” and the “lifetimes.” As the exchange rate increases, the two lifetimes evolve ultimately to a single average lifetime that applies to both species and an extremely fast transient corresponding to establishing a steady state following a delta function excitation pulse
3.3 Discussion
We now discuss the considerable difference between the longstanding, well-reasoned hypothesis by Petrich et al. [44] for the single exponential decay observed for NATA. Petrich et al. argue from a common point of view in which the electron transfer rate is controlled entirely by the electronic coupling matrix element V et, i.e., ignoring entirely consideration of the density of states (resonance factor) of the Fermi rule. Then, because V et is known to fall off exponentially with distance, the qualitative argument becomes one of comparing distance from the indole ring to the two amides. The basis of the argument was that in NATA, the three χ 1 rotamers all have the carbonyl carbon equidistant from the indole nitrogen and would therefore not display heterogeneity.
Our simulations, however, paint a completely different picture—one in which distance plays no role at all, and the resonance (density of final states) is the only variable that matters. This is because of the weak electron accepting nature of the amide (recall that formamide and acetamide do not quench the indole ring in water) [45–48]. In fact, as noted above, the coupling is so strong (200–800 cm−1) that at any distance possible for the two amides the quenching rate would be ~1012 s−1, corresponding to a quantum yield of ~1 × 10⁻⁴.
In our view, strong quenching comes about only during transient random solvation events that greatly stabilize the CT state of one amide or the other through favorable electrostatic interaction with water. These rare (~1 %) fluctuations are essentially independent of rotamer and are usually characterized by having two or three water molecules donate hydrogen bonds to the carbonyl O of the electron accepting amide. Other waters add stabilization by having their dipoles point in a direction that stabilizes the CT state. In these solvation events, on the order of 100 water molecules within 10 Å of the NATA molecule typically contribute a net stabilization of −8,000 to −16,000 cm−1 (1–2 eV), about two thirds of which are stabilizing. Figure 4 shows a superposition of the distribution of CT-1La energy gaps and a histogram of corresponding k et values, demonstrating how only the low-energy tail of the distribution contributes to the quantum yield reduction.
Rolinski et al. have reported that a single exponential fit for NATA fluorescence gives unacceptably high χ 2 values (>1.4) [49] and find a reasonable fit from a maximum entropy method using gamma function distributions peaking at 3.0 with ~0.6-ns FWHM at 300 K, which they attribute to a single rotamer. We find that there is a mixture of rotamers that interchange on a time scale similar to the excited state lifetime. A narrow distribution of exponentials seems consistent with our simulations. Our choice to arbitrarily assume only two species in our analysis is obviously over simplified, and dividing the classes of rates in many different species could plausibly lead to such a distribution.
4 Simulations of Trp Fluorescence During Folding of the Villin Headpiece
Both Trp fluorescence and molecular dynamics have been increasingly exploited to study the rate of protein folding/unfolding [50, 51]. One of the purposes of developing the ability to predict quenching rates has been to help verify or disprove the many hypotheses that are generated from the results of experimental and theoretical studies on protein folding. Such an application was recently carried out [25] for the highly studied, fast-folding C-terminal domain of the villin headpiece mutant HP35 N27H (villin), wherein Trp is stacked on a histidine cation (a potent quencher by electron transfer [37, 52, 53]) in a helix when folded. This mutant was designed by Eaton and coworkers [54, 55] to follow the folding by the quenching of the Trp fluorescence in the folded state. The left panel of Fig. 7 shows the stacked structure as it appears in the X-ray structure. In this section, we describe how several 1-μs simulations on villin unexpectedly revealed that only a transient, closely stacked structure shown in the middle panel of Fig. 7 appears to quench significantly enough to produce the changes in quantum yield seen experimentally during folding [25].
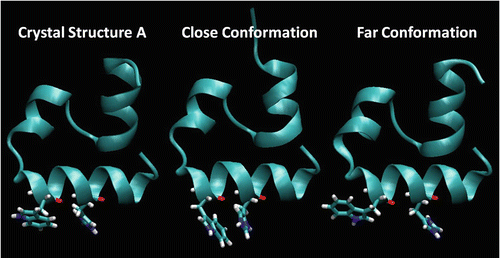

Fig. 7
Comparison of the X-ray structure (1YRF “A”) with representative “close” and “far” conformations showing Trp23 and His27 relative conformations taken from a 1-μs MD simulation of villin HP-35 at 300 K in explicit TIP3P water using the AMBER99SB-ILDN force field. The X-ray structure on the left and the structure on the right are the two main “far” conformations, neither of which we believe allows significant quenching. The “close” (center) conformation is reached only transiently when χ 1 is ~180° and χ 2 is ~+90° and is the only conformation for which we believe quenching is possible. Most of the trajectory is spent in the X-ray conformation, for which we believe quenching is not possible or is minor
In this seemingly very different setting, there is a striking parallel to the behavior of NATA; a minor species dominates the quenching, and it is solvation energy affecting energy gap that makes the minor species so easily quenched.
Because protein folding naturally would take a Trp in the protein through an astronomical number of environments, one can legitimately wonder how dynamic changes in fluorescence quantum yield could be a faithful measure of folding dynamics. Indeed, viability of Trp fluorescence as an indicator of global folding rate was recently brought into question in the comparison of simulated and experimental folding rates wherein classical MD simulations predict folding times that are several microseconds longer [56, 57] than experiment [51, 58, 59]. MD simulations suggested that the helix containing the Trp-His+ is formed much before the final folded structure is achieved [56, 57]. On the other hand, recent alternative experiments supported the ability of Trp fluorescence to report the global folding rate [59, 60].
4.1 Results
Figures 8 and 9 show trajectories of properties computed from two of four ~1-μs MD simulations performed on the villin head piece with explicit water involving an eclectic sample of mutants, force fields, and temperatures [25]. Figures 8a and 9a show trajectories of the distance between the Trp23 and His+27 centroids of mass (COM) derived from simulations on two different mutants. This distance is naturally considered the best single indicator of the quenching rate of Trp fluorescence by His+ [56, 57]. All trajectories exhibited a similar behavior, marked by several regions of discrete inter-residue distance. Most striking and significant is the small percentage of time for which the closest distance (~4 Å) is visited during the trajectories of folded villin—while the Trp-His + local structure is helical 100 % of the time according to backbone RMSD and inspection of structures. We find that in all cases, the close distance state arises solely through a concerted χ 1 and χ 2 transition, an example of which is shown in Figs. 9b, c. The close conformation is achieved only if χ 1 is ~180° and χ 2 is ~+90°. The vast majority of the time χ 1 is ~+60° and χ 2 is ~−90° (left panel of Fig. 7).
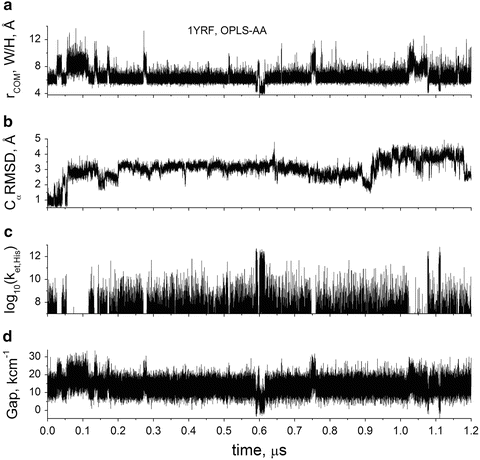
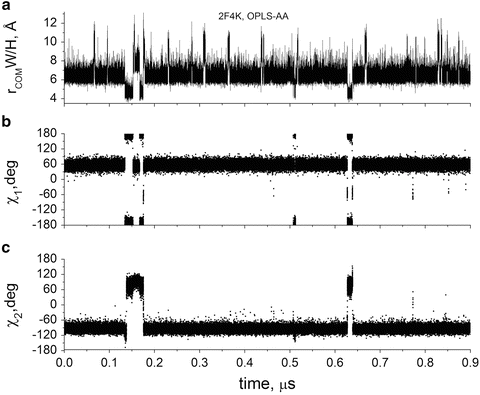

Fig. 8
1 μs simulation of HP35(N27H+) with OPLS-AA force field. (a) Center of mass (COM) distance between Trp (W) and His+ (H) rings, (b) Cα RMSD relative to crystal structure (1YRF), (c) calculated electron transfer rate, s−1, for quenching by His+, and (d) CT(His+)-1La energy gap from MD + QM. Note the significant correlation between distance, rate, and energy gap, but that there is no correlation between RMSD and quenching ability for His+. In this simulation, quenching occurs only during the brief periods in which a rotamer switch brings the center of mass of the rings within <5.5 Å (the center picture in Fig. 7)

Fig. 9
0.9 μs simulation of HP35(N27H+,K24Nle,K29Nle) with OPLS-AA force field showing correlation with Trp dihedral angles, χ 1 and χ 2. As in Fig. 8, quenching occurs only during the brief periods in which a rotamer switch brings the center of mass of the rings within <5.5 Å. (a) Center of mass (COM) distance between Trp (W) and His+ (H) rings, (b) Trp23 χ 1 vs. time, (c) Trp23 χ 2 vs. time
Figure 8c shows how the computed quenching rate constant varies with time during the trajectory. Note the strong correlation of Trp-His+ distance with quenching rate. For reference, if the quenching rate drops below 1 × 10⁷ s−1, there is negligible effect on the quantum yield. Figure 8d shows that the important energy gap between the CT and 1La states has an unexpected strong correlation with Trp-His+ distance. Further analysis revealed that the source of the strong correlation lies primarily in a large change in solvation energy at short distance compared to longer distances. At large separation, the vertical CT energy immediately after electron transfer is highly destabilized by the polarization of the water oriented by His+ prior to electron transfer. The negative oxygen atoms of water are mostly in close contact with the His+. This destabilization decreases sharply when the separation is small enough to exclude water in the region between the donor and acceptor. The energy gap is the key variable in the Franck–Condon-weighted density of states (FCDS) (the overlap of the photoelectron spectrum for removal of an electron from the ring and that for adding an electron to the amide, in units of states per cm−1) which in turn is a major factor in the Fermi rule for the electron transfer rate and is a measure of the extent of resonance of the CT state with the emitting state. (This is precisely analogous to the overlap of acceptor absorption spectrum with donor emission spectrum in FRET.) Figure 10 shows how the FCDS and, accordingly, the Fermi rule-computed electron transfer rate constant drop sharply by 3 orders of magnitude as the Trp-His+ distance increases from 4 to 5.5 Å. Figure 10 also shows that in this distance range, the average square of electronic coupling in the Fermi rule was computed to change very little, contrary to usual assumptions and experimental findings at larger distances. Similar deviation at short distance has been reported previously [61, 62].
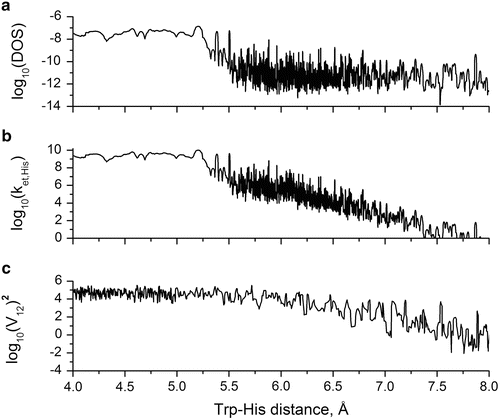

Fig. 10
Log10 plot vs. Trp-His+ center of mass distance of (a) Franck-Condon-weighted density of states, in units of states per cm−1 (FCDS), (b) Fermi rule-calculated electron transfer rate constant for Trp → His+ in units of s−1, and (c) square of electron transfer Hamiltonian matrix element (V et) for coupling fluorescing and histidine CT state in units of (cm−1)2
The picture that emerges from the results presented above is that quenching by His+ happens almost exclusively at the closest distance. The duration of the close state was found to be on the order of the excited state lifetime of Trp, meaning that fluorescence intensity will exhibit heterogeneity. In other words, there are in effect two species: as in NATA, one which is not quenched and for which the CT state is far above the fluorescing state (which happens to be when Trp and His are far apart) and one which is highly quenched in which the CT state energy is close to that of the fluorescing state (which happens to be when the Trp and His are close in distance). This is seen in Fig. 10 by realizing that when the distance exceeds ~5.2 Å, the effect of His+ quenching drops below 107 s−1 and becomes negligible compared to amide quenching and the non-electron transfer decay channels.
The current assumption by experimentalists and computationalists alike is that when the region encompassing these two residues is helical, there will be significant quenching, but no quenching otherwise. Because of the isomorphism with the NATA fluorescence decay kinetics, Eqs. 5–10 may be applied directly to the villin case. Using a combination of the MD simulations and experimental fluorescence behavior of Trp in barnase, which is also quenched by His+, it was possible to show that a model consistent with Fig. 10 accounts for the small increase in quantum yield observed upon unfolding. Unlike the NATA case, the exchange dynamics between the F and C species is in the slow limit, and it is reasonable to consider them as true species. The ratio of the exchange rate constants provides the equilibrium constant for the F–C process and cannot be accurately determined from the simulations.
Stay updated, free articles. Join our Telegram channel

Full access? Get Clinical Tree


