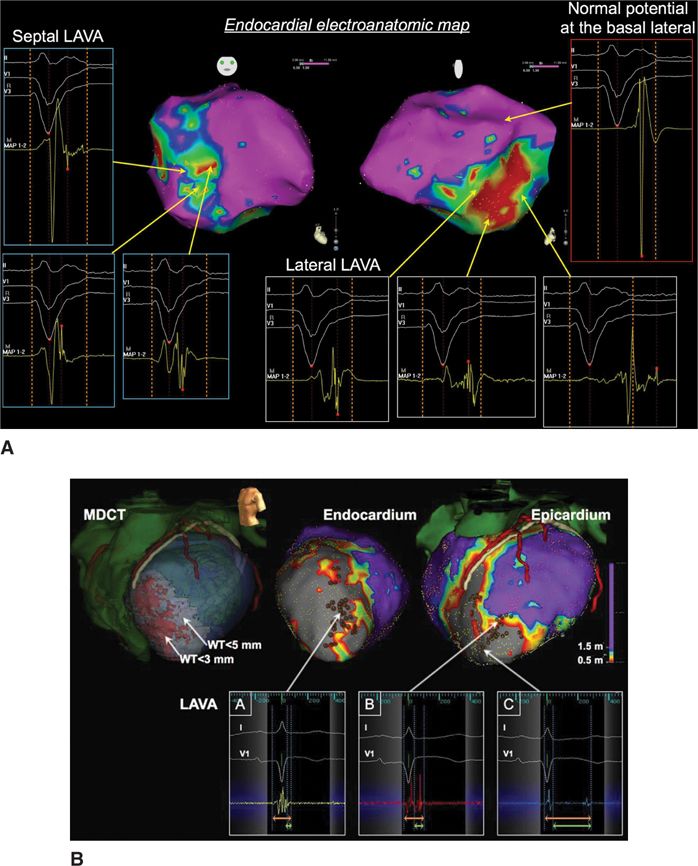
FIGURE 21-1 (A) Late LAVA lateral and early LAVA septal. (B) Earlier LAVA endocardial and later LAVA epicardial. This also illustrates the longest delays in the dense scar. Reproduced with permission from Komatsu Y, Daly M, Sacher F, et al. Electrophysiologic characterization of local abnormal ventricular activities in postinfarction ventricular tachycardia with respect to their anatomic location. Heart rhythm : the official journal of the Heart Rhythm Society 2013:Nov;10(11):1630-1637.
PREPROCEDURAL IMAGING AND LAVA CHARACTERISTICS
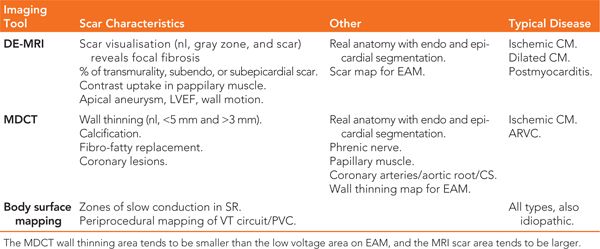
Preprocedural imaging can help identify a scar region through delayed gadolinium enhancement on magnetic resonance imaging (DE-MRI), or wall thinning using multidetector CT (MDCT), indicating the need for epicardial access and preventing potential complications by accurate localization of the coronaries and the phrenic nerve. Scar identified as DE-MRI and wall thinning on MDCT scan are well correlated with the low voltage area on the EAM system and the appearance of LAVA6. DE-MRI is ideal to depict the scar versus healthy myocardium, except in the presence of ICD, which precludes good quality images. This is why MDCT can be used as a surrogate, especially when wall thinning is present at the scar area. Different image possibilities are shown in Table 21-2. LAVA probability differs by disease entity. In ischemic cardiomyopathy (ICM) we observed LAVA predominantly endocardially, with epicardial involvement depending on the degree of transmurality. Ninety percent of LAVA is seen in zones with wall thinning of <5 mm with very late LAVA occurring almost exclusively in a <3 mm wall thinning area.7 No LAVAs are seen >20 mm outside the scar border zone, and most LAVAs appear in the border zone.6,7 Nonischemic cardiomyopathy (NICM) is a more heterogeneous entity. Dilated cardiomyopathy (DCM) shows most LAVA perivalvular. Postmyocarditis patients typically present with only epicardial LAVA and complete normal endocardial mapping.7 Arrhythmogenic right ventricular cardiomyopathy (ARVC) shows most LAVA at the epicardial site with some endocardial LAVA because of wall thinning.
TABLE 21-2 Preprocedural Imaging
TECHNIQUES TO UNMASK LAVA
The signal recorded with a mapping catheter is always a combination of far-field and near-field potentials. Figure 21-2 shows the difference between far-field and near-field signals. In order to unmask local abnormal activity, several different pacing techniques can be used, as explained in Table 21-3.
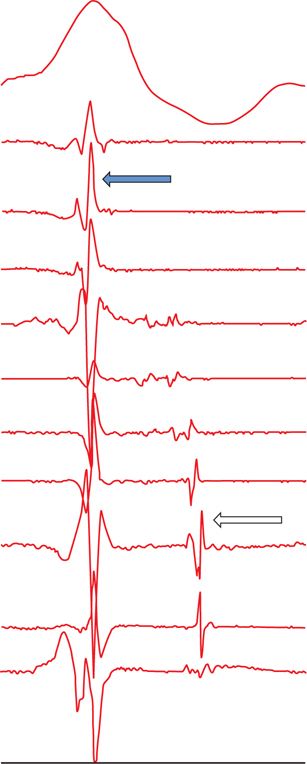
FIGURE 21-2 Differentiation between far-field and near-field signals: ECG shows ventricular QRS signal. Multipolar catheter recording shows far-field and near-field signals. Far-field signals are synchronous, of higher amplitude, have lower dV/dT (black arrow). In contrast, near-field signals are delayed as they are generated by local, poorly coupled surviving bundles (white arrow). They have sharper dV/dT and lower amplitude.
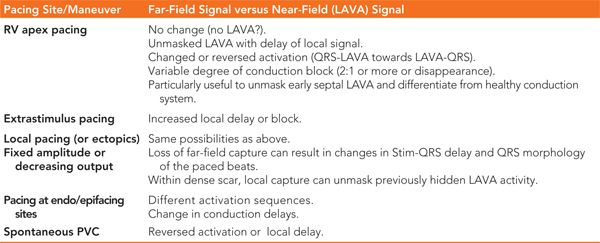
TABLE 21-3 Techniques to Unmask LAVA Activity
MAPPING OF LAVA DURING SR OR VT
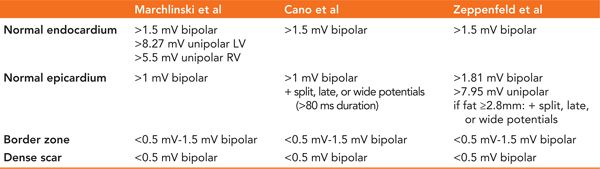
In sinus rhythm, most centers perform automatic substrate mapping with an electroanatomic mapping (EAM) system. Different cut-offs for normal and abnormal myocardium are used in unipolar or bipolar mode. Epicardial fat can make epicardial substrate mapping more difficult; it can mimic low voltage areas but will not show fragmentation or delayed activation. Therefore, some centers include special EGM characteristics together with low voltage as criteria for defining scar regions such as wide, split, late, and fragmented signals to the low voltage area.8 True intramural or septal scar can be difficult to identify and preprocedural imaging, pacing maneuvers (delayed transmural conduction time [>40 ms] and fractionated, late, split, and wide [>95 ms] potentials on the left-sided septum during RV pacing), and/or unipolar voltage map (<8.3 mV unipolar septal mapping from inside the LV) can be helpful.8–14 It is our practice to create a high density endocardial (and epicardial) substrate-based voltage map with special annotation of all LAVA points and sites with good pace-maps. We perform automatic mapping in most ICM patients, but in NICM, we tend to manually adapt the substrate map toward the near-field (LAVA) signal in order to create better scar delineation, especially during epicardial mapping, as automatic bipolar and unipolar mapping can be normal in those cases. Some operators change the color scale of the substrate map to visualize (critical or bystander) channels.15
During VT, activation mapping and entrainment mapping is performed. In certain cases, LAVA can be recorded during the whole VT cycle length to define the entire VT circuit and isthmus (Figure 21-3). Ideal ablation sites are within the critical isthmus with demonstration of mid-diastolic LAVA, concealed entrainment with PPI-TCL<30 ms, Stim-QRS interval >40 to 70 ms, and cessation of VT during ablation. But ablation would be continued after VT termination to reach the end point of LAVA elimination.
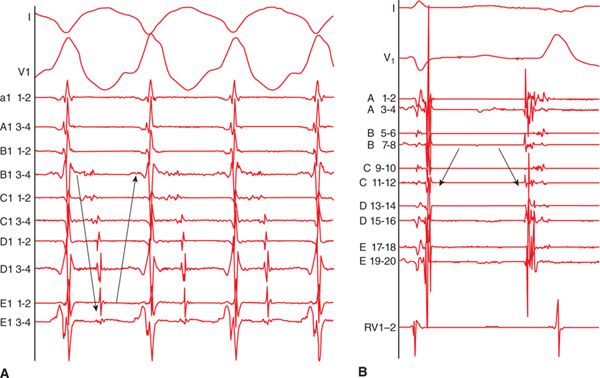
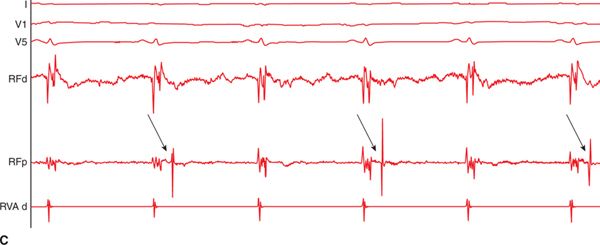
FIGURE 21-3 (A) Multipolar mapping of LAVA covering almost whole cycle length during VT. (B) Reversed activation sequence between sinus beat and ectopic beat. (C) 2:1 block of a LAVA signal.
ABLATION OF LAVA
Over the years, different VT ablation strategies have been investigated: circular lesions around the whole scar, lines to connect islands of surviving tissue in order to block channels, critical isthmus ablation, and recently, scar homogenization and LAVA ablation.16–18 These techniques can be complementary.
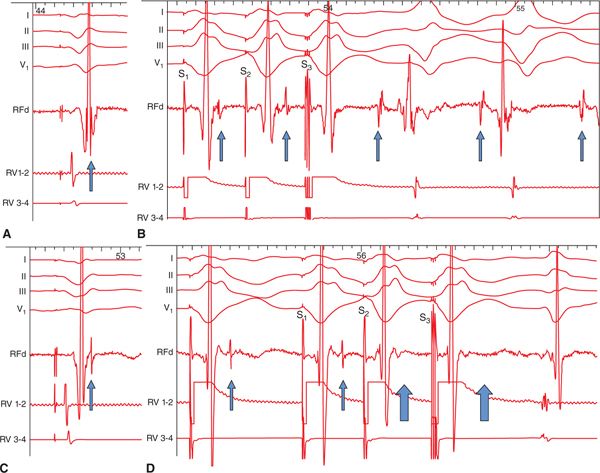
FIGURE 21-4 Role of LAVA in the induction of ventricular tachycardia (VT) and the influence of ablation. Before radiofrequency energy delivery (RF): (A) At first sight, the local ventricular electrogram during baseline-paced rhythm looks simple. However, in the terminal portion of this simple-looking signal, a very high-frequency component (LAVA) can be identified. (B) Programmed electric stimulation from the right ventricle (RV) unmasks the LAVA potential by increasing the delay from the far-field signal. The delay observed during RV pacing suggests poor coupling of the muscle bundle generating the LAVA signal. The delay is maximal with S3, which is associated not only with a change in the polarity of LAVA but also with the induction of VT. Post-RF energy delivery: (C). After delivery of RF energy, there is a remarkable delay (see A) between the far-field ventricular signal and LAVAs during baseline-paced rhythm. (D) Repeat programmed electric stimulation from the RV results in the absence of LAVA signals after the far-field ventricular potential during S2 and S3 (open arrows). The absence of LAVAs is associated with an inability to induce the VT. Although ablation has rendered VT noninducible, further RF energy application is indicated to completely eliminate the LAVAs. Reproduced with permission from Jais P, Maury P, Khairy P, et al. Elimination of local abnormal ventricular activities: a new end point for substrate modification in patients with scar-related ventricular tachycardia. Circulation 2012;May 8;125(18):2184-2196.
TABLE 21-4 Different Voltage Criteria for Substrate-Based Mapping
STANDARDIZED APPROACH FOR VT ABLATIONS
Preparation
Stay updated, free articles. Join our Telegram channel

Full access? Get Clinical Tree


