FIGURE 14-1. Lipid metabolism. (Reprinted with permission from Longo DL, Fauci AS, Kasper DL, et al., eds. Harrison’s Principles of Internal Medicine. 18th ed. Columbus, OH: The McGraw-Hill Companies, Inc.; 2011.)
Triglycerides, the esterified form of glycerol and fatty acids, constitute the main form of lipid storage in humans, and they serve as a reservoir of fatty acids to be used as fuel for gluconeogenesis or for direct combustion as an energy source. Like cholesterol, TGs can either be synthesized by the liver or absorbed. Endogenous TGs are mainly synthesized in the liver from accumulated fatty acids. Dietary fat is incorporated into chylomicrons in the small intestine and is known as exogenous TG.
Phospholipids are lipid molecules that contain a phosphate group. Like cholesterol, phospholipids become constituents of cell wall membranes. In contrast to cholesterol and TGs, dietary phospholipids are not absorbed. Most phospholipids originate in the liver and intestinal mucosa, but they may be synthesized by most body tissues. Phospholipids act as donors of phosphate groups for intracellular metabolism and blood coagulation.
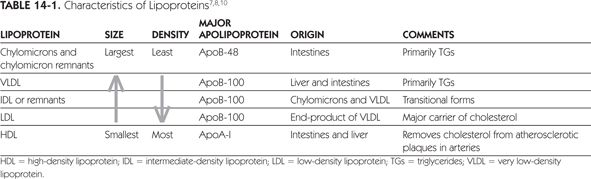
Triglycerides, cholesterol, and phospholipid molecules complex with specialized proteins (apoproteins) to form lipoproteins, the transport form in which lipids are measured in the blood. As lipids are insoluble in aqueous plasma, they are formed into complexes with an outer hydrophilic coat of phospholipids and proteins and an inner core of fatty cholesterol and TGs. The apolipoproteins not only serve to support the formation of lipoproteins, but they also mediate binding to receptors and activate enzymes in lipoprotein metabolism. All lipoproteins contain phospholipids, TGs, and esterified and unesterified cholesterol in varying degrees. There are many ways to classify these lipoproteins, but, most frequently, lipoproteins are classified by their density, size, and major apolipoprotein composition. Table 14-1 summarizes the characteristics of TGs and cholesterol in terms of lipoprotein density.7,8,10 In the fasting state, there are three major lipoproteins found in the serum: LDL, high-density lipoprotein (HDL), and very low-density lipoprotein (VLDL).3 Intermediate density lipoprotein (IDL) are typically included in the LDL calculation. Typically, LDL cholesterol comprises 60% to 70% of TC, whereas HDL cholesterol comprises about one-quarter of TC. Very low-density lipoprotein cholesterol and chylomicrons are TG-rich lipoproteins, which comprise 10% to 15% of total serum cholesterol.
There is a strong correlation between dyslipidemia and the development of atherosclerotic vascular disease. Atherosclerotic vascular disease may be manifested by CHD, stroke, and peripheral vascular disease. There is a strong positive relationship between serum cholesterol levels and the risk for CHD.3 Proper diagnosis and treatment of dyslipidemia can be an important preventative strategy. Numerous trials of effective treatment of dyslipidemia have demonstrated reductions in cardiovascular events, stroke, and total mortality in patients with a prior history of atherosclerotic vascular disease (secondary prevention) and in patients with asymptomatic dyslipidemia (primary prevention).11–17
Dyslipidemias, or abnormal concentrations of any lipoprotein type, are classified by etiology into primary or secondary disorders. Primary disorders are caused by genetic defects in the synthesis or metabolism of the lipoproteins. Table 14-2 shows the characteristics of the major primary dyslipidemias.7,8,18 Historically, familial dyslipidemias were categorized by the Fredrickson electrophoresis profile of lipoproteins. More recently, clinicians have shifted to classification by the primary lipid parameter affected.18 Primary lipid disorders rarely occur alone, and it is unlikely for a genetic predisposition to be the sole cause of a lipid disorder. Clinically, other causes, such as diet or medications, should be considered and minimized in all patients.
CHD = coronary heart disease; HDL = high-density lipoprotein; LDL = low-density lipoprotein; TC = total cholesterol; TG = triglyceride; VLDL = very low-density lipoprotein.
aTG, LDL, HDL, and TC in mg/dL. Conversion factor for LDL, HDL and TC in International System (SI) units (millimoles per liter) is 0.02586. Conversion factor for TG in SI units (millimoles per liter) is 0.01129.
Secondary Lipid Disorders
Secondary dyslipidemias are disorders precipitated by other disease states, medications, or lifestyle (Table 14-3).3,8,19-23 When a secondary cause is likely responsible for the lipid abnormality, treatment of the underlying cause should be strongly considered.
LDL = low-density lipoprotein; HDL = high-density lipoprotein; TG = triglyceride.
a↑=increase; ↓=decrease.
bEffect on HDL and LDL depends on specific components.
Common disease-related causes of dyslipidemia are diabetes and thyroid disorders. Patients with well-controlled type 1 diabetes typically do not have abnormal lipid levels; however, patients with type 2 diabetes may present with elevated TG levels, decreased HDL cholesterol levels, and relatively normal LDL cholesterol levels.8,24 These abnormalities may persist despite adequate glycemic control, but optimization of glycemic control is still considered an important step in the management of elevated TGs.8 Low-density lipoprotein cholesterol concentrations and, in some cases, TG levels increase in hypothyroidism. In addition to these endocrine disorders, renal and liver disease should be excluded.8,25 Alterations in lipid concentrations are dependent on the type of renal disorder present. For example, patients with chronic kidney disease will present similarly to diabetic dyslipidemia, while lipid profiles in patients with nephrotic syndrome will be characterized by markedly elevated LDL cholesterol and TC.25 Different liver disorders also have varying effects on lipid profiles.8 It is recommended that secondary causes are excluded by patient history, physical examination, and laboratory data. Laboratory tests such as fasting blood glucose, thyroid-stimulating hormone (TSH), serum creatinine, urinalysis for proteinuria, and alkaline phosphatase are useful to exclude common secondary causes of dyslipidemia.
In drug-induced dyslipidemia, withdrawal of the precipitating medication usually leads to reversal of secondary dyslipidemia. Antihypertensive agents are frequently administered to patients with cardiovascular risk. Beta-blocking agents, except agents with intrinsic sympathomimetic activity may increase TG concentrations and reduce HDL cholesterol concentrations.26,27 Thiazide diuretics increase TC, LDL cholesterol, and TG concentrations.27 Thiazide effects on the lipid panel are most pronounced with higher dosages (50 mg or more daily), which are generally not recommended for use.27 The effects of beta blockers and diuretics may be short-term, with a return to baseline levels at 1 year.28 In contrast, other commonly used antihypertensive agents have no clinically significant effects on the lipid profile. While it is important to realize the effect of antihypertensive agents on the lipid profile, agents that adversely affect the lipid profile are not contraindicated in patients with dyslipidemia. Careful consideration of patient-specific factors is warranted.
Other drug classes have been implicated as sources of lipid abnormalities; however, effects on the lipid panel should not be considered a class effect for these medications. Atypical antipsychotics are known to cause lipid abnormalities with olanzapine possessing the greatest potential to increase LDL cholesterol, TC, and TG levels.20 Other atypical antipsychotics have a more variable effect including beneficial effects on the lipid panel, such as ziprasidone. Similar variability has been seen among oral contraceptives, immunosuppressive drugs, and protease inhibitors. Various oral contraceptives affect lipoproteins differently. Combination oral contraceptives increase TG concentrations. Effects on LDL and HDL are variable, depending on oral contraceptive components.22,23,29 Oral contraceptives with second-generation progestins (e.g., levonorgestrel) may increase LDL cholesterol levels and decrease HDL cholesterol levels.22,23 However, combined oral contraceptives with third-generation progestins (e.g., desogestrel) may favorably decrease LDL levels and increase HDL.22 Immunosuppressive drugs such as cyclosporine, sirolimus, and corticosteroids adversely affect the lipid profile, but tacrolimus does not impact the lipid profile with the same magnitude and mycophenolate mofetil has no effect.22
Protease inhibitors are known to primarily cause an increase in TG levels.30 Ritonavir-boosted regimens of tipranavir, lopinavir, and fosamprenavir seem to have the greatest impact, while newer agents such as atazanavir have little to no effect. Lipid abnormalities have also been identified with other antiretroviral therapy, including nucleoside reverse transcriptase inhibitors and non-nucleoside reverse transcriptase inhibitors. However, the changes with these antiretroviral therapies tend to be modest, and agents within these classes are available that should not impact lipid levels. Though drug-associated adverse effects on the lipid profile have not been directly correlated with increased risk for CHD, it is important to assess these effects in considering laboratory data and the appropriate treatment plan for the patient.
Lifestyle also may affect lipoprotein concentrations. Besides being independent risk factors for CHD, obesity, physical inactivity, and cigarette smoking cause an increase in serum TGs and a decrease in HDL cholesterol.3,31 Therapeutic lifestyle changes (TLC) focusing on these risk factors can aid in reversing the lipid abnormalities and reducing CHD risk.3 A diet that is high in saturated fats, trans fatty acids, and cholesterol increases total serum cholesterol concentrations and LDL. Diets low in saturated fats and low in trans fatty acids are recommended to reduce risk of CHD.3 Popular low-carbohydrate diets favorably change TGs and HDL cholesterol, but they may increase LDL cholesterol levels.32 Light-to-moderate alcohol intake (one to two glasses of beer or wine or 1–2 ounces of liquor per day) increases HDL and is associated with lower mortality from CHD as compared with abstention from alcohol.33 However, light-to-moderate alcohol consumption is associated with increases in TGs.34 Since evidence to-date is epidemiologic in nature, alcohol is not recommended until data from controlled clinical trials is available.35
LABORATORY TESTS FOR LIPIDS AND LIPOPROTEINS
Dyslipidemia is a major contributor to CHD and peripheral vascular disease. Fortunately, several laboratory tests can be used to assess the concentrations of various lipids in the blood, making early detection and monitoring possible. Identification of patients at risk for CHD and peripheral vascular disease is a two-part process. First, a laboratory assessment of the lipid profile must occur. Second, an assessment of the risk determinants of CHD must occur.
The third report of the Expert Panel on Detection, Evaluation and Treatment of High Blood Cholesterol in Adults (Adult Treatment Panel III, or ATP III) by the National Cholesterol Education Program (NCEP) outlines adult screening recommendations for the detection of dyslipidemia.3,36 A fasting lipoprotein profile is recommended once every 5 years in all adults older than 20 years of age. If the screening was nonfasting, then only the TC and HDL cholesterol data will be useable as eating causes clinically insignificant differences in these two levels.3,36,37 In this case, if the TC >200 mg/dL or HDL <40 mg/dL, the patient should return for a fasting lipoprotein profile to determine the appropriate plan for treatment.
The Expert Panel on Integrated Guidelines for Cardiovascular Health and Risk Reduction in Children and Adolescents recently released dyslipidemia screening recommendations for pediatric patients.38 Fasting lipoprotein profiles are recommended for children between the ages of 2 and 8 if the child has a positive family history for premature cardiovascular disease, a parent with known dyslipidemia, or the child has cardiovascular risk factors, such as hypertension, diabetes, or elevated body mass index. In addition, universal screening is recommended in all pediatric patients between the ages of 9 and 11. Either a fasting lipoprotein profile or a nonfasting sample, focusing on non-HDL cholesterol and HDL levels, can be used for universal screening in this age group. No routine screening is recommended at this time during puberty since levels may fluctuate. Reference ranges and treatment strategies for pediatric patients differ from the adult population. A review of such pediatric recommendations is beyond the scope of this chapter.
The fasting lipoprotein profile includes TC, TG, HDL, and calculated LDL. A typical sample is collected following a 9- to 12-hour fast. Patients must avoid food, as well as beverages with caloric content such as juices, sodas, or coffee with cream or sugar during the fasting period. Depending on the fat and carbohydrate content of the meal, recent food intake can cause increases in TGs of up to 50% and decreases in LDL cholesterol of 10% to 15%.39 Ideally, the patient should remain seated 5 minutes prior to phlebotomy to avoid hemoconcentration, which may cause falsely elevated lipid levels. Serum samples are collected in collection tubes without anticoagulant; plasma samples are collected in tubes with ethylenediaminetetraacetic acid (EDTA).39,40
A number of factors may cause variation in obtained lipid values including sample type and tourniquet application.39,40 Plasma concentration lipid values are approximately 3% lower than those values associated with serum measurements. Prolonged tourniquet application (longer than 1 minute) may cause venous stasis and increase total serum cholesterol concentrations by 5% to 10%. Methods used to assay total serum cholesterol vary. It is important to become familiar with the method of lipid profile measurement used by the laboratory that the clinician uses regularly.
In addition to factors specific for laboratory methods, patient-specific factors may interfere with the lipid panel results.39 The preferred lipid panel is obtained in the absence of any acute illness. This provides levels that are not affected by deviation from a baseline stable condition. Vigorous physical activity (within the last 24 hours), pregnancy, recent weight loss, and acute illness result in levels that are not representative of the patient’s usual value. Measurement of plasma lipids in the setting of acute coronary syndrome usually provides LDL values that are lower than baseline by 24 hours after an event.41 The LDL values may continue to be decreased for weeks following the event. While these values are not representative of baseline values, the recommendations are to use these values to guide initiation of LDL-lowering therapy to reduce cardiovascular risk and continue to follow lipids postdischarge.42,43
Total Serum Cholesterol
For nonfasting adults >20 years36:
desirable, <200 mg/dL or <5.17 mmol/L;
borderline high, 200–239 mg/dL or 5.17–6.18 mmol/L;
or high, ≥240 mg/dL or ≥6.20 mmol/L
In all patient populations, including the elderly, lowering elevated serum cholesterol concentrations decreases death from CHD and results in regression of atherosclerotic lesions.36,44,45 In young healthy adults, total serum cholesterol is a strong predictor of clinically evident cardiovascular events occurring 25 or more years later.46
Despite popular belief, a fasting sample is not necessary because total serum cholesterol is not significantly affected by a single meal. Factors that may interfere with accurate assessment include pregnancy, recent weight loss, vigorous exercise, and acute myocardial infarction (MI). Although low total serum cholesterol is usually considered a sign of good health, it can be a sign of hyperthyroidism, malnutrition, chronic anemia, cancer, or severe liver disease.
Methods used to assay total serum cholesterol vary greatly among laboratories. Therefore, clinicians should become familiar with the method used by their laboratory as well as with potential causes of misleading or erroneous results. Serum or heparinized plasma is the typical specimen collected.
Triglycerides
For adults >20 years36:
normal, <150 mg/dL or <1.69 mmol/L;
borderline high, 150–199 mg/dL or 1.69–2.25 mmol/L;
high, 200–499 mg/dL or 2.26–5.63 mmol/L;
or very high, ≥500 mg/dL or ≥5.64 mmol/L
Disorders leading to hypertriglyceridemia involve dysregulation of chylomicrons and/or VLDL. Chylomicrons and intermediate-density lipoproteins are present only in postprandial or pathological states, while VLDL, LDL, and HDL are present in the fasting state. Triglycerides in the form of chylomicrons appear in the plasma as soon as 2 hours after a meal, reach a maximum at 4–6 hours, and persist for up to 14 hours.7,8,10 To avoid falsely elevated concentrations, measurement of TGs and lipoproteins is recommended after an overnight fast. Triglyceride concentrations occasionally become transiently or persistently elevated in patients receiving intermittent or constant infusions of intravenous lipids, respectively. However, lipid emulsion regimens are not usually stopped unless there is risk of pancreatitis. Heparin, a common additive to parenteral nutrition solutions, may facilitate faster metabolism of chylomicrons and reduce TG concentrations by a stimulatory effect on lipoprotein lipase.
As a secondary disorder, hypertriglyceridemia is associated with obesity, uncontrolled diabetes mellitus, liver disease, alcohol ingestion, and uremia. Combination oral contraceptives, corticosteroids, some antihypertensive agents, protease inhibitors and isotretinoin may also elevate TG concentrations (Table 14-3).
Extremely high concentrations of TGs—concentrations in excess of 2000 mg/dL (22.6 mmol/L)—may also lead to eruptive cutaneous xanthomas on the elbows, knees, and buttocks. Once TG concentrations are reduced, the xanthomas gradually disappear over the course of 1↑–3 months. Hypertriglyceridemia may also manifest as lipemia retinalis (a salmon-pink cast in the vascular bed of the retina). This sign is due to TG particles scattering light in the blood and is seen in the retinal vessels during an eye exam. In patients with lipemia retinalis, TG concentrations may be 4000 mg/dL (45 mmol/L) or greater.7,47 A concentration this high requires immediate action because it causes hyperviscosity of the blood with the risk of thrombus formation.
Hypertriglyceridemia, without other lipid abnormalities, is established as an independent risk factor for CHD.36 In addition to increased risk of cardiovascular disease, hypertriglyceridemia (concentrations >500 mg/dL or >5.64 mmol/L) may precipitate pancreatitis. In fact, many patients with hypertriglyceridemia have intermittent episodes of epigastric pain due to recurrent pancreatic inflammation. In patients with very high TGs (concentrations >500 mg/dL or 5.64 mmol/L), the initial goal of therapy is to prevent pancreatitis through a very low-fat diet (≤15% of calories from fat), weight reduction, increased physical activity, and drug therapy. In patients with a TG concentration of 250–750 mg/dL (2.8–8.5 mmol/L), a 10- to 20-lb weight loss usually leads to a marked reduction in TG concentrations and an increase in HDL (if low). For patients with diabetes, glycemic control may help to lower TG concentrations.36,48 The drugs of choice for lowering TGs are fibrates, nicotinic acid, or omega-3 fatty acids. An alternative approach to drug therapy in patients with borderline high or high TGs is to intensify therapy with an LDL-lowering drug, such as a statin, which will provide some reduction in TGs. Bile acid sequestrants should be avoided since these agents are known to increase TG concentrations.
Many patients with a high TG concentration are inactive and obese. Patients encountered in clinical practice with elevated TGs often have similar lipid and nonlipid risk factors of metabolic origin termed metabolic syndrome.36,47 The metabolic syndrome is characterized by abdominal obesity, insulin resistance, hypertension, low HDL, and elevations in TGs. Metabolic syndrome is managed by correcting underlying causes, such as obesity, with TLC and by treating associated lipid risk factors.
Since hypertriglyceridemia is an independent risk factor for CHD, this suggests that TG-rich lipoproteins may be atherogenic.36 Very low-density lipoprotein is a TG-rich lipoprotein. There is recent evidence that VLDL, like LDL particles, is atherogenic. In patients with high TGs, the sum of atherogenic particles (both VLDL and LDL) may be estimated by calculating non-HDL cholesterol. The lowering of non-HDL cholesterol (total cholesterol [LDL + VLDL] – HDL) is a secondary target of therapy in all persons with high TGs (≥200 mg/dL). VLDL is estimated to be the plasma TG level divided by five. The non-HDL cholesterol target of therapy is set at 30 mg/dL greater than the LDL goal. For example, if a patient has an LDL goal of less than 130 mg/dL, the non-HDL goal will be set at <160 mg/dL. If TGs are less than 200 mg/dL, then lifestyle modifications are appropriate. If TGs are 200–499 mg/dL, then the non-HDL goal should be the target of therapy once the LDL goal is reached. This underscores the need to assess non-HDL as a marker of atherosclerotic risk in all patients with serum TGs greater than 200 mg/dL. Very low-density lipoprotein levels are not routinely measured in practice or targeted in therapy. The TG-rich lipoprotein is assessed by use of TG or non-HDL levels instead.
Several TG assay interferences exist. The TG assay itself is susceptible to interference by glycerol, which may be a component of medications or used as a lubricant in laboratory equipment.49 Clinically significant increases in glycerol concentrations can also occur following prolonged emotional stress or in diabetes.39 An excess of TGs in the blood can lead to errors in other laboratory measurements. Lipemic samples can cause falsely low serum amylase results, underestimation of electrolytes, and erratic interferences with many other tests.50 The potential interference with amylase is especially clinically relevant since high TG concentrations can cause pancreatitis, and accurate amylase concentrations are crucial to diagnosis.
Fortunately, most technologists can identify lipemic samples as the serum specimen will appear milky. The appearance of a patient’s serum sample before and after 12–16 hours of refrigeration can indicate TG-rich serum. If the sample shows a uniform turbidity or opalescence, VLDL has increased without a concurrent increase in chylomicrons. A “cream” supernatant layer atop a clear solution indicates chylomicronemia, with an excess of both chylomicrons and VLDL.
Low-Density Lipoprotein Cholesterol
For fasting adults >20 years36:
optimal, <100 mg/dL or <2.58 mmol/L;
near or above optimal, 100–129 mg/dL or 2.58–3.33 mmol/L;
borderline high, 130–159 mg/dL or 3.36–4.11 mmol/L;
high, 160–189 mg/dL or 4.13–4.89 mmol/L;
or very high, ≥190 mg/dL or ≥4.91 mmol/L
Since TC concentrations include both the “good” (HDL) and “bad” (LDL) cholesterol, the primary goals of therapy are stated in terms of only the “bad” cholesterol, or low-density lipoprotein (LDL). The LDL must be measured while the patient is in a fasting state. Low-risk patients whose LDL cholesterol is less than the individualized goal (without drug therapy) should have their fasting lipoprotein profile measured every 5 years.3 More frequent measurement may be desired in patients with multiple risk factors, or patients with low-risk (0–1 risk factor) but with previous LDL values only slightly below individualized goal. The total fasting lipid profile includes TC, HDL, LDL, and TGs. Direct measurement of LDL is not commonly performed due to labor-intensive centrifugation. Instead, LDL cholesterol concentrations can be estimated indirectly by a method determined by Friedewald.51 The formula subtracts the HDL and VLDL cholesterol from the total plasma cholesterol. The VLDL is estimated to be the plasma TG level divided by five. Using the following formula (all in milligrams per deciliter), LDL may be estimated in patients with a TG concentration less than 400 mg/dL (<4.52 mmol/L) and without familial dysbetalipoproteinemia (see Table 14-2):
LDL = total serum cholesterol – HDL – (triglycerides/5)
If a patient’s serum TG concentration exceeds 400 mg/dL (4.52 mmol/L), LDL cholesterol cannot be calculated with this formula. A direct LDL measurement by laboratory would provide an LDL value. However, since treatment of hypertriglyceridemia would take priority in such a patient, most clinicians would treat hypertriglyceridemia through lifestyle modifications and medications first. Once TG values have decreased to <400 mg/dL (<4.52 mmol/L), a fasting lipid panel would provide LDL cholesterol data.
Table 14-4 lists the treatment recommendations from the 2001 report of the expert panel of the NCEP and provides intensified optional goal recommendations based on new clinical trial data.3,6,36 LDL-cholesterol lowering is the primary goal of therapy in patients with dyslipidemia. This is because for each 1% decrease in LDL cholesterol levels, there is a corresponding 1% decrease in the relative risk for a CHD major event.6 LDL cholesterol levels are generally considered optimal when maintained below 100 mg/dL. However, in a patient at very high risk for a cardiovascular event, optimal LDL cholesterol levels may rest at a lower threshold of below 70 mg/dL. The actual goal LDL for an individual patient is defined by a risk evaluation.
aCoronary heart disease (CHD) includes angina, myocardial infarction (MI), and coronary angioplasty. Coronary heart disease risk equivalents include diabetes, peripheral arterial disease, abdominal aortic aneurysm, transient ischemic attack or stroke, and a 10-yr risk >20%.
bRisk factors in List 14-1. An increased (≥60 mg/dL) HDL concentration is a negative risk factor and negates one of the positive risk factors. Assess 10-year CHD risk with Framingham risk assessment when necessary.
cConversion factor for cholesterol in the International System of Units (SI) is 0.02586 (millimoles per liter).
dWhen LDL-lowering drug therapy is initiated, intensity of therapy should provide at least 30% to 40% reduction in LDL.
eOptional goals indicated from the Adult Treatment Panel (ATP) considerations of recent clinical trial data.6
The first step is determining if a patient has CHD or a CHD risk equivalent. Examples of patients with CHD include a patient with a history of MI, unstable angina, stable angina, or coronary angioplasty. Diabetes, peripheral arterial disease, history of transient ischemic attack, and stroke are examples of CHD risk equivalents. If CHD or a CHD risk equivalent is identified, the defined goal LDL is less than 100 mg/dL. Further, current recommendations suggest that a practitioner should consider an optional intensified LDL goal of less than 70 mg/dL in patients considered very high risk. Patients with both established CHD and multiple or poorly controlled risk factors are examples of very high-risk patients. Risk factors may include acute coronary syndromes, diabetes, cigarette smoking, and presence of metabolic syndrome. Therefore, the American Diabetes Association recommends a goal LDL of less than 100 mg/dL for patients with diabetes and an intensified optional goal of less than 70 mg/dL for patients with diabetes and established CHD.52 The American Association of Clinical Endocrinologists similarly recommends a goal LDL of less than 100 mg/dL for patients with diabetes, but recommends the intensified goal of less than 70 mg/dL for patients with diabetes and two or more major risk factors or established CHD.24
In patients without CHD or a CHD risk equivalent, an assessment of the patient’s number of risk factors must be made (List 14-1). For patients with two or more risk factors, a Framingham risk score is calculated to determine the patient’s CHD risk (Figure 14-2).6,36 The Framingham score takes into account data from the Framingham study used to weigh individual risk factors. If a patient is determined to have a 10-year CHD risk of greater than 20%, this patient is determined to have a CHD risk equivalent and is treated to a goal LDL of less than 100 mg/dL. In patients with two or more risk factors and a 10-year CHD risk of 20% or less, an LDL goal of less than 130 mg/dL is desired. However, drug therapy may be initiated earlier in those patients with a risk of greater than 10% and an optional goal of less than 100 mg/dL may be considered. In those patients with lower risk (0–1 risk factors), the goal LDL is set at less than 160 mg/dL.
CHD = coronary heart disease; HDL = high-density lipoprotein; LDL = low-density lipoprotein.
aWhen risk assessed, an HDL ≥60 mg/dL is considered a negative risk factor that, if present, subtracts one risk factor from the total count.
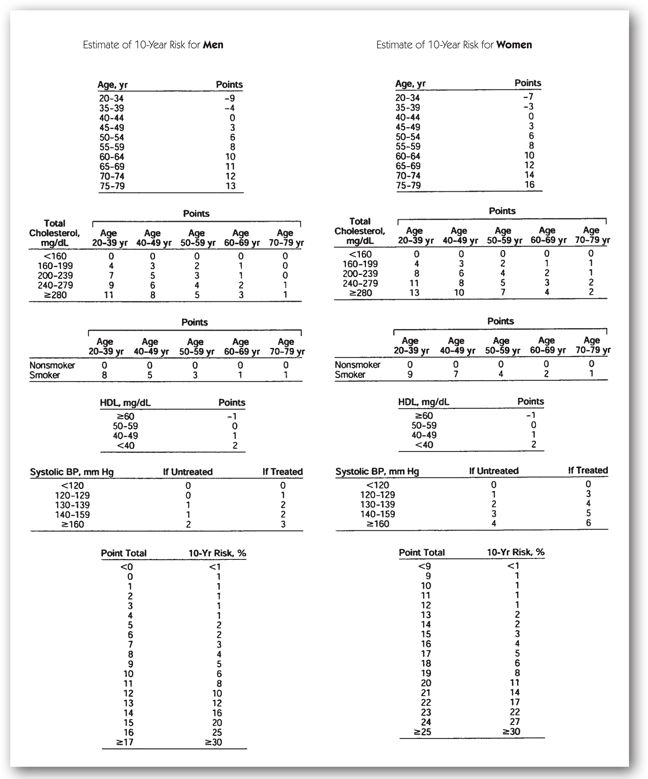
FIGURE 14-2. Framingham point scores.36
Lifestyle modifications are appropriate for all patients with dyslipidemia. Detailed education should be provided to patients regarding the adoption of a low saturated fat and low cholesterol diet, maintenance of a healthy weight, and regular physical activity. Reducing saturated fat in the diet to <7% of calories gives an approximate LDL cholesterol reduction of 8% to 10%, while an intake of <200 mg/day of dietary cholesterol would provide an additional 3% to 5% reduction in LDL.3 A weight reduction of 10 pounds due to moderate physical activity and dietary changes may provide an approximate LDL reduction of 5% to 8%. Dietary supplementation with soluble fiber and the use of plant stanols and sterols are therapeutic dietary options to lower LDL cholesterol providing 3% to 5% and 6% to 15% reductions in LDL cholesterol, respectively. If all of these dietary modifications are employed simultaneously, a cumulative 20% to 30% reduction in LDL cholesterol may be achieved. When drug therapy is initiated, doses adequate to provide reductions to meet established LDL goals should be used. Additionally, based on trial evidence demonstrating reductions in CHD risk, it is recommended that when drug therapy is used doses that achieve at least a 30% to 40% reduction in LDL should be targeted.6 This means that for a patient with LDL cholesterol only 15% above goal, a sufficient dose to achieve a 30% to 40% reduction should be used regardless of the fact that only a small reduction is needed to achieve goal.
High-Density Lipoprotein Cholesterol
For fasting adults >20 years36:
low, <40 mg/dL or <1.03 mmol/L;
high, ≥60 mg/dL or ≥1.55 mmol/L
Based on epidemiological evidence, high-density lipoprotein (HDL) acts as an antiatherogenic factor and is often termed “good cholesterol.”53,54 While a high HDL concentration is associated with cardioprotection, low levels are associated with increased risk of CHD. Every 1% increase in HDL cholesterol is associated with a decrease in CHD by 2% in men and 3% in women.55 The Framingham Study demonstrated that HDL levels were predictive of cardiovascular risk independent of elevations in LDL. Examples of this atherogenic potential are best illustrated with the coronary arteries. Concentrations less than 40 mg/dL (<1.03 mmol/L) are associated with an increased risk of MI. Similarly, low HDL is also associated with an increased risk of coronary angioplasty restenosis.54,56 In the setting of increased TG, HDL cholesterol less than 40 mg/dL (1.03 mmol/L) in men or 50 mg/dL (1.3 mmol/L) in women is considered a risk factor of metabolic syndrome.36 The blood specimen does not need to be drawn after a 12-hour fast. However, a fast is usually required because HDL is often ordered in combination with LDL.
Most patients with low HDL levels have concomitant elevated TG levels. In these patients, lifestyle therapy or drug therapy to decrease TGs usually results in a desirable increase in HDL. However, there are also patients with isolated low HDL cholesterol. Since LDL is the primary target of therapy in the NCEP guidelines, there is no specific goal for raising HDL, which is negatively correlated with TGs, smoking, and obesity. In contrast, HDL is positively correlated with physical activity and smoking cessation. Due to beneficial effects of estrogen, women, especially premenopausal women, typically have higher HDL levels than men.
Emerging Lipid Risk Factors
A number of emerging lipid risk factors for CHD are being investigated to varying degrees: lipoprotein remnants and lipoprotein (a), LDL particle number, HDL subspecies, and apolipoproteins, such as apolipoprotein B (ApoB), apolipoprotein AI, and apolipoprotein E.3,57,58 Apolipoprotein B is the major component of atherogenic lipoproteins and higher levels of apo B have been correlated with an increase in CHD.3,59 However, ApoB levels are strongly correlated with non-HDL levels. Therefore, ApoB is typically not measured in clinical practice as non-HDL is already a secondary target of therapy in the current guidelines. Further, the role of LDL particle number has been investigated.58,59 Even with the same LDL cholesterol level, individuals with a greater number of LDL particles have a higher CHD risk. However, again, the non-HDL level was similarly able to predict CHD risk. Therefore, the current American College of Cardiology Foundation (ACCF) and American Heart Association (AHA) Guidelines for Assessment of Cardiovascular Risk in Asymptomatic Adults does not recommend routine advanced lipid testing.59 While further investigation into these markers may help to explain some of the variation in CHD risk among individuals with similar lipoprotein profiles, currently measurements of these emerging risk factors are not readily available in clinical practice. At this time, measurement of these risk factors is primarily employed by specialists until more evidence linking them to cardiovascular risk and risk reduction is available.
Nonlipid emerging risk factors are also under investigation.3,60 Plasma homocysteine levels, thrombogenic factors, and inflammatory markers, all have been linked to CHD. Like the emerging lipid risk factors, NCEP provides no recommendations at this time to routinely monitor these laboratory data in patients.36 However, the ACCF/AHA more recently recommended measurement of select nonlipid risk factors in certain patient populations.59 Since inflammation plays a role in the pathophysiology of atherosclerosis, one of the most studied inflammatory markers is high-sensitivity C-reactive protein (hs-CRP). In a meta-analysis, elevated hs-CRP levels were linked to the risk of cardiovascular events, cerebrovascular events, and cardiovascular mortality.61 In the JUPITER trial, men ≥50 or women ≥60 years old with an LDL cholesterol of <130 mg/dL but with elevated hs-CRP levels of >2 mg/dL treated with a statin instead of placebo were shown to have a lower rate of major cardiovascular events.62 Therefore, the ACCF/AHA 2010 Guidelines recommends that it is reasonable to test hs-CRP in men ≥50 or women ≥60 years old with LDL <130 mg/dL who are not on lipid-lowering therapy or those at a younger age but with intermediate risk.59 The marker is also one factor in the Reynolds Risk Score. This tool, similar to the Framingham Risk Score, incorporates hs-CRP in stratification of a patient’s cardiovascular risk but is not yet recommended by NCEP guidelines for clinical use.63,64 Another nonlipid marker is lipoprotein-associated phospholipase A2 (Lp-PLA2), an enzyme produced by macrophages and lymphocytes that is found on atherogenic lipoproteins.59 Since levels of Lp-PLA2 are correlated with increased risk of CHD, the ACCF/AHA states that it may be reasonable to measure for risk assessment in intermediate risk asymptomatic adults. However, the groups also note that there is currently no information about whether measurement of Lp-PLA2 concentrations will improve clinical outcomes. Currently, these emerging risk factors are not commonly used in the clinical setting. (See Minicases 1 and 2.)
Primary Prevention
HENRY F., A 47-YEAR-OLD MALE, presents to the clinic to discuss his lipid profile during his annual exam. His friend recently suffered a heart attack, and he is very concerned about his own personal heart disease risk. His past medical history includes hypertension diagnosed 5 years ago, which is currently controlled with lisinopril 10 mg daily. He takes no other medications. He follows a reasonable, low-fat diet and jogs 4 times per week for exercise. He denies tobacco use; however, he reports drinking one glass of wine with dinner most nights of the week. He does not have a family history of diabetes, dyslipidemia, or CHD. At his office visit, he has a normal physical exam with a blood pressure reading of 118/78. He had his labs drawn yesterday after a 12-hour fast. The following laboratory results were obtained: TC 240 mg/dL, HDL cholesterol 61 mg/dL, TGs 145 mg/dL, LDL cholesterol 150 mg/dL, and glucose 89 mg/dL. Electrolyte, hematology, liver, renal, and thyroid tests are all normal. He is 5’10” and weighs 198 lb.
Question: How should the lipid results be interpreted?
Discussion: Henry F. is asymptomatic and follows a healthy lifestyle including a low-fat diet, daily physical activity, and avoiding tobacco products. He has no evident secondary causes of dyslipidemia. He does not have type 2 diabetes, thyroid, renal, or liver disease, and his antihypertensive medication has no effects on the lipid panel. His moderate alcohol intake may contribute to his elevated HDL; however, alcohol use should not be recommended as a preventative measure since no clinical trials support such a recommendation.
Henry F.’s TC and HDL cholesterol are in the high category, and his TGs are within the normal range. An elevated HDL cholesterol level is considered cardioprotective and needs to be considered when assessing a patient’s cardiovascular risk. An HDL cholesterol level >60 mg/dL is considered a negative risk factor, and the clinician can subtract one existing positive risk factor (List 14-1). Henry F.’s age and history of hypertension are considered risk factors that would modify his LDL goal; however, given his high HDL, Henry F. should be treated as if he had only one risk factor. His desired LDL goal is less than 160 mg/dL (Table 14-4). As direct LDL measurements are not often obtained from the laboratory, the LDL was calculated using the Friedewald formula: LDL = total serum cholesterol – HDL – (triglycerides/5).
LDL = 240 mg/dL – 61 mg/dL – (145 mg/dL /5) = 150 mg/dL
Question: Should any other laboratory tests be ordered to assess his cardiovascular risk? What should be done next?
Discussion: A number of emerging risk factors are under investigation including ApoB and hs-CRP. Higher levels of ApoB have been correlated with elevated cardiovascular risk; however, ApoB levels strongly correlate with non-HDL cholesterol levels, which is already available from the lipid panel. Thus, routine measurement of ApoB is not recommended. Increased hs-CRP levels have been associated with elevated cardiovascular risk. The ACCF/AHA guidelines recommend that it may be reasonable to measure hs-CRP in men >50 or women >60 years old with LDL <130 mg/dL or those younger but at intermediate risk. Given that Henry F.’s age is below this threshold and his low CHD risk, no emerging laboratory tests are needed to evaluate his cardiovascular risk.
Henry F. should continue with his low-fat, low-cholesterol diet and physical activity. Since his LDL is below the desired goal of 160 mg/dL, no drug therapy is required. A repeat fasting lipid profile is desired in 5 years. However, some clinicians may choose to follow up sooner since his LDL of 150 mg/dL was only slightly below the goal of less than 160 mg/dL.
Stay updated, free articles. Join our Telegram channel

Full access? Get Clinical Tree


