(1)
where
 is mean shape, P is a set of orthogonal modes of variation, and b defines a set of components of a deformable model. By varying the elements of b, we can vary the shape X using Eq. (1).
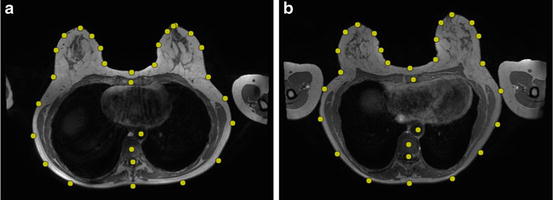
Fig. 1
Training examples for building statistical shape models of landmarks. 2D MR images from two volunteers are overlaid with manually labelled landmarks (yellow dots)
2.2 Generation of Template Patches
The second part of our algorithm deals with matching template patches for each landmark across an unseen image. The template patch for a particular landmark is obtained by taking the average of the set of 60 mm × 60 mm patches that surrounded the manually identified landmarks from the images in the training set, for which the image intensities were normalised between 0 and 255 to compensate for variations between training images. Figure 2 shows examples of template patches for four different landmarks.
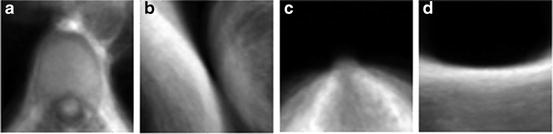
Fig. 2
Template patches for four landmarks. (a) Vertebra centre. (b) Skin surface point near the right arm. (c) Right nipple. (d) Skin surface point between the breasts
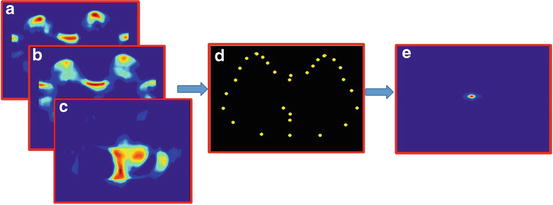
2.3 Template Matching to Obtain a Correlation Image
Template matching is the process of sliding a template patch across an unseen image and comparing the overlapped patches using a similarity metric. We use normalised sum of squared differences as a similarity metric. The output from this step is a correlation map that can be used to infer the likelihood of the location of that particular landmark in the image. The unseen image intensities are normalised between 0 and 255 before applying template matching. Template matching was performed for all 30 landmarks to obtain 30 correlation maps. Figure 3 shows the correlation maps obtained for the vertebra centre and skin surface point of the torso near arm. As shown in Fig. 3e, the correlation map shows a local maximum for the landmarks in its actual location. It also shows a local maximum at other positions (false positives) in the image. Thus template matching alone is not robust for detecting individual landmarks since it can result in false positives.
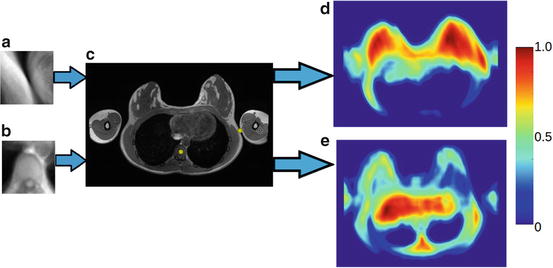
Fig. 3
(a) and (b) are examples of template images of landmarks and (c) an unseen image (with manually labelled landmarks for vertebra centre and skin surface for right arm). (d) and (e) are the correlation maps obtained after matching templates (a) and (b), respectively, with the unseen image. A higher value in the correlation map indicates a higher likelihood of the landmark being present at that location
2.4 Shape Component Optimisation
To combine the template matching information with shape modelling, we propose the following algorithm:
Get Clinical Tree app for offline access

1.
Vary the mode weights for the first three shape components between ±2.5 standard deviations from the mean value, leaving all other component values at zero. We chose to vary only the first three shape modes as they are able to capture 80 % of the variation in the shape space;
3.
Translate the correlation maps for the individual landmarks to the position in the shape model;
4.
Multiply the correlation map of the landmarks with each other to get a combined correlation map. Figure 4 shows an example of the combined correlation map. For optimal performance, the number and type of landmarks used for step 3 and 4 is explained in Sect. 3 below;