Two designs of transducer are used, (1) isotonic, involving changes in length of the muscle and (2) isometric, where the length of the tissue is kept constant by an opposing force. The response, in terms of the electrical signal, must be able to be recorded. In the early days this was done by kymograph that consisted of a pen that wrote on a smoked revolving cylinder. This was a tedious and messy procedure, and laborious to preserve the record. This was replaced by the use of paper recorders, which are expensive to maintain, and suffer from the advantage that the result is lost if the voltage exceeds the set voltage range, and the pen travels off the end of the paper. The use of a computer monitor to display the change in voltage, and hence muscle contraction or force development, has totally obviated deficiencies of earlier equipment. Since isolated muscle preparations contain a variety of cell types, including both muscle cells and nerves, the effect of a drug on either of these can be tested. Direct application of the drug to the tissue is usually (although not necessarily) interpreted as a direct effect on the muscle cells. If the nerve tissue is electrically stimulated by an external signal generator, then the effect of the drug on nerve function (depolarization, synthesis or release of neurotransmitter) can also be studied.
3.2 ORGAN BATHS
A variety of types and sizes of glass organ baths are available from specialized suppliers. Often the volume of the organ bath is not important, and a standard volume of 20 mL is often convenient. Small volume organ baths (1–5 mL) can be used to reduce the amount of drug administered to achieve a desired concentration. The volume of the organ bath is also important if the tissue is electrically stimulated by passing current between two electrodes placed on either side of the tissue (field stimulation), since this will affect the amount of current that is passed.
The organ bath has a double wall to allow temperature-regulated water to warm the interior physiological buffer. The organ bath must have inlets to allow the entry and exit of water to the warming jacket, and also to allow replacement of the physiological buffer by draining and filling. The buffer is stored in a reservoir that may be as simple as a large beaker (2 L) mounted above the organ bath. A tube placed in the beaker and a siphon established to allow passage of the buffer to the organ bath below when a tap is opened. The buffer must first pass through a warming coil that may be as simple as a condenser with an outer water jacket. The outer water jacket is kept at the required temperature by circulating the water through a thermostatically regulated pump. There are various designs of organ bath, but a typical design is shown in Figure 3.2.

3.3 PHYSIOLOGICAL SALT SOLUTIONS
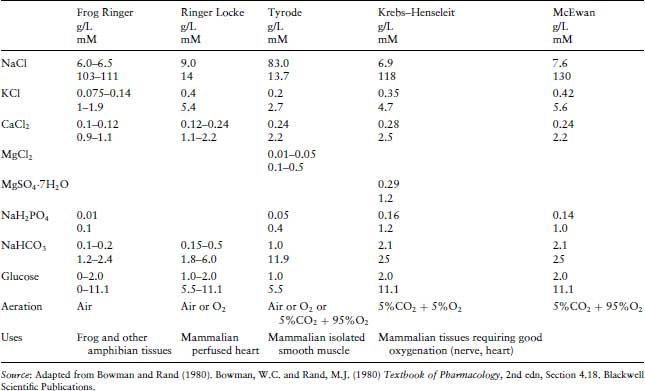
Many physiological salt solutions have been devised, each of which has been found empirically to maintain different isolated tissue preparations, and are frequently named according to the innovator. It is curious that for allegedly the same solution, slight variations in composition are cited in various publications (Table 3.1). The essential features are that they are all isotonic with blood plasma and are designed to maintain a pH close to 7.4. The first synthetic solution designed to maintain an isolated organ was introduced by Sydney Ringer to maintain a frog heart in vitro, and sometimes all similar solutions are generically described as Ringer’s. Slight modifications in the composition of these salt solutions were found to be beneficial to maintain different organs. These buffers must be bubbled with different gases in order to maintain the correct pH. Thus Krebs’, De Jalon’s and McEwan’s should be gassed with carbogen (95% O2/5% CO2), whilst Tyrode’s is gassed with air. It will be noticed that frog’s Ringer has a lower isotonicity than is used for mammalian tissues in order to mimic amphibian body fluids. It is important to note that there will be problems with the precipitation of the calcium chloride if it is not added last, and as a solution rather than the solid.
Table 3.1 The composition and applications of common physiological buffers used in in vitro experiments. There is some variation between laboratories in the composition of some of these buffers (most noticeably in the concentrations of calcium chloride).
3.4 TRANSDUCERS
As mentioned above, there are two types of transducers. Isotonic transducers reflect the changes in length of the muscle during contraction, whilst isometric transducers record the force developed by the tissue when its length is maintained constant. It is notable that each of these types produces slightly different dose–response curves when used with the same tissue, with isotonic transducers giving a curve with a higher slope. Physiologically, most muscles probably display a combination of the two types of contraction, termed auxotonic. Isotonic transducers require a low DC voltage to power a small lamp focussed onto a photocell that generates a voltage. The movement of a muscle attached to one arm of a lever by a cotton thread causes the armature to move and partly occlude the beam of light impinging on the photocell. This results in a change in the voltage generated by the photocell which is proportional to the movement of the muscle. This is fed to a preamplifier and analog–digital converter for processing by the computer software. In contrast, isometric transducers record the force applied by the muscle. They operate by using four resistive strain gauges in a Wheatstone bridge arrangement. As in most pressure sensors, when a force is applied to a resistive foil there is a change in resistance. The Wheatstone bridge in an isometric transducer must be balanced at the start of the experiment such that when there is no force applied to the transducer, there is zero voltage across the Wheatstone bridge. As force is applied, the bridge becomes unbalanced and a voltage develops across the bridge that can then be amplified and displayed to record tension. The isometric force transducer should be capable of recording 0.1–20 g (1–200 mN). Low cost commercial transducers are widely available, and examples are the Grass FT3 and ADInstruments MLT050 and MLT001 transducers. The transducer should be supplied with a suitable bridge amplifier.
The signal displayed on the monitor from the transducer should be calibrated to convert mV to appropriate units. In the case of isotonic transducers the response can be merely expressed as millimetre deflection from zero. Calibration of isometric transducers is a more critical procedure that must be carried out each day. Firstly, the voltage across the Wheatstone bridge must be set to zero millivolt by manipulating a zero knob or following the detailed instructions for the software. Then the voltage across the bridge is calibrated in terms of grams (or Newtons) by suspending a known weight from the arm of the transducer and supplying the conversion factor for millivolt to gram, so that the units on the ordinate on the display is labelled in the correct units.
3.5 RECORDING EQUIPMENT AND SOFTWARE
The unpopularity of in vitro pharmacology experiments amongst students has now been greatly ameliorated by the use of computers running user-friendly software. Almost all laboratories now use a system where the transducer is connected via an analog–digital converter and preamplifier to a computer to allow processing by appropriate software. The system most widely used is the PowerLab® range supplied by ADInstruments, which is to be recommended for its simplicity and flexibility of operation. The most basic of the Powerlab range most widely used in teaching laboratories consists of a two channel system, but four and eight channel amplifiers are also available for more advanced applications. PowerLab® amplifiers with integrated bridge amplifiers are also available. The Chart® software supplied by ADInstruments operates in a Microsoft Windows or Apple OS environment, allowing students to learn to use the system rapidly and enjoyably. Students’ results can be removed from the laboratory on a flash memory device that can be analysed later using Chart Reader® software. The detailed operating instructions are supplied with the equipment. An important feature of the system is that it functions by sampling the signal voltage from the transducer with time. The minimum rate is 10–20 samples for each response. Too low a sampling rate will give angular, inaccurate recordings, and too high a sample rate gives large files that use more computer memory. The software easily allows the responses on the monitor to be displayed by altering the amplitude (full scale, or screen deflection) and time (equivalent of chart speed) and the signal is never frustratingly lost, as with earlier recording devices. Examples of the output from typical experiments recorded by Chart® software are shown in subsequent chapters in this book. A manual description of the use of ADInstruments PowerLab equipment for pharmacology experiments is available online and can be downloaded (Bowers et al., 1999).
3.6 DOSING
Test substances must be administered in a consistent manner if reproducible and accurate measurements are to be obtained. Tissues may be maintained in vitro in one of the three basic arrangements. They may be mounted in a conventional (or static) organ bath of fixed volume, and the physiological buffer can be periodically replaced. This has a major advantage that the tissue is exposed to a known drug concentration (although the exact concentration to which the receptor is exposed is uncertain). Alternatively, the tissue can be superfused with a constantly flowing stream of buffer, or constantly perfused through blood vessels. Superfusion and perfusion often maintain the tissues in viable state for longer periods, but suffer from the drawback that the exact concentration of drug to which the tissue is exposed is not known, and the amount of drug added is expressed only in terms of a dose (a mass or weight, in grams or moles).
Using the conventional (static) organ bath, there are two ways of constructing a concentration–response curve to drugs, (1) a drug is added to the tissue and allowed a fixed contact time with the tissue, followed by washout, and (2) cumulative drug addition. In this case, the drug is exposed to the tissue for a fixed contact time, after which there is no washout but a further drug addition (usually twice the concentration) is made. This is usually continued until no further increase in response is noted when the bath drug concentration is increased, indicating that the maximum response has been reached. A limitation of the use of cumulative dose–response curves is when sequential additions of the same dose of a drug results in a decreasing response. This is explained by desensitization or tachyphylaxis (see Section 4.1.2).
The volume of additions relative to that of the organ bath must be kept low, preferably <2% of the bath volume, that is, <0.4 mL of addition if a 20 mL organ bath is used. A number of factors should be noted.
Stay updated, free articles. Join our Telegram channel

Full access? Get Clinical Tree


