To count the number of live cells in a suspension, the following procedure is followed:
- The haemocytometer is cleaned with alcohol and dried using tissue paper and lens tissue.
- The surface of the haemocytometer is moistened with a slightly damp tissue and a cover slip is placed over the haemocytometer. A tight fit has been achieved when coloured refraction rings can be seen.
- Equal volumes of a 0.4% trypan blue dye and the cell suspension are mixed together. Only a very small volume is needed, for example, 50 μL of each in an Eppendorf plastic centrifuge tube.
- 10 μL of this suspension is placed at the edge of the cover slip and allowed to fill the wells.
- Under a phase contrast inverted microscope, any blue cells are dead; whilst the live cells do not take up the dye appear as bright, refractile cells.
- A large number of cells (100–150) should be counted to ensure a reliable figure. This is done using a tally clicker. The number of large squares (1 × 1 cm) that need to be counted depends on the cell density. If there are more than 100–150 cells in the four large corner squares, the cell suspension should be diluted and recounted. Platelets should be counted at 40 × magnification. Even at this magnification, platelets will appear very small. They have very heterogeneous size distribution, but they have a diameter of less than 3 μm.
- Calculation of the cell concentration is performed as follows. The volume of one large square is 1 × 1 × 0.1 = 0.1 mm3. Divide the total number of cells counted by the number of large squares counted. The number of cells per large square is multiplied by 104 to find the number of cell/mL. This figure must be multiplied by two to account for the dilution with trypan blue. If the cell suspension was diluted before placing in the haemocytometer, this must also be taken into account.
Coulter Counters and Flow Cytometry
This is the most rapid and informative method of performing a cell count. It is based on the principle that when a particle, such as a cell suspended in an electrolyte solution, is drawn through a narrow aperture across which there is an electric field, there is an increase in resistance which is proportional to its volume. The consequent transitory fall in current flow as cells pass through the aperture enables a record of cell number and cell volume to be made. There are two formats used in Coulter counters, aperture and flow formats. In the aperture format, electrodes are placed on each side of an aperture, the size of which is fixed according to the size of the cells to be counted such that only single cells can pass through the aperture. Cells suspended in a physiological buffer flow through the aperture by applying vacuum on one side of the aperture. Whilst this method is relatively simple, it suffers from the disadvantage that it is a batch method and only one suspension can be measured at a time. This is the most suitable method for the experiments described in this section. The flow format is a continuous method, where electrodes are placed at both ends of a tube. As cells flow through the tube they cause a fall in resistance and current flow, which is monitored and the data processed using appropriate software.
Flow cytometry was developed from flow format Coulter counters. A focussed stream of cells crossed a laser beam of light of fixed wavelength. Light beams scattered in two directions are detected. Forward scattered light travels in the same direction as the laser beam. An obscuration baffle is placed in the path of the laser beam to prevent it from striking the photomultiplier tube (PMT), and only the forward-scattered light passing round the edges of the baffle are detected. If a fluorescent probe is attached or inserted into the cells, light emitted at 90° to the direction of the light beam, is detected by additional PMTs. Filters placed in front of the PMTs ensure that light of only one wavelength is detected by each PMT. This technique is by no means limited to determining the number and size distribution of cells. Flow cytometry is now an exceptionally powerful technique throughout the life sciences, as it can measure an increasing amount of information about events in the extra- and intracellular environment. Flow cytometry can also be used as a preparative technique to separate different cells of different types or characteristics.
Pharmacological responses can also be monitored in isolated cell suspensions using Coulter counter and flow cytometry techniques. Contraction of a suspension of isolated intestinal smooth muscle cells results in a shape change that has been monitored using a Coulter counter (Singer and Fay, 1977). This system is particularly suited to the elucidation of signal transduction events over very short times preceding contraction (Salmon and Honeyman, 1980).
7.2 PLATELETS
Platelets are the second most numerous cell type found in blood. They have a critical role in haemostasis. Physiologically, platelets are activated in response to a damaged blood vessel. They aggregate in attempt to seal the breach, as well as release numerous compounds that cause vasoconstriction and accelerate aggregation by a positive feedback mechanism. Aggregation of platelets is initiated by exposure to sub-endothelial collagen, thrombin or eicosanoids (principally thromboxane A2), platelet activating factor (PAF), 5-hydroxytryptamine and purine nucleotides, principally ADP. Pathologically, platelet activation occurs as is an early step in the formation of an arterial thrombus. Therefore anti-platelet drugs, such as aspirin, are invaluable as prophylactic treatments to prevent arterial thrombi.
Platelet aggregation is classically measured by monitoring the fall in the optical density of platelet suspensions in an aggregometer. This may be done either by using platelet-rich plasma (which will contain plasma proteins including coagulation factors), or using washed platelet suspensions in a physiological buffer. In this experiment washed platelets suspended in HEPES-buffered phosphate buffer (pH 7.4) were used. In an aggregometer, a cloudy platelet suspension is stirred in a cuvette and maintained at 37°C and placed in the light path of a colorimeter. The machine measures the fall in optical density as the cloudy platelet suspension forms large clumps or aggregates, thus allowing more light to pass through a cuvette. This is a time-consuming procedure, as only one cuvette is measured at a time, although some machines allow up to six cuvettes to be studied simultaneously. A major defect of this technique is that platelets deteriorate and change their characteristics over several hours of the experiment.
An alternative and more rapid technique is to use a microtiter-plate reader (Salmon, 1996). This is more suited to class experiments as it obviates the need to invest in large numbers of aggregometers, and the microtiter-plate reader is a multi-functional machine. These basically consist of a plastic dish with 96 wells, each one of which acts as a cuvette – so the optical density of 96 samples can be read at the same time. Using a kinetic microtiter-plate reader, not only can this be done, but also the temperature of the samples can be maintained at 37°C and the samples can be agitated to keep the samples suspended and ensure platelet–platelet contact. Thus it is an important improvement over traditional aggregometers. Using the microtiter-plate reader, large amounts of data are rapidly generated, necessitating the use of computers for analysis.
Platelet Preparation
Blood is taken from healthy volunteers who must be refrained from taking any non-steroidal anti-inflammatory drugs such as aspirin during the 2 weeks before venous blood was taken. The blood is transferred immediately into four tubes containing 3 mL of acid citrate dextrose anticoagulant (trisodium citrate dihydrate 25 g/L, citric acid monohydrate 15 g/L, glucose 20 g/L). Centrifuge of the blood was at 800 g for 5 min, which results in sedimentation of the red blood cells and a supernatant, which was cloudy straw-coloured platelet rich plasma (PRP). The PRP is removed carefully without disturbing the red blood cells. The PRP is then centrifuged at 800 g for a further 20 min, after this the clear platelet poor plasma is discarded from the top, and the platelets are carefully resuspended in HEPES saline buffer (pH 7.4) containing the following (mM): NaCl 145, KCl 5, MgCl2 1, 6H2O 1, HEPES (N-2-hydroxyethylpiperazine-N-2-ethansulphonic acid) 10, and D-glucose 10. The washed human platelets are stored at room temperature, and remain viable for several hours.
Measurement of Platelet Aggregation
To measure platelet aggregation, 150 μL of washed platelet suspension is dispensed into the 96-well microtiter plates (flat-bottomed 0.3 mL capacity). The microtiter-plate reader should be capable of being programmed to make kinetic measurements, and be temperature controlled and have shaking or stirring facilities. Examples of these are the Labsystems iEMS reader/dispenser MF and the Multiskan (from Thermo Scientific), interfaced with a computer controlled by Genesis or SkanIt software. The machine is programmed to incubate the plate for 5 min at 37°C with or without inhibitor, before 8 μL of an agonist such as collagen, arachidonic acid or thrombin was dispensed into the wells. Optical density readings at 620 nm, taking less than 10 s for the entire plate are taken, followed by orbital agitation at 1400 rpm for the next 21 s, and then read again. This cycle is repeated for the next 5 min period. The computer is programmed to automatically plot the time course of absorption in all 96 wells in real time, and all readings are stored on the computer’s hard drive.
7.2.1 Inhibition of Aggregation by Nitric Oxide Donors
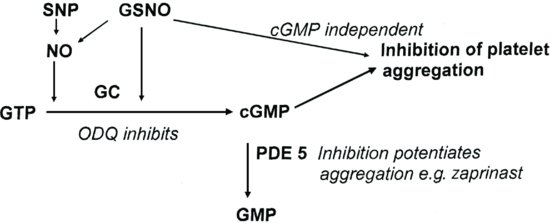
The aim of this experiment was to investigate the inhibition of platelet aggregation by two compounds that are known to generate nitric oxide (NO). The classical text-book view is that inhibition of platelet aggregation (like smooth muscle relaxation) is brought about by the activation of guanylate cyclase by NO, and this is essential for NO to exert its effect. However not all experimental data agrees with this conclusion, and it is now clear that there is a cyclic GMP independent mechanism (Crane et al., 2005). The two NO donors used are sodium nitroprusside (SNP) and nitrosoglutathione (GSNO). To investigate the mechanism of these compounds two inhibitors that interfere with the generation of NO are used. ODQ (1H-[1,2,4]oxadiazolo[4,3,α]quinoxalin-1-one) inhibits guanylate cyclase, and zaprinast inhibits the breakdown of cyclic GMP by cGMP specific phosphodiesterase (PDE5). In addition, NO binds tightly to oxyhaemoglobin, effectively removing it from solution and preventing its action (Figure 7.2).
Figure 7.2 Scheme to illustrate how ODQ and zaprinast modulate the inhibition of platelet aggregation by the nitric oxide donors, SNP and GSNO. In addition, extracellular HbO2 tightly binds to NO preventing its action.
Protocol
Layout of Microtiter Plate
Layouts for Plates 1 and 2 are shown in Tables 7.2 and 7.4. For plate 3, the effect of oxyhaemoglobin on the inhibition of arachidonic acid stimulated aggregation by SNP and GSNO. Platelets are treated in triplicate as in plates 1 and 2. Columns 1–6 contain SNP at the same concentrations as indicated for plate 1 (Table 7.1), and columns 6–12 are treated with the same concentrations of GSNO as indicated for plate 2 (Table 7.3). Columns 4–6 and 10–12 contain oxyhaemoglobin (oxyHb) at 10 μM.
Table 7.1 Sodium nitroprusside (SNP) concentrations (nM) for the concentration–response curve in plate 1.

Table 7.2 Plate 1. 96-well plate layout for the inhibition of arachidonic acid (AA) stimulated platelet aggregation by nitroprusside (SNP), in the absence or presence of ODQ (10 μM) and/or zaprinast (10 μM). All treatments are carried out in triplicate. After 5 min incubation with inhibitors, AA (6.25 μM) is added to all wells.
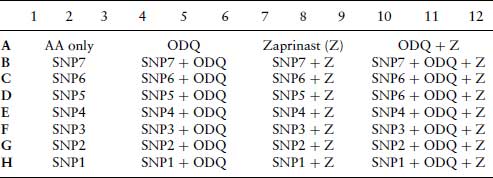
Table 7.3 The nitrosoglutathione (GSN) concentrations (nM) used in plate 2.

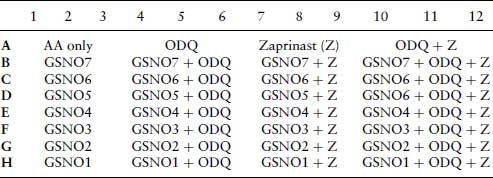
Table 7.4 Plate 2. 96-well plate layout for the inhibition of arachidonic acid (AA) stimulated platelet aggregation by nitrosoglutathione (GSNO), in the absence or presence of ODQ (10 μM) and/or zaprinast (10 μM). After 5 min incubation with inhibitors, AA (6.25 μM) is added to all wells.
Questions
Stay updated, free articles. Join our Telegram channel

Full access? Get Clinical Tree


