The first mathematical model for the relationship between agonist drug response and concentration was developed in 1937 by Clark. Over the years this model was modified—by Ariens(in 1954), Stephenson (in 1956), and Furchgott (in 1966) [see (6)]—but key elements of the original model remain. Based on their work, two models that have relevance to drug evaluation in humans are presented. The first is the simpler model of Ariens, the intrinsic activity model, which incorporates the term intrinsic activity. The second model, the efficacy model, a more sophisticated extension of the first model, incorporates a parameter for a drug’s efficacy to accommodate the concept of spare receptors. Both models are based on the assumption that drug action is a function of a drug’s quality of binding to its receptors. Thus, the characteristics of receptor binding are fundamental to both models.
16.2.1 Receptor Binding
The response to a drug is assumed to be a function of the number of receptors occupied. Receptor occupancy is another example of a capacity-limited process that is described by the law of mass action:
(16.1) 
where C is the molar concentration of drug, R the molar concentration of unoccupied receptors, RC the molar concentration of the drug’s receptor complex, kon the rate constant for the forward process, and koff the rate constant for the backward process.
Once equilibrium is established, the rates of the forward and backward processes become equal:
(16.2) 
where RT is the total molar concentration of receptors. After rearrangement, we have

or
where Kd is the drug’s dissociation constant (koff/kon) and is a reciprocal measure of the drug’s affinity for the receptors. As Kd decreases, affinity increases and there is greater binding at a given drug concentration. Kd is equal to the drug concentration at 50% receptor occupancy.
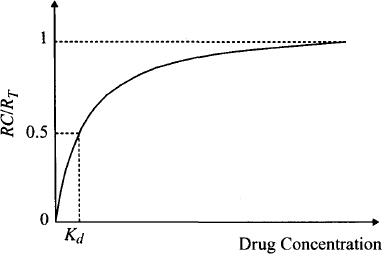
Because the system has only a finite number of receptors, the concentration of occupied receptors (RC) in equation (16.3) is limited by the total concentration (or capacity) of receptors in a system. As a result, the relationship between occupancy and drug concentration has the hyperbolic shape typical of capacity-limited processes (Figure 16.2). At low concentrations there are plenty of free receptors, and the concentration of the complex can increase in direct proportion to increases in concentration. But as the concentration increases further, some saturation begins to occur and the concentration of the complex cannot increase in proportion to the drug concentration. Eventually, all the receptors are occupied, the concentration of the drug–receptor complex achieves its maximum value, and increases in drug concentration have no further effect on the concentration of the complex.
FIGURE 16.2 Relationship between fraction of receptors occupied and drug concentration. The fraction of the receptors occupied (RC/RT) is shown as a function of the drug concentration (C). Binding of a drug to its receptors is an example of a capacity-limited process. At high drug concentrations, binding is limited by the number or capacity of the receptors. RC is the concentration of the drug–receptor complex and RT is the total concentration of receptors. When RC/RT = 0.5, C = Kd, the dissociation constant.
16.2.2 Response–Concentration Models
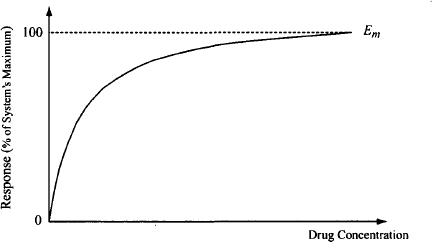
Response to a drug is assumed to be a function of the number or fraction of the total receptors that are occupied. The relationship between response and drug concentration is usually either hyperbolic (Figure 16.3) or sigmoidal in nature; that is, high drug concentrations produce a maximum response, and once this has been achieved, further increases in concentration produce no additional increases in response. This suggests that response is also controlled by a capacity-limited process. The two models presented below differ in their assumptions regarding the origin of the capacity-limited nature of the response–concentration relationship.
FIGURE 16.3 Relationship between the response and drug concentration. The response increases with drug concentration, but the increase gets proportionally less as the drug concentration increases (law of diminishing returns). Eventually, at higher drug concentrations, a maximum response is achieved. In this figure the drug is able to achieve the system’s maximum response (Em).
16.2.2.1 Intrinsic Activity Model
The simplest pharmacodynamic model the intrinsic activity model, assumes that the capacity-limited nature of the response–concentration relationship is a direct consequence of the capacity-limited nature of receptor occupancy. In this model, developed by Ariens, response is assumed to be directly proportional to receptor occupancy. Specifically, the fraction of maximum response (E/Em) is assumed to be proportional to the fraction of the total receptors occupied (RC/RT), and the constant of proportionality is the intrinsic activity:
(16.5) 
where E is the response, Em the system’s maximum possible response, and α an efficacy term that Ariens called intrinsic activity.
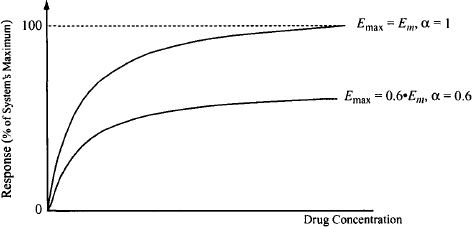
The maximum response that a drug can achieve (Emax) maybe equal to or less than the maximum response that the system can produce (Em) (Figure 16.4). Intrinsic activity is the constant of proportionality between the system’s maximum response and the drug’s maximum response. Full agonists will have an intrinsic activity of 1; a partial agonist will have an intrinsic activity greater than 0 and less than 1. For example, a drug that can produce only 60% of the system’s maximum effect (Emax = 0.6Em) will have an α value of 0.6 (Figure 16.4). An antagonist will have an intrinsic activity of zero. According to this model, the same degree of receptor occupancy for a series of full agonists (α = 1) will result in the same response.
FIGURE 16.4 Response–concentration relationship based on the intrinsic activity model. The fractional response is directly proportional to the fraction of the total receptors occupied. The constant of proportionality is intrinsic activity (α). Drugs that have intrinsic activities of 1 (full agonist) and 0.6 (partial agonist) have maximum responses (Emax) of 100% and 60% of the system’s maximum response (Em), respectively.
Substituting for RC/RT in equation (16.4) yields

Note that the drug concentration that produces 50% of its maximum response, which is known as in EC50, in this model is equal to the Kd value, the drug concentration at 50% receptor occupancy.
During the course of this discussion, several pharmacodynamic parameters will be introduced. To help readers keep track of them, and to distinguish them from each other, they will be summarized after they have been introduced. In this section we introduced:
16.2.2.2 Efficacy Model
The efficacy model superseded the simple model described above because the simple model could not account for the observation that some drugs are able to produce a maximum response at less than maximum receptor occupancy. To accommodate this observation:
The value of the stimulus depends on two factors: the fraction of the receptors occupied (drug concentration and affinity), and the efficacy (e), the efficiency with which the drug translates its binding to the receptors into the stimulus. The value of the stimulus can be expressed as

where S is the value of the stimulus and e is the efficacy.
A drug’s efficacy is a constant of proportionality that links receptor occupancy to the stimulus. Because the stimulus does not represent the fraction of maximal response (E/Em), it can achieve values greater than 1 (E/Em cannot be greater than 1). As a result, unlike intrinsic activity, efficacy can achieve a value greater than 1. In contrast to the simple intrinsic activity model, where all full agonists had an intrinsic activity of 1, the value of efficacy can vary among full agonists, which allows the model to distinguish the different efficacies of full agonists.
The system then converts the stimulus into a biological response. This may be a fast, simple process or may involve a cascade of several steps and may require a significant amount of time. The magnitude of response is a function of the value of the initial stimulus and may be expressed

To accommodate the capacity-limited characteristics of the relationship between response and drug concentration (as discussed above, E/Em has a maximum value of 1), the right-hand side of the equation must resolve to a value between zero (the stimulus produces no response) and 1 (the stimulus produces the maximum response), so a hyperbolic function [E/Em = S/(1 + S)] is frequently used for the relationship between the value of the stimulus and the magnitude of the biological effect. Combining equations (16.7) and (16.8) yields
(16.9) 
Substituting for RC/RT from equation (16.4) gives us
A drug’s efficacy (the efficiency with which the receptor binding is converted into the initial stimulus) is a function not only of the drug but also of the number of receptors. The efficacy of a drug can be expressed per unit receptor. This is known as the intrinsic efficacy (ε):
(16.11) 
Thus, equation (16.10) may be written
From equation (16.12), it can be seen that the effect produced by a given drug concentration is dependent on:
The parameters of this model thus separate the drug-specific parameters of intrinsic efficacy (ε) and affinity (Kd) from tissue-specific properties of the total concentration of receptors (RT) and the tissue property that converts the stimulus into the biological response.
Figure 16.5 shows the typical concentration–response profile associated with this model. In the figure, drugs with efficacies of 1 and 10 are partial agonists because they cannot produce the maximum response produced by other drugs (the full agonists). Note that at low concentrations, drugs with higher efficacies produce larger responses at equivalent concentrations (i.e., they are more potent). At very high concentrations, there is no difference among full agonists in the magnitude of the response, but partial agonists produce lower maximum responses. Note that although the two curves on the left both represent responses to full agonists, they are not superimposed because the agonists producing them differ in efficacy.
FIGURE 16.5 Semilogarithmic plots of response against drug concentration for a series of agonists with different efficacies (e). The affinity of all four drugs is the same. In the figure the drugs that have efficacies of 1 and 10 are partial agonists because they cannot produce the maximum response produced by other drugs (full agonists).
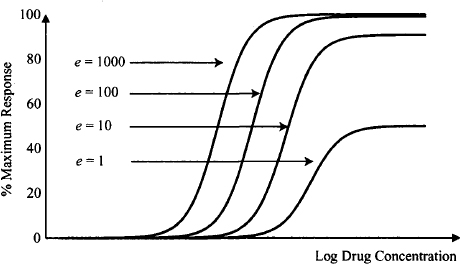
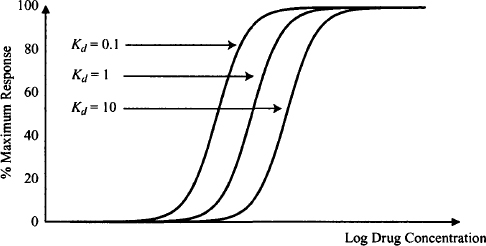
Figure 16.6 shows how the value of a drug’s affinity influences the response–concentration relationship for a series of full agonists with the same efficacy. As affinity increases (Kd decreases), response at a given concentration increases. Figures 16.5 and 16.6 demonstrate that a drug’s potency is a function of both its affinity and its efficacy. A summary of some of the pharmacodynamic terms introduced in this section are provided below.
FIGURE 16.6 Semilogarithmic plot of response against drug concentration for a series of agonists with different values of affinity. The efficacy of all three drugs is the same. A drug’s Kd value is a reciprocal form of affinity; as Kd increases, affinity decreases.
1. Affinity The affinity of a drug is a measure of the strength with which the drug binds to the receptor and is the reciprocal of the dissociation constant (i.e., 1/Kd). Kd is equal to the drug concentration when half the receptors are occupied. Drugs that have high affinities (Kd small) require a lower concentration to occupy half the receptors compared to drugs with relatively low affinities.
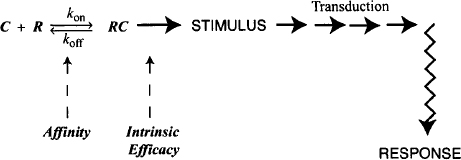
2. Efficacy and intrinsic efficacy. Efficacy is an expression of the efficiency with which a drug converts its interaction with the receptors of a system into a stimulus. Full agonists have large values of efficacy that vary among drugs. Partial agonists will have low efficacies, and antagonists will have zero efficacy. Intrinsic efficacy is a measure of a drug’s efficacy per unit receptor. As such, in contrast to efficacy, it is dependent only on the drug and is a pure measure of the drug’s ability to produce a stimulus from its interaction with a receptor. Affinity and intrinsic efficacy constitute the drug-specific parameters that control the response–concentration relationship. Their individual roles in the response chain are shown in Figure 16.7.
3. Intrinsic activity Intrinsic activity is the fraction of the full system response that a drug can produce. A full agonist that can produce the maximal system response has an intrinsic activity of 1, a partial agonist has an intrinsic activity between 0 and 1, and an antagonist has an intrinsic activity of 0. In contrast to pure efficacy, intrinsic activity does not make any distinction among full agonists—they all have intrinsic activities of 1.
4. Potency Potency reflects the concentration of a drug that is required to produce a given effect. A drug with high potency will produce a given effect at a lower concentration than will one with low potency. Potency, a function of tissue and drug factors, is controlled by the drug factors of affinity and intrinsic efficacy. Affinity controls the number of receptors occupied at a certain drug concentration, and intrinsic efficacy determines the magnitude of the effect that results from the occupancy. Potency is also controlled by two tissue-specific factors: the number of receptors present in a system and how the receptor stimulus is converted to a response. Within a biological system, the relative potency of two drugs is dependent on affinity and intrinsic efficacy.
5. EC50. EC50 is the drug concentration that produces half the drug’s maximum response. In the simpler intrinsic efficacy model, EC50 = Kd (the drug concentration that results in 50% receptor occupancy). Note that in the efficacy model, if a drug has high efficacy, its EC50 will be much less than the Kd value.
16.3 EMPIRICAL PHARMACODYNAMIC MODELS USED CLINICALLY
Stay updated, free articles. Join our Telegram channel

Full access? Get Clinical Tree


