Five guests stayed for 2 days. This group provided a total of 10 days’ stay.
Six guests stayed for 3 days. This group provided a total of 18 days’ stay.
Two guests stayed for 4 days. This group provided a total of 8 days’ stay.
Two guests stayed for 5 days. This group provided a total of 10 days’ stay
One guest stayed for 6 days. This group provided a total of 6 days’ stay.
Overall, the 20 guests stayed a total of (4 + 10 + 18 + 8 + 10 + 6) = 56 days. The mean residence time is the total number of days spent divided by the total number of guests: 56/20 = 2.8 days.
A drug’s MRT, which can be considered to be the mean time spent in the body by a small mass of drug, is determined in the same way. A drug is administered intravenously. Assuming first-order elimination, the amount of drug eliminated per unit time is
(10.1) 
where Ae is the amount of drug eliminated, k is the elimination rate constant, and Ab is the amount of drug in the body.
During the period dt, the small mass or amount of drug eliminated is given by
(10.2) 
During the period dt, the amount of drug eliminated is equal to k · Ab · dt (equivalent to b in Table E10.1). This amount of drug has a residence time of t (equivalent to a in Table E10.1). The total amount having this residence time is (a · b), or
(10.3) 
The sum of all the residence times from the time of administration (t = 0) until all the drug has been eliminated (t = ∞) is
(10.4) 
or
(10.5) 
The mean residence time (MRT) is the sum of all the residence times divided by the total amount of drug originally present in the body, the effective dose (S · F · D):
(10.6) 
Assuming that Cp and Ab are always proportional and Ab = Cp · Vd, we have
(10.7) 
Rearranging yields
(10.8) 
But Cl = k · Vd, so
(10.9) 
But S · F · D/Cl = AUC, so
The denominator in equation (10.10) is the area under the plasma concentration–time curve from time zero to infinity (AUC) (Figure 10.1a). The numerator is the area under the curve of the plot of Cp · t versus time from zero to infinity (Figure 10.1b). This is referred to as the area under the first moment curve (AUMC):
(10.11) 
Thus, MRT is calculated from the area under the curve (from time zero to ∞) for the plot of plasma concentration against time (Figure 10.1) (AUC), and the area under the curve (from time 0 to ∞) for the plot of the product of plasma concentration and time against time (AUMC) (Figure 10.1). Both the AUC and the AUMC can be determined using the trapezoidal rule (see Appendix C). Note that in NCA the terminal elimination rate constant is given the symbol λ. Recall that for the AUC calculation, the area from the last data point to infinity is Cplast/λ. Note that for the AUMC, the area from the last data point to infinity is (Cplast · tlast/λ) + (Cplast/λ2). Thus, the MRT can be determined without subjecting the data to compartmental analysis.
FIGURE 10.1 Graphs of plasma concentration against time (a) and the product of plasma concentration and time against time (b). The AUC is the area under the Cp versus time curve and the AUMC is the area under the Cp · t versus time curve.

10.3 DETERMINATION OF OTHER IMPORTANT PHARMACOKINETIC PARAMETERS
The other important pharmacokinetic parameters, including the mean elimination rate constant, the mean elimination half-life, and the volume of distribution at steady state, can be determined as follows. The mean elimination rate constant
the elimination half-life
(10.13) 
the clearance
(10.14) 
and the volume of distribution at steady state,
Substituting for MRT from equation (10.12) yields
(10.16) 
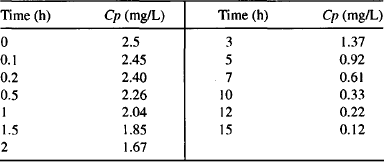
Example 10.2 In Chapter 7 a data set was presented and subject to compartmental analysis using the model for an intravenous injection on a one compartment model. The data are shown in Table E10.2A and will now be subjected to NCA.
TABLE E10.2 A Plasma Concentration–Time Data Simulated After a 50-mg Intravenous Dose in a One-Compartment Model

Solution The parameters are determined using NCA as follows:


