Introduction to Dosing Medications in Obese Patients
Brandon R. Shank
Outline
•Obesity Pandemic
•Measures of Weight and Obesity
•Determining an Obese Patient’s Medication Dose
•Pharmacokinetic Changes in Obese Patients
•Patient-Specific Factors and Pharmacodynamic Changes
•Healthy Living and Lifestyle Changes
•Future Directions
•Sample Calculation: Creatinine Clearance Estimation Example
Worldwide obesity has doubled since 1980, accounting for 13% of adults.1 In the United States, more than one-third of adults and 17% of children are obese, and almost one-half of non-Hispanic blacks and 43% of Hispanics are obese.2 The high prevalence of obesity is impacting the United States healthcare system, costing $147 billion in 2008.3 Overconsumption of calorically-dense foods, physical inactivity, genetics, psychological underlying conditions, and personality traits contribute to the rise in obesity. Individuals of low socioeconomic status are at an even higher risk because they are unable to afford healthy foods or do not have the education to make good choices.
Obesity puts individuals at high risk for cardiovascular disease as well as diabetes, hypertension, stroke, and angina, and it has been linked to breast, gastrointestinal, esophagus, colorectal, liver, stomach, pancreas, gallbladder, and genitourinary cancers.4,5 The excessive weight causes pressure to be put on bones and joints, which causes osteoarthritis to occur at a younger age. Unfortunately, obesity continues to worsen and has been impacting individuals and the entire healthcare system. This chapter will discuss measures of weight, pharmacokinetic and pharmacodynamic changes in obese patients, as well as pharmacologic treatment of obesity.
Measures of Weight and Obesity
It is important to assess for trends prior to assuming a weight for calculating a medication dose. A patient’s weight can fluctuate depending on volume status and/or diuresis, especially in the critically ill. Knowing whether the weight was a standing or bed weight can help you fully understand the accuracy of the measurement. Some obese patients are not able to stand so the bed weight may be the only means to obtain a weight. Patients with heart failure, kidney failure on dialysis, and ascites as well as pregnant women are just some of the populations to consider. Patients with cancer can gain or lose weight throughout their cycles so it is important to reevaluate weight each cycle.
Body mass index (BMI) is standard for categorizing obesity. Adolphe Quetelet developed the Quetelet index, also known as BMI, dating back to 1832.6 BMI (Equation 1-1, Table 1-1) was later found to be a good determinate of subcutaneous body fat but not percentage body fat.6,7 The World Health Organization defines adults with a BMI between 25 and 29.99 kg/m2 as overweight and BMI >30 kg/m2 as obese. Obese patients are further divided into subclassifications of class I, class II, and class III for a BMI of 30 to 34.99 kg/m2, 35 to 39.99 kg/m2, and ≥40 kg/m2, respectively.8 Although BMI has been shown to correlate with subcutaneous fat, use caution when applying BMI to individuals with greater muscle mass, women, or the elderly as BMI may not be the best descriptor.
In addition to BMI as described above, body surface area (BSA) and percent body fat are additional ways to quantify an individual’s size. BSA is another index that will be discussed in Chapter 6: Dosing Antineoplastic Medications in Obese Patients. Bodybuilders are an example of when the BMI may be skewed. Their weight would be higher because muscle is more dense than fat so BMI would be falsely elevated. Additionally, the BMI equation was validated prior to the marked increase in obesity rates; thus, percent body fat would better describe a person of such build. Percent body fat is performed by dividing the free-fat mass, which is the mass excluding any fat, by the person’s total body weight (TBW). There are many ways to determine free-fat mass such as hydrodensitometry, skin-fold measurement, bioelectrical impedance analysis, and dual-energy x-ray absorptiometry.9 All of these methods, including the gold standard hydrodensitometry, require sophisticated equipment that limits the use for widespread implementation. Percent ideal body weight (IBW) and BMI are readily available and is easy to calculate; however, BMI remains the standard.
Little information is available from pharmaceutical manufactures as to what body weight is recommended and the study’s population weight distribution. Most commonly, TBW is utilized for weight-based drug dosing. Figure 1-1 shows size descriptors and how they relate to one another in regard to amount of fat included. Free-fat mass7 (Equations 1-2a and 1-2b, Table 1-1) excludes essential fat, whereas lean body weight (LBW) takes into account fat in cell membranes, bone marrow, and central nervous system (Equations 1-3a and 1-3b, Table 1-1).10 LBW was developed for determining patient size for epidemiological reasons, but it appears to be a more appropriate means of estimating weight in obese patients because it does not decline with increasing TBW compared to IBW.9 However, some have argued LBW may not be the best descriptor in patients who are significantly overweight because the population initially studied was not as severely obese as the current population.11 Both LBW and IBW incorporate sex into the calculations, but they differ in that LBW includes BMI whereas IBW is based solely on height.12 IBW was derived from Metropolitan Life Insurance Company of New York Data (Equations 1-4a and 1-4b, Table 1-1).12 IBW came from the optimal weight for those with the greatest life expectancy, not based on pharmacokinetic studies. However, the IBW equation has been widely studied for aminoglycoside dosing.12 LBW and IBW appear to be a good predictor of pharmacokinetics for hydrophilic drugs with smaller volumes of distributions because these medications stay in the intravascular space.13 Further studies found that those individuals under 5-feet tall can be calculated by subtracting the weight per inch, although this practice has not been widely validated.14
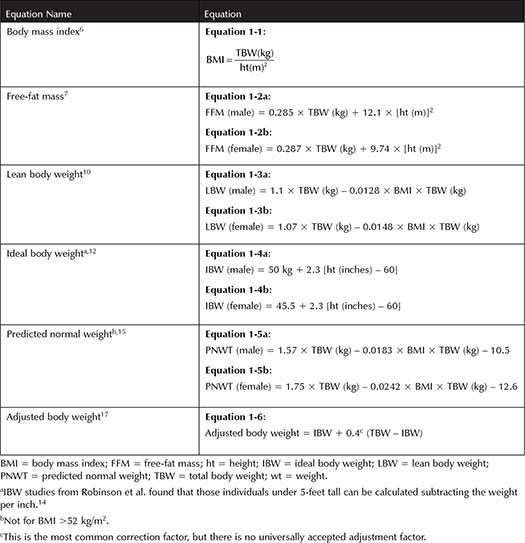
Table 1-1. Body Size Descriptors
There are other descriptors that take a portion of one’s body weight in an effort to account for excessive adipose tissue. Predicted normal weight was designed for individuals with a BMI >25 kg/m2 (Equations 1-5a and 1-5b, Table 1-1).15 This equation is the sum of LBW and normal fat body weight, thus excluding excessive body weight, and it was validated in oncology and general medicine patients. It cannot be used for patients with a BMI exceeding 52 kg/m2. Adjusted body weight was first described for aminoglycoside dosing because aminoglycosides stay predominantly in the central space (Equation 1-6, Table 1-1).16 It makes up for the disproportionate percentage of fat with the assumption that adipose tissue has 45% to 50% extracellular fluid.17 Obese patients can have an excess of 30% fat; thus, adjusted body weight helps account for the change assuming 40% lean mass and 60% of fat mass of anything above their IBW. Other correction factors of 0.25 have been utilized for other medications.18
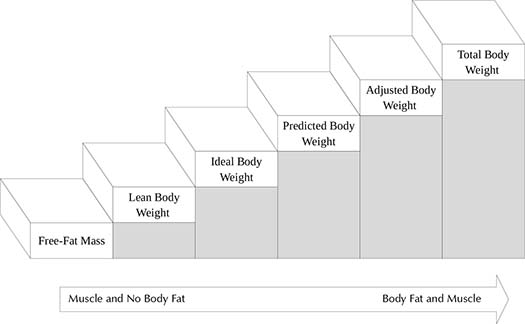
Figure 1-1. Staircase Diagram of Body Size Descriptors
Helpful Tips 
•Clinically evaluate the patient’s weight and fluid status.
•BMI is the standard for classifying obese patients.
Summary 
•LBW and IBW correlate well with hydrophilic drugs that have a small volume of distribution (Vd) and limited fat distribution.
•TBW tends to correlate well with lipophilic drugs that have a large Vd.
Determining an Obese Patient’s Medication Dose
The first step is to make a clinical determination of the patient’s weight. Then, evaluate the evidence supporting the intended therapy. In some instances, it is more advantageous to select an alternative drug with greater data. Controlled prospective trials should take priority because they can show causation; unfortunately, there are relatively few. Secondly, retrospective cohort studies and case reports are the most common type of data available. Retrospective data will provide you with descriptive information but do not show causality. Pay close attention to the studied weight range as it can enhance the external validity for applying the data to your specific patient, especially studies performed in different countries. Pharmacokinetic studies are most often from phase I trials, which report clearance, Vd, and half-life. Lastly, animal studies may provide further insight into the changes in a human model. There are numerous changes in the pharmacokinetics of medications in obese patients such as alterations in protein binding, hepatic metabolism, clearance, and Vd . The following section will discuss these changes on a chemical and molecular level. Where data are limited, these principles can be utilized to assist clinicians in determining the optimal dose. There are many competing processes occurring so there are exceptions. If the data are lacking, consider an appropriate alternative therapy that may have more data supporting its use in obese patients.
Pharmacokinetic Changes in Obese Patients
Absorption
Oral bioavailability in obese patients has not been widely investigated, but increases in perfusion to the gut and accelerated gastric emptying may enhance the rate and extent of drug availability.19 However, others have reported no change in absolute blood flow to the gastrointestinal tract.20 No difference in bioavailability has been found in obese patients with many oral agents such as cyclosporine, midazolam, and propranolol when compared to normal body-weight individuals.21 Fat tissue receives about 5% of cardiac output, compared to 73% received to viscera and 22% to lean tissues.22 Therefore, perfusion throughout the body of an obese patient is altered. For example, the rate of absorption after subcutaneous administration of enoxaparin was delayed by 1 hour in obese patients.23 The exact etiology of why there is a delay in absorption compared to normal body-weight individuals is unclear. BMI increases of 10 kg/m2 resulted in a negligible, 0.2-mm skin thickness increase in patients with a wide range of BMI (maximum BMI 64.5 kg/m2).24 Insulin pharmacokinetics and glucodynamics were found to not differ significantly after administration of insulin lispro with an 8-mm long needle compared to a 5-mm long needle.25
Distribution
The Vd is the total amount of a drug in the body, which is a measure of the extent drugs distribute throughout the body. Dosing size is related to the Vd and in clinical practice is used for loading doses, which are individualized based off of each specific drug. There are many factors influencing the Vd in an obese patient.26 First, lipophilicity or the affinity a molecule has to adipose tissue will vary between agents. For example, aminoglycosides are hydrophilic and have a smaller Vd compared to diazepam, which is a very lipophilic drug that has a large Vd. Lipophilic drugs are expected to be influenced greater in obese patients; thus, Vd adjusted for TBW appears to be a better descriptor.27 By contrast, adjusting Vd for IBW (Vd /IBW) for hydrophilic drugs enhances the correlation.27 There are exceptions such as cyclosporine, which is lipophilic and has a large Vd , but little differences were found in the Vd of obese individuals compared to normal body-weight individuals.
Other factors affecting drug deposition include polarity, molecular size, and degree of ionization. Polar molecules tend to stay in the central space more readily because they have difficulty passing into cells and are not likely to deposit into fat. Given the low percentage of cardiac output that is delivered to adipose tissue, tissue perfusion is lower for certain molecules. Vd
Stay updated, free articles. Join our Telegram channel

Full access? Get Clinical Tree


