(1)
Institute of Economic Growth, Delhi University, Delhi, India
Abstract
For over past 60 years or even more, health has perhaps been among the few issues in India that has received unceasing attention from planners, policy makers, intellectuals and the political leadership. One of the earliest attempts in this direction was initiated years before the country gained independence from British rule in 1947. A committee—Health Survey and Development Committee—was constituted under the chairmanship of Sir Joseph Bhore as far back as 1943 to suggest measures for improvements in delivery of health care to a vast populace in the country, especially in rural areas. The network of primary and community health centres that exists now in most of the rural areas draws its origin from the recommendations of the Bhore Committee (1943–1946).
For over past 60 years or even more, health has perhaps been among the few issues in India that has received unceasing attention from planners, policy makers, intellectuals and the political leadership. One of the earliest attempts in this direction was initiated years before the country gained independence from British rule in 1947. A committee—Health Survey and Development Committee—was constituted under the chairmanship of Sir Joseph Bhore1as far back as 1943 to suggest measures for improvements in delivery of health care to a vast populace in the country, especially in rural areas. The network of primary and community health centres that exists now in most of the rural areas draws its origin from the recommendations of the Bhore Committee (1943–1946).
The Bhore Committee was followed in subsequent years by a series of other high-power committees and commissions2 and, more recently, by the two National Health Policies (NHPs)—the former was adopted by the government in 1983 with a focus on health for all by 2000, while the latter was legislated in 2002 with an explicit recognition of strong linkages between health and the overall growth objectives of the economy. Despite these concerns and a series of policy initiatives over the past decades, health remains a critical issue with growing concern in recent years about the high burden of diseases, premature deaths and functional incapacitations; all of these cost the nation dearly both socio-economically and in terms of its international rankings.
Some of these concerns have further been highlighted in a detailed report prepared by the National Commission on Macroeconomics and Health (NCMH), constituted by the Government of India under the chairmanship of Mr. P. Chidambaram and Dr. A. Ramadoss, then Union Ministers of Finance and Health, respectively. The Commission submitted its report in 2005 with a comprehensive review of major health issues and the contemporary situation in the country. The major issues raised by the report include inadequate health expenditure by the centre and state governments, inefficient delivery and poor utilisation of health services delivered by most public health-care services and demand–supply mismatch of medical professionals, especially paramedics and grassroot health workers. The other issues highlighted include rising drug prices which are expected to increase further under the new patent and Trade-Related Aspects of Intellectual Property Rights regime (TRIPS Plus), disproportionate burden of health cost on poorer households with far-reaching implications for their economic security and levels of consumption expenditure—both food and non-food. Drawing upon inferences based on recent health surveys, the Commission’s report is among the few public documents which have clearly agreed that private OOP health expenditure often pushes low-income households to face catastrophe and forces many of them below the poverty line. In many situations, it may as well clog intergenerational (i.e. from young to old) flows with severe implications for the coresiding old, especially women.3
1.1 Existing Health Situation: A Few Stylised Facts
Of late and with the resurgence of the market forces in countries like India, health has increasingly been considered as one of the causal factors with a decisive role in fostering growth and development (Casanovas et al. 2005). This recognition has also promoted a wider debate among health professionals and economists by linking health with individuals’ overall economic well-being and, in particular, with their poverty status. As an offshoot, this debate has led to a question: Does poor health lead to poverty or is it a symptom?
Although the health–poverty nexus and its surrounding debate has never been without its takers in India (Dreze and Sen 1995; Fuchs 2004; Behrman and Deolalikar 1988; Osmani 1992), it came to greater visibility, especially at the policy level, only after the Cairo International Conference on Population and Development (ICPD, September 1994). This recognition was reiterated further in two subsequent policy documents of the Government of India—namely, the National Population Policy (2000) and the National Health Policy (2002).
From these accounts, it may not be very implausible to infer that human health has hardly ever lacked attention in India as a broader policy concern. And yet, a number of significant issues have either missed attention, especially at micro-level, or remained on the sidelines for one or the other reason. It may, for example, be noticed that a great deal of the health infrastructure in India, especially in most rural areas, has largely been directed to achieve fertility reduction, improve contraception level and make people aware about the needs of smaller families. More recently, a few additional, but interlinked, activities have also been added with an objective to fulfil a few of the Millennium Development Goals (MDGs) such as reduction in maternal, infant and child mortality and improvement in level of institutional deliveries. In the process, however, general or post-50 health care, required by a large percentage of poor in rural and urban areas, is left to market providers—a large fraction of them consists of quacks. As poverty is still persistent in most rural areas and urban slums, reliance on private health providers is fraught with serious economic consequences, especially for low-income households engaged in the informal economy.
Another significant issue, which dissuaded analysts to examine the health–poverty nexus, especially at the micro-level, relates to lack of adequate data and information. Admittedly, the NSSO does provide data on health spending at the household level as part of its (annual and quinquennial) consumption surveys; these are generally considered reliable at the state level. The same at the district or the subdistrict level may cause problems peculiar to studies suffering from a limited number of observations. More recently, there have been attempts by the Ministry of Health and Family Welfare (MoHFW) to supplement the data sources on major health issues, particularly on access to and utilisation of health services both in the public and private sectors—most of them, however, are once again confined to reproductive health.4
Against this backdrop, there is now a realisation that the health situation in India is seriously entrenched in the following. First, despite its rising economy, India is still a country with widespread poverty, malnutrition and enormous disparities in almost every sphere of human life including health; women and the old suffer the most. This is particularly true for the rural areas where the per capita monthly consumption expenditure (PCMCE)—an important indicator of poverty—is alarmingly low (Alam 2008). Moreover, there is hardly any significant change in real per capita consumption level of rural households over the past decade (Alam 2008). Second, disease prevalence—both communicable and non-communicable—is invariably large among the low-income rural and urban households for poor socio-economic conditions and inadequate access to public health facilities. Third, the growing role of market in delivery of health and diagnostic services with a very high out-of-pocket (OOP) expenditure by seekers of health care, many of them, as has already been noted, at the lowest deciles of consumption levels. Fourth, the major contributory factor resulting into severity of health issues in India relates to various infrastructural bottlenecks suffered by health services provided by the centre, state or local governments. These bottlenecks go beyond the physical or financial resources and cover whole aspects of hospital administration including large-scale deployment of medical doctors to non-clinical services due to the interference of the local bureaucracy. Such deployments not only cause a considerable amount of dissatisfaction among users of public services but also force a shift to private medical services and incur OOP expenses.
Clearly, all these issues are not only detrimental to the economic well-being of a large number of poor households or their family members; they are also in direct contradiction to the National Population Policy (2000) and the National Health Policy (2002). In addition, these are in contradiction to the country’s new economic regime as well.
1.2 Health Indicators and Underlying Issues
Three issues are often reported to have largely clouded the health indicators of the country and bring them directly in contradiction to the stated objectives of the country’s population and health policies.5 These are:
1.
High prevalence of communicable and non-communicable diseases in the country causing premature deaths and loss of healthy life.
2.
Inadequate public health expenditure, especially if judged by using the price-adjusted expenditure data.
3.
Increasing role of private sector in health-care delivery causing very high OOP expenses on drugs (both common and life-saving) and other components, borne out disproportionately by the low-income households with grave risks of being pushed to (i) serious welfare losses, (ii) catastrophic conditions and (iii) indebtedness. It also creates a divide between the health-care allocations by the government and the private needs.
We will deal briefly with some of these issues in the following discussion and provide a few corroborating evidences; a few of them have already been produced by the Commission on Macroeconomics and Health in its report.
1.2.1 Selected Health Indicators: All India
A perusal of Table 1.1 reveals that the annual population growth rate in the country is gradually declining over the preceding decades. It grew at the rate of 1.64 % per annum during the preceding two censuses—2001–2011. The infant mortality rate (IMR) at 44 per 1,000 live births is comparatively at a higher level and registered only a marginal decrease during the recent decade. The maternal mortality ratio (MMR) at 212 per hundred thousand live births is quite high in international comparison. The Millennium Development Goals (MDGs) that were officially adopted by India on the instance of United Nations in 2000 have included reduction in IMR and MMR on priority basis. The NRHM has also laid stress on increase in institutional deliveries for reduction of IMR and MMR, but still the percentage of domiciliary deliveries is quite high. Another cause of concern is the high level of anaemia among children and pregnant mothers; it was 78.9 % in case of children in the age group of 6–35 months and 57.9 % in case of women in the age group of 15–49 years as per the National Family Health Survey-3 (NFHS-3), 2005–2006. Some other major indicators of health in India may be noted from Table 1.1. Most of them appear least promising.
Table 1.1
Major health indicators: all India
Annual growth of GDP per capita: 2008–2012 (%) | 5.4a | ||
Annual growth of population: 2001–2011 (%) | 1.64b | ||
IMR per 1,000 live births, 2011 | 44c | ||
Life expectancy: M/F (projected for 2006–2010) | 65.8/68.1d | ||
MMR per 100,000 live births, 2007–2009 | 212e | ||
TFR: 2009 | 2.6f | ||
Crude death rate per 1,000 population, 2009 | 7.3g | ||
Average population served per government allopathic doctor, 2011 | 12,005h | ||
Nurses per 1,000 population, 2011 | 1.6h | ||
Pharmacists per 1,000 population, 2011 | 0.54h | ||
Total hospital beds/population served per hospital bed (government sector), 2011 | 7,84,940/1512h | ||
Non-institutional deliveries, 2005–2006 | 59.3i | ||
Public expenditure on health as per cent of GDP: India, China and Sri Lanka, 2009 | 1.1j | 1.9j | 2.0j |
Public expenditure as % of the total expenditure on health | 20 % j | ||
Anaemic children aged 6–35 months (%): NFHS-2/NFHS-3 | 74.2/78.9i | ||
Pregnant anaemic women aged 15–49 (%): NFHS-2/NFHS-3 | 49.7/57.9i | ||
1.2.2 Disease Burden and Deaths: WHO Estimates (DALYs Rates and Death Rates)
A comparison of the World Health Organization (WHO) estimates of disability-adjusted loss of years (DALYs) in Fig. 1.1 reveals that the burden of communicable diseases in India is considerably higher than China or Sri Lanka, although it is lower than Pakistan, Nepal and Bangladesh. As regards the non-communicable diseases, it is equal to the level in Sri Lanka, but quite lower than in many other countries of South Asia and China.
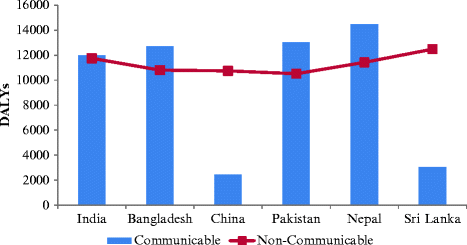

Fig. 1.1
Estimated DALYs (per 100,000 persons of all ages) by communicable and non-communicable diseases: India, China and neighbouring South Asian countries, 2004 (Source: WHO Department of Measurement and Health Information), December 2004, http://www.who.int/healthinfo/global_burden_disease/estimates_country/en/index.html (Accessed October 2012)
The estimated deaths per hundred thousand by communicable diseases in India, China and a few other South Asian countries (Fig. 1.2) reveals that India is the second highest, the highest being Pakistan. India is more or less equal to Nepal. The other three countries including Bangladesh, Sri Lanka and China have lower estimated deaths in that order. The deaths by non-communicable diseases are the highest in Sri Lanka, followed by China, India, Nepal, Pakistan and Bangladesh. These statistics clearly suggest a high burden of diseases (BoD) and a high incidence of deaths by communicable diseases.
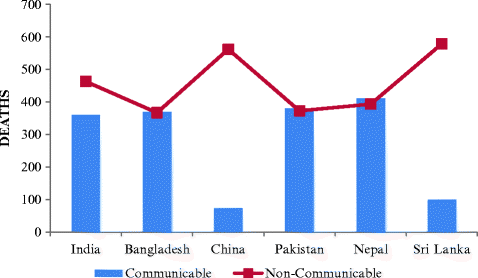

Fig. 1.2
Estimated deaths (per 100,000 persons of all ages) by communicable and non-communicable diseases: India, China and neighbouring South Asian countries, 2008 (Source: WHO, Department of Measurement and Health Information, (December 2008). http://www.who.int/healthinfo/global_burden_disease/estimates_country/en/index.html (Accessed October 2012))
1.3 Health Financing by the Centre and States
Aggregate public expenditure on health (revenue and capital) as a percentage of GDP showed a rising trend; from merely 0.40 % in 1990–1991, it increased to a little over 0.60 % in 2000–2001. It again started declining and reached to its highest level of over 0.90 % in 2008–2009 (Fig. 1.3). It remained well below the trend line during the years starting from 2002 to 2003 to 2007–2008, i.e. the years during which Indian economy risen impressively. The capital expenditure has been at a very low level; it was virtually remained almost flat below 0.1 % up to 2002–2003 and increased to its highest level at little over 0.1 % in 2008–2009. The trend of revenue expenditure has matched the general trend as the share of revenue expenditure has been very high in the total expenditure (Fig. 1.3).
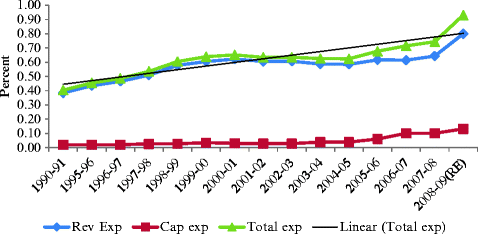

Fig. 1.3
Public expenditure on health as per cent of GDP: all India (Source: RBI’s Handbook of Statistics on State Government Finances, 2004)
1.3.1 Per Capita Health Expenditure During Post-reform Period
The per capita aggregate health expenditure of the centre and state governments has risen continuously at nominal prices from 1996 to 1997 to 2008–2009. It rose from Rs. 85.5 in 1996–1997 to Rs. 297.8 in 2008–2009 (Fig. 1.4). At the real price level, however, the increase is not very substantial—i.e. only from Rs. 34.3 in 1996–1997 to Rs. 67.8 in 2008–2009. But the trend remains more or less the same.
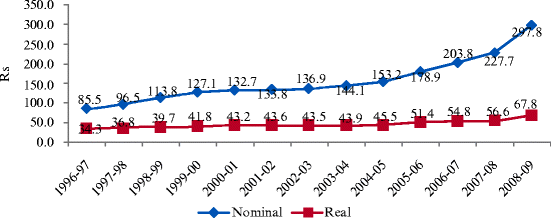

Fig. 1.4
Post-reform increase in per capita health expenditure: all India (nominal and real) (Base year: 1986–1987 = 100) (Source: RBI’s Handbook of Statistics on State Government Finances, 2004. Note: Per capita health expenditure was adjusted by using consumer price index)
1.3.2 Share of Health in Revenue Budget: Centre and States
The share of health expenditure in the revenue budget at the all-India level continuously declined from 5.7 % in 1991–1992 to little over 4 % in 2011–2012 (see Table 1.2). The states also represented more or less the all-India pattern. However, there were marginal variations in the case of Bihar, Punjab, Tamil Nadu, Kerala and West Bengal. The share of health in the revenue budget of Bihar increased to 7.8 % in 1995–1996 from 5.7 % in 1991–1992, but again came down to 6.3 % in 1999–2000 and further to 3.7 % in 2011–2012. In the case of Haryana, the share went down to as low as 3.0 % in 1995–1996 from 4.2 % in 1991–1992 and went up to 4.1 % in 1999–2000 and again to a low of 3.6 % in 2011–2012. In Tamil Nadu, the share of health went down drastically from 6.4 % in 1995–1996 to 3.4 % in 2007–2008 and slightly increased again in 2011–2012 (see Table 1.2). Figure 1.5 displays this trend very clearly. It is also clearly visible from the figure that the share allocated to health in revenue budget has fallen substantially in Gujarat, Haryana, Orissa and West Bengal over the years under reference. It may be interesting to note that the share of health has declined almost in every state during 2003 and 2008 and increased marginally thereafter. It may also be noticed that the share of health in revenue budget has remained depressed in recent years if compared to the 1990s when the country has started moving to economic liberalisation with pro-market reforms.
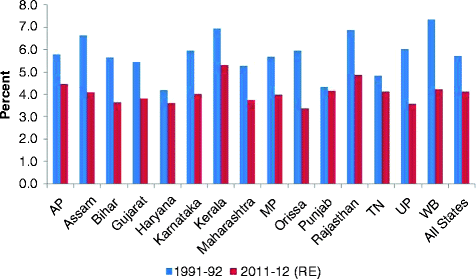
Table 1.2
Percentage share of health in revenue budget of the centre and states: 1991–1992 to 2011–2012
1991–1992 | 1995–1996 | 1999–2000 | 2003–2004 | 2007–2008 | 2011–2012 (RE) | |
|---|---|---|---|---|---|---|
AP | 5.8 | 5.7 | 6.1 | 4.0 | 3.8 | 4.4 |
Assam | 6.6 | 6.1 | 5.3 | 3.4 | 4.4 | 4.1 |
Bihar | 5.7 | 7.8 | 6.3 | 3.7 | 4.2 | 3.7 |
Gujarat | 5.4 | 5.3 | 5.2 | 3.5 | 3.3 | 3.8 |
Haryana | 4.2 | 3.0 | 4.1 | 3.0 | 2.7 | 3.6 |
Karnataka | 5.9 | 5.9 | 5.7 | 3.7 | 3.4 | 4.0 |
Kerala | 6.9 | 6.8 | 6.0 | 4.6 | 4.4 | 5.3 |
Maharashtra | 5.3 | 5.2 | 4.6 | 3.8 | 3.7 | 3.7 |
MP | 5.7 | 5.1 | 5.2 | 3.6 | 3.8 | 4.0 |
Orissa | 5.9 | 5.4 | 5.0 | 3.6 | 3.5 | 3.4 |
Punjab | 4.3 | 4.6 | 5.3 | 3.5 | 3.0 | 4.1 |
Rajasthan | 6.9 | 6.2 | 6.4 | 4.3 | 4.0 | 4.9 |
Tamil Nadu | 4.8 | 6.4 | 5.5 | 4.0 | 3.4 | 4.1 |
UP | 6.0 | 5.7 | 4.4 | 2.8 | 4.0 | 3.6 |
W. Bengal | 7.3 | 7.2 | 6.3 | 4.6 | 4.0 | 4.2 |
All India | 5.7 | 5.7 | 5.5 | 3.8 | 3.8 | 4.1 |

Fig. 1.5
Declining share of health in revenue budget of major states: 1991–1992 and 2011–2012 (Source: Table 1.2)
1.3.3 Utilisation of Public and Private Health Facilities
A perusal of Table 1.3 reveals that the countrywide share of the total cases treated in private hospitals was 58.3 % in rural areas, while the same for the urban areas was given as 61.7 %. State-level differentials reveal that rural Bihar had the highest share of treatment in private hospitals; over 85.6 % of the total cases in rural areas were treated in private facilities. This is followed by 79.4 % in Haryana, 72.7 % in Andhra Pradesh and 71.3 % in Maharashtra. Contrary to this, Orissa, West Bengal and Himachal Pradesh were at the other end with a greater share of the total cases going to the public hospitals. Is it a reflection of better health-care delivery by public hospitals in these states? We refrain from commenting on that as it goes beyond the scope of this book.
Table 1.3
State-wise share of public and private hospitals in treated cases: 2004
Rural (%) | Urban (%) | |||
|---|---|---|---|---|
States | Govt. hospital | Pvt. hospital | Govt. hospital | Pvt. hospital |
AP | 27.2 | 72.7 | 35.8 | 64.2 |
Assam | 74.2 | 25.8 | 55.4 | 44.6 |
Bihar | 14.4 | 85.6 | 21.5 | 78.5 |
Delhi | – | – | 37.3 | 62.7 |
Gujarat | 31.3 | 68.7 | 26.1 | 73.9 |
Haryana | 20.6 | 79.4 | 29 | 71 |
HP | 78.1 | 21.9 | 89.5 | 10.5 |
J & K | 91.3 | 8.7 | 86.5 | 13.5 |
Karnataka | 40 | 60 | 28.9 | 71.1 |
Kerala | 35.6 | 64.4 | 34.6 | 65.4 |
MP | 58.5 | 41.5 | 48.5 | 51.5 |
Maharashtra | 28.7 | 71.3 | 28 | 72 |
Orissa | 79.1 | 20.9 | 73.1 | 26.9 |
Punjab | 29.4 | 70.6 | 26.4 | 73.6 |
Rajasthan | 52.1 | 47.9 | 63.7 | 36.3 |
Tamil Nadu | 40.8 | 59.2 | 37.2 | 62.8 |
UP | 26.9 | 73 | 31.4 | 68.6 |
WB | 78.6 | 21.3 | 65.4 | 34.6 |
India | 41.7 | 58.3 | 38.2 | 61.8 |
In the urban areas as well, the highest percentage of 78.5 % is in Bihar, followed by 73.9 in Gujarat and 73.6 in Punjab. On the other hand, the lowest percentage of the cases (10.5 %) was treated in private hospitals in Himachal Pradesh, 13.5 % in Jammu and Kashmir and 26.9 % in Orissa. The lower utilisation of private hospitals in many cases and particularly in Orissa may be due to widespread poverty.
The trend of the utilisation of public and private facilities in hospitalisation cases can be seen in Fig. 1.6. In this figure, the share of public and private facilities in hospitalisation cases is given over three points of time from the National Sample Surveys (NSS) conducted during 1986–1987 (42nd round), 1995–1996 (52nd round) and 2004 (60th round). A clear declining trend is visible, both for urban and rural areas, as far as utilisation of public facilities is concerned. In rural areas, the share of utilisation of public facilities has declined from 56.7 % in 1986–1987 to 41.7 % in 2004, while in urban areas the share has declined from 60.3 % in 1986–1987 to 43.1 % in 1995–1996 to only 38.2 % in 2004. The declining utilisation of public facilities in hospitalisation cases has quite serious implications on OOP expenses on medical care.
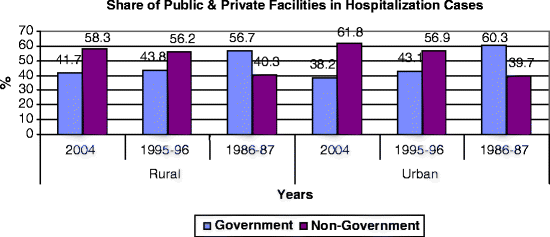

Fig. 1.6
Utilisation of public facilities in hospitalised care: rural–urban distribution (Source: NSS 60th Round (January–June 2004), Statement 24)
Clearly, the preceding discussion underscores the argument that despite its persistent efforts and inputs received from a number of specially constituted bodies, India is critically lagging behind in terms of its long-standing commitments towards building a healthy society based on certain norms of equity and efficiency. The country, as may be noticed from the data presented above, is turning out to be much severely constrained due to high proportions of immature deaths as well as diminution in healthy life caused by a distressing combination of both communicable and non-communicable diseases. A more or less similar observation follows from the rest of the figures. The country has especially failed to enhance health sector finances in real terms. It has also failed to ensure health-care access for as many households—forcing many to shift eventually from the public to the private deliverers and face serious economic and financial consequences due to rising cost of privately delivered health services and out-of-pocket expenses.
Stay updated, free articles. Join our Telegram channel

Full access? Get Clinical Tree


