Chapter 3. Interpreting tests
Laboratory tests 70
ECG interpretation 78
Peak flow and spirometry 89
Radiological tests 90
Chest X-rays 94
Abdominal X-rays 101
LABORATORY TESTS
Using the laboratory
Communication with the laboratory
Check any local policies that relate to routine, urgent and emergency sampling. Remember that most laboratories are busy in the early morning and early afternoon when routine samples arrive from the wards and GP surgeries, respectively. If you are sending an urgent or emergency sample it is essential to warn the lab beforehand, otherwise your urgent sample could end up at the bottom of the routine pile.
Refer to local protocols regarding the use of pneumatic tube systems for the delivery of samples. Never send samples that have been difficult to obtain by this method, e.g. CSF.
Artefactual results
Effect of the sample container
Contamination of the yellow-topped electrolyte Vacutainer with EDTA can occur if sampling with the EDTA-containing, purple-topped Vacutainer is performed first. This leads to falsely elevated potassium and low calcium.
Effects of poor sampling technique
Some results may be significantly altered by poor technique in collecting or handling a specimen:
• haemolysis may occur due to use of narrow-gauge needles, excessive shaking of the specimen and rapid transit in an air-tube system; several tests results are affected, e.g. potassium, LDH
• incorrectly taking a specimen near to a site of an intravenous infusion (may occur downstream or upstream)
• not cleaning the skin thoroughly before taking samples for blood culture may result in contamination
• incorrect labelling of the sample.
Effects of acute illness
The acute phase response can make the interpretation of blood tests difficult in acutely ill patients. Its function is to promote the clearance of infection and tissue healing. Liver synthetic function is directed away from albumin synthesis towards the production of more useful proteins, e.g. immunoglobulin and serum binding proteins. This enhances immune function and reduces the free concentration of elements such as iron and zinc, which are essential for bacterial metabolism. The acute phase response may last for several weeks and results in:
• low serum albumin, iron and zinc
• high serum ferritin, copper and CRP
• altered thyroid function tests.
Effects on reference ranges
Threshold values that suggest ‘disease’ must always be interpreted with an understanding of the false positive and false negative rates of the test and other factors that may affect its result. Examples of these include:
• age and gender, e.g. serum creatinine and alkaline phosphatase
• time of day, e.g. cortisol
• monthly cycle, e.g. LH, FSH
• posture, e.g. aldosterone, urine albumin
• food, e.g. glucose, creatinine.
Venous blood tests
Information about specific blood tests can be found in the chapters relating to the conditions that cause their derangement:
Arterial blood gases
Arterial blood gases (ABG) are used to assess circulating blood oxygen levels, the adequacy of ventilation and the presence or absence of any acid–base imbalance.
ABG analysers can measure, or calculate, a number of important values. The most clinically useful of these are the hydrogen ion concentration, the arterial partial pressures of oxygen (PaO 2) and carbon dioxide (PaCO 2), the bicarbonate concentration and base excess. An understanding of these individual values is essential for the interpretation of ABG results.
Individual values
Hydrogen ion concentration
Most analysers will quote both hydrogen ion concentration ([H +]) and pH (this is the negative logarithm of the hydrogen ion concentration). These indicate whether the patient is acidaemic (H + >45 nmol/L or pH <7.35) or alkalaemic (H + <36 nmol/L or pH >7.45) as a consequence of both the primary disease state and any respiratory or renal compensation that has taken place.
PaCO 2
Carbon dioxide is extremely water soluble and diffuses rapidly from the bloodstream into the alveolar spaces. Therefore, for a constant metabolic rate, the level of PaCO 2 will be determined entirely by alveolar ventilation.
The normal range for PaCO 2 is 4.6–6 kPa. Hypoventilation will result in a rise in this value (hypercapnia), while hyperventilation will result in a fall (hypocapnia). Since CO 2 forms carbonic acid when it is dissolved in water, hypercapnia leads to acidosis and hypocapnia to alkalosis. Such primary defects are respiratory in origin and, therefore, these patterns are referred to as respiratory acidosis and respiratory alkalosis, respectively.
PaO 2
Oxygen is less water soluble than carbon dioxide, so it diffuses less readily from the alveoli into the bloodstream. This means that a number of factors must be in place for adequate oxygenation: a large alveolar surface area; adequate, effective and well-matched ventilation and perfusion within the lung; sufficient oxygen in the inspired air. The interpretation of a PaO 2 value must take these different factors into account; see below.
The normal range for PaO 2 is 10.5–13.5 kPa. A PaO 2 <8 kPa defines the presence of respiratory failure, which can be further classified as type 1 or type 2.
Type 1 respiratory failure
This is isolated hypoxaemia with a normal or low PaCO 2. A low PaO 2 value can be caused by numerous conditions, but only five main physiological mechanisms:
• ventilation/perfusion (V/Q) mismatch: this is the reason for hypoxia related to most common conditions, e.g. pneumonia, heart failure, the early stages of acute asthma
• impaired diffusion: due to loss or thickening of the gas exchange surfaces of the lung, e.g. emphysema and pulmonary fibrosis, respectively
• shunting: may be intra-cardiac or extra-cardiac
• a low inspired oxygen fraction, e.g. at altitude
• alveolar hypoventilation: PaCO 2 is usually high, in which case type 2 respiratory failure is present.
Type 2 respiratory failure
This is hypoxaemia associated with a high PaCO 2. Hypercapnia always indicates alveolar hypoventilation, which may be due to:
• reduced respiratory drive due to impaired brainstem function, the sedative effects of drugs or a metabolic alkalosis
• respiratory pump failure due to respiratory muscle weakness, obesity, chest wall abnormalities or airways disease (often a combination is present).
Type 2 respiratory failure is rarely due to hypoventilation alone, the exceptions being respiratory muscle weakness or over-sedation of a patient with normal lungs. Instead, in most patients with this pattern, a component of their hypoxaemia is due to V/Q mismatch or other physiological abnormalities associated with their acute illness; see above.
Bicarbonate and base excess
The kidneys regulate acid–base balance by secretion of hydrogen ions and resorption and production of bicarbonate ions. The bicarbonate on an ABG sample is usually calculated from the measured pH and PaCO 2 and the normal range is 21–28 mmol/L.
Failure to produce bicarbonate in the kidney, or the buffering of excessive body acids produced elsewhere (e.g. lactate in sepsis or renal failure, β-hydroxybutyrate in DKA) will lead to a low bicarbonate level, known as a metabolic acidosis. Excessive loss of hydrogen ions (e.g. from the gut due to vomiting, or the kidney due to hypokalaemia) will result in a high bicarbonate level, known as a metabolic alkalosis.
The base excess is an alternative, and probably better, measure of the metabolic component of any acid–base disturbance. It can be thought of as the amount of acid that you would have to add to a blood sample to return it to a normal pH of 7.4. Thus, a negative base excess indicates a metabolic acidosis, while a positive base excess indicates a metabolic alkalosis. The normal range of base excess is −3 to +3 mEq/L, depending on the analyser.
Compensation
‘Compensation’ is the homeostatic mechanism that seeks to restore normal blood pH. In a respiratory acidosis, the kidneys will reabsorb or generate additional bicarbonate ions to buffer excess carbon dioxide in the bloodstream. However, this is a slow process and complete renal compensation may take days. Respiratory compensation is much quicker, e.g. the metabolic acidosis associated with DKA will immediately stimulate increased (Kussmaul’s) ventilation, by activation of central and peripheral chemoreceptors, resulting in hypocapnia.
In order to recognize compensation, look for a change in the buffering system (respiratory or renal) that was not involved with the primary problem. Guidance on how to do this is given below.
Interpretation scheme
It helps to approach things from the perspectives of acid–base physiology and respiratory physiology separately. The following scheme uses a hydrogen ion concentration ([H +]), rather than pH, and bicarbonate, rather than base excess.
Acid–base physiology
Look at the [H +]
Determine whether the patient is acidaemic (>45 nmol/L) or alkalaemic (<36 nmol/L).
Look at the PaCO 2
• if it is abnormal and has shifted in the same direction as the [H +], then the primary problem is respiratory in origin, either respiratory acidosis (PaCO 2 ↑, [H +] ↑) or respiratory alkalosis (PaCO 2 ↓, [H +] ↓)
• if it is abnormal, but has shifted in the opposite direction to the [H +], then the primary problem is metabolic, the change in PaCO 2 being compensatory.
Look at the bicarbonate
• if it is abnormal and has shifted in the opposite direction to the [H +], then the primary problem is metabolic in origin, either metabolic acidosis (bicarbonate ↓, [H +] ↑), or metabolic alkalosis (bicarbonate ↑, [H +] ↓)
• if it is abnormal, but it has shifted in the same direction to the [H +], then the primary problem is respiratory, the change in bicarbonate being compensatory.
Respiratory physiology
Look at the PaCO 2
Determine whether alveolar ventilation is adequate; hypoventilation is indicated by a high PaCO 2, hyperventilation by a low PaCO 2.
Look at the PaO 2
Determine whether the patient has respiratory failure (PaO 2 <8 kPa) and if it is type 1 or type 2. The causes of these are given above.
Examine the acid–base balance
As above, assess whether there is evidence for a primary respiratory or metabolic problem and whether there is any evidence of renal compensation to suggest chronicity.
CSF
Normal CSF is clear, colourless and sterile. A number of conditions result in altered appearance and/or composition of CSF and laboratory analysis of the fluid can be diagnostic (Table 3.1) Specific points related to the analyses performed in each clinical situation are discussed below.
| Features/ conditions | Normal | SAH | Bacterial meningitis | Viral meningitis | TB meningitis | MS | Malignancy |
|---|---|---|---|---|---|---|---|
| Pressure | 50–180 mmH2O | Increased | Normal or increased | Normal | Normal or increased | Normal | Can be raised |
| Colour | Clear | Blood-stained or xanthochromic | Cloudy | Clear | Cloudy | Clear | Clear |
| Red cell count | 0–4/mm 3 | Raised | Normal | Normal | Normal | Normal | Normal |
| White cell count | 0–4/mm 3 | Normal or slightly raised | 1000–5000 polymorphs | 10–2000 lymphocytes | 10–5000 lymphocytes | 0–50 lymphocytes | 0–100 lymphocytes |
| Glucose | >60% blood level; 2.5–4.0 mmol/L | Normal | Decreased | Normal | Decreased | Normal | Decreased |
| Protein | <0.45 g/L | Increased | Increased, can be over 1 g/L | Normal/ increased | Increased, can be over 1 g/L | Normal or increased; oligoclonal bands may be present | Normal or increased |
| Microbiology | Sterile | Sterile | Organisms on Gram- stain and/or culture | Sterile | AAFB may be seen or TB culture +ve | Sterile | Sterile |
Suspected subarachnoid haemorrhage
Bleeding into the subarachnoid space leads to yellow discoloration of the CSF, known as xanthochromia. However, this is an inexact and subjective term and objective analysis of the CSF is mandatory. Laboratories will usually look for two compounds:
Oxyhaemoglobin (OxyHb)
This is released from erythrocytes within an hour or two of bleeding into the subarachnoid space. It is sensitive but not specific, as OxyHb does not discriminate between a genuine subarachnoid bleed and a traumatic tap.
Bilirubin
Bilirubin is produced by in vivo metabolism of OxyHb. It is a more specific marker of SAH than OxyHb; however, it may not appear in the CSF for 12 h after the event. Therefore, if SAH is suspected an LP should not be performed before this time. False positive results may occur if previous failed LP attempts have introduced blood into the CSF causing in vivo formation of bilirubin.
Suspected meningitis or brain abscess
A CT should be performed before CSF sampling in patients with focal neurological signs, suspected abscess, or an abnormal GCS. Where there is no immediate indication for CT, CSF sampling should be undertaken as early as possible, ideally before antibiotic administration. However, in either case, ensure antibiotics are given promptly. Typical CSF results are shown in Table 3.1.
When sending the sample to the lab, indicate any antibiotics that have been administered, on the form. An additional sample should be sent for AAFB staining and culture if tuberculous meningitis is suspected.
Multiple sclerosis
Multiple sclerosis is a condition associated with local production of immunoglobulins in the central nervous system. This may be reflected by the presence of oligoclonal protein bands in the CSF. Where appropriate, send an additional sample for this to biochemistry, accompanied by a blood sample for serum protein analysis.
Urine
Ward analysis
Urinalysis on the ward involves the use of a dipstick test-strip and comparison of the results with a colour chart. The amount of time the urine is in contact with the strip and the time it is read can affect the result and the instructions on the bottle should be read. The dipstick measures several things:
• glucose: present in, but not diagnostic of, diabetes
• protein: only partly quantitative but is highly sensitive and a negative test virtually excludes proteinuria (except for light-chains); detects albumin and can indicate infection or renal dysfunction; persistently high levels should be quantified with a 24 h collection analysis (see below); note, a dipstick test cannot detect microalbuminuria
• blood: intact red cells and free haemoglobin may be found in infection and a range of primary or secondary renal conditions; note myoglobinuria (e.g. in rhabdomyolysis) leads to a false positive result
• ketones: present in fasting states and in diabetic ketoacidosis
• nitrites: sensitive test for infection; produced by Gram-negative bacteria
• pH: normally 4.5–8 and affected by changes in systemic acid–base balance
• specific gravity: indicative of urine concentration and reflects states of body fluid overload or depletion; normal 1.005–1.020.
Laboratory analysis
Microscopy
• more than 10 white blood cells/mm 3 is abnormal and suggests infection or trauma
• more than 2 red blood cells/mm 3 is abnormal (see ‘Haematuria’, p. 185)
• protein or cell casts may be present; hyaline casts are proteinaceous but insignificant; red cell casts are found in acute or chronic glomerular disease; granular casts are found in acute tubular necrosis or nephritis
• bacteria may indicate infection above the relevant laboratory threshold, particularly if associated with white cells and nitrites; check local protocols.
Culture
Urine specimens for culture should be collected into a container with boric acid as a preservative. Patients should be advised on techniques to avoid contamination with perineal commensal organisms, such as collecting a midstream urine specimen. Early morning urine specimens for AAFB should only be collected if renal TB is suspected; they are not useful in pulmonary or nodal disease.
Biochemistry
Table 3.2 summarizes the more common biochemical tests performed on urine. ‘Spot’ urines for biochemical investigation should be collected into plain (white top) ‘universal’ containers. The concentration of urine in spot samples is variable and better standardization of the test can be achieved by collecting an early morning specimen. The laboratory will usually report any results relative to the urine creatinine, e.g. albumin:creatinine ratio (ACR), protein:creatinine ratio (PCR).
| For creatinine clearance, see p. 115. For urine toxicology, see p. 238. | |||
| Test | Spot or 24 h | Normal value | Notes |
|---|---|---|---|
| Sodium concentration | Spot | 20–40 mmol/L | Low in pre-renal ARF; high in ATN and obstructive uropathy |
| 24 h | 100–200 mmol | ||
| Osmolality | Spot | 500–800 mmol/kg | A serum sample is also required for comparison; used in the diagnosis of SIADH (p. 204), diabetes insipidus (p. 204) and pre-renal failure versus ATN (p. 209) |
| Calcium | 24 h | 1.2–12 mmol depending on diet | Increased in hypercalcaemia (p. 206) and also in hypercalcuria with normal serum calcium in stone-formers |
| Protein | 24 h | ≤0.3 g/L | Excess suggests renal protein loss, e.g. nephropathy |
| Metadrenaline | 24 h | 0.3–1.7 μmol | Increased in phaeochromocytoma (p. 201); specific diet, e.g. avoiding vanilla, required during testing |
| Urate (uric acid) | 24 h | 1.2–3.0 mmol | Measure while on a low purine diet; excess causes gout, renal stones and urate nephropathy |
| Copper | 24 h | ≤0.6 μmol | High in Wilson’s disease and usually accompanied by low serum ceruloplasmin |
Alternatively, a urine specimen can be collected over a 24 h period. To allow this, your local laboratory will issue a container with the appropriate preservative, e.g. urine metadrenalines collection requires a low sample pH, so hydrochloric acid will be added to the bottle as a preservative. In such cases, it is important to inform the patient that there is supposed to be something in the bottle and that they should not allow it to touch their skin.
Pleural fluid
The colour and viscosity of the pleural fluid should be noted and documented in the case sheet. Normal pleural fluid is straw-coloured and non-viscous. Important abnormal appearances include:
• blood or blood-stained fluid suggests malignancy, PTE or a haemothorax (defined by a pleural fluid haematocrit >50% of blood haematocrit)
• pus or turbid fluid suggests empyema
• milky fluid suggests chylothorax or empyema.
Pleural fluid should be sent for the following routine investigations.
Biochemistry
Protein and LDH
In patients with a normal serum protein level, an exudate is defined by a pleural protein level >30 g/L and a transudate by a level <30 g/L. In borderline cases (25–35 g/L) or when the serum protein level is abnormal, Light’s criteria should be used to identify exudates, defined by:
• a pleural protein:serum protein ratio >0.5 or
• a pleural LDH:serum LDH ratio >0.6 or
• a pleural LDH over two-thirds of the upper limit of normal serum LDH.
Glucose
Pleural glucose is low in pleural infection, rheumatoid pleurisy and malignancy (where it indicates that pleurodesis is less likely to be successful).
pH
A pH should be requested on all non-turbid samples; analysis of turbid samples is unnecessary and may damage the blood gas analyser. Heparinize the sample in a blood gas syringe and alert the laboratory that the sample is pleural fluid. A pleural pH <7.2 suggests pleural infection and is a powerful indication for intercostal drainage.
Others
Analyses that may be useful when specific aetiologies are suspected include amylase (pancreatitis, oesophageal rupture), haematocrit (haemothorax), rheumatoid factor (rheumatoid effusions), triglycerides and cholesterol (chylothorax and pseudochylothorax, respectively).
Cytology
May identify malignant cell populations and provides a differential cell count:
• neutrophils: any acute effusion, e.g. parapneumonic, PTE
• lymphocytes: TB, especially if >80% of the total population; malignancy, including lymphoma
• mesothelial cells: often seen in transudates, but not a helpful aetiological discriminator.
Synovial fluid
Normal synovial fluid is clear, colourless to pale yellow and contains very few cells. Features on analysis suggestive of disease are:
• pus or increased total cell (particularly neutrophil) count: found in inflammation and infection
• white colour: suggests urate crystals or cholesterol
• crystals on light microscopy: urate crystals are needle-shaped and have negative birefringence; calcium pyrophosphate crystals are rhomboid with positive birefringence; note, local anaesthetic used in the procedure may appear as negatively birefringent crystals
• uniform blood staining: florid synovitis or trauma
• organisms on Gram-stain or culture.
Ascitic fluid
Normal ascitic fluid is clear. Cloudy fluid suggests infection; blood is in keeping with malignancy; bile suggests a bilious communication and milky fluid, lymphatic obstruction. Features on analysis suggestive of disease are:
• protein: ascites with a protein concentration below 25 g/L is usually due to cirrhosis, whereas a protein concentration above this (or serum: ascites albumin ratio below 1.5) can be found in infection, malignancy and hepatic venous obstruction
• amylase: a high amylase level (>1000 U/L) is found in pancreatic ascites
• glucose: a low level suggests malignancy or TB
• white cells: a leucocyte count above 250/mm 3 suggests infection, e.g. spontaneous bacterial peritonitis (see p. 163)
• cytology: may reveal a malignant cell population.
ECG INTERPRETATION
An electrocardiogram (ECG) is a graphic representation of the electrical activity of the heart and does not necessarily indicate myocardial contractility. ECG machines record the electrical activation of cardiac muscle cells which results in the depolarization of cell membranes. The difference in polarity between the activated cell membrane and adjacent cells results in electrical currents that can be detected by electrodes attached to the patient’s skin.
This section reviews the features that define a normal ECG trace, provides examples of common ECG abnormalities and proposes a structured approach to ECG interpretation. Guidance on performing an ECG can be found in ‘Procedures’, p. 65. Details on the management of arrhythmias and cardiac ischaemia can be found in ‘Arrhythmias’, p. 132 and ‘Chest pain’, p. 125, respectively.
ECG analysis
Modern ECG machines produce ‘12-lead’ ECG recordings using 10 electrodes. This apparent discrepancy reflects the fact that the word ‘lead’, in this context, refers to a virtual line along which electrical signals travel, rather than a physical electrical connection.
A typical ECG trace of a normal single heart beat is shown in Figure 3.1. Einthoven assigned the letters P, Q, R, S and T to the individual deflections of the ECG trace in 1901. Each waveform corresponds to a step in the propagation of electrical signals through the heart. The voltage baseline of the trace is known as the isoelectric line.
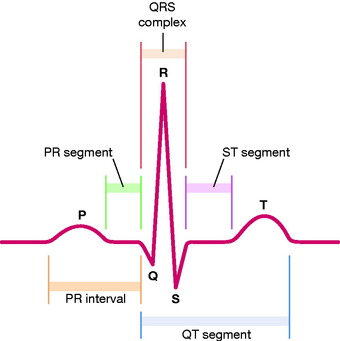 |
| Figure 3.1 The PQRST complex. |
The ECG is a key diagnostic tool in the investigation of many cardiac, pulmonary and metabolic conditions. The order in which you look at the individual features on the trace is less important than making a complete and comprehensive assessment. However, the scheme of ‘rate, rhythm, axis, waves and intervals’ is commonly used because the rate and rhythm can help to direct further assessment.
Rate and rhythm
Rate
To determine the heart rate, divide 300 by the R-R interval, counted in the number of large boxes. The normal heart rate is 60–100 b.p.m. In tachycardia, the heart rate is >100 b.p.m.; in bradycardia it is <60 b.p.m.
The ECG trace should be regular and every P wave should be followed by a QRS wave after a constant time interval. However, normal variations are common, including:
• sinus arrhythmia: phasic alteration of the heart rate with respiration
• sinus bradycardia: may be normal in athletic individuals, but can be due to pathological processes or drugs; see below
• sinus tachycardia: usually due to an increased sympathetic drive associated with exercise, emotion, pregnancy, but also associated with pain or general systemic upset.
Rhythm
Look at the rhythm strip or, if none is available, lead I, II or V1 where P waves should be clearly visible. Determine:
• whether the rhythm is regular: mark the peaks of consecutive R waves on a piece of paper placed on top of your trace; the interval should remain constant when you move the piece of paper onto another section of the ECG
• the rate: calculate this based on the R-R interval as suggested above; for irregular rhythms calculate an average value or range.
Rhythm disorders
An arrhythmia describes a rhythm other than sinus rhythm and should be categorized according to the following:
• rate: tachyarrhythmias (>100 b.p.m.) and bradyarrhythmias (<60 b.p.m.)
• regularity
• likely origin: narrow or broad complex.
These distinctions are largely self-explanatory and the first two have been covered earlier in this section. The differentiation between broad and narrow complex arrhythmias is an important one. Narrow complex rhythms originate above the AV node and are therefore conducted down the normal route through the ventricles. Broad complex arrhythmias are defined by a QRS duration >0.12 s (three small boxes) and originate either within the ventricles, or above the AV node with aberrant conduction down a pre-existing bundle branch block. They are important to identify as true ventricular arrhythmias are often poorly tolerated and more dangerous. A description of the common types of arrhythmia is found in ‘Identification of arrhythmias’, below.
Axis
Leads I, II, III, aVR, aVR and aVL can be used to determine the electrical axis of the heart in the frontal plane. This reflects the overall direction of the depolarization wavefront as it travels through the heart.
The electrical axis is determined by a hexaxial reference system (Fig. 3.2). To use this system, identify which lead of the six above has the most equiphasic QRS complex (where the positive and negative deflections of the QRS complex appear roughly equivalent). Select the lead that runs perpendicular to this lead on the hexaxial reference diagram. The electrical axis is then determined by looking at the polarity of the QRS complex in this perpendicular lead on the ECG trace. If the QRS deflection in the perpendicular lead is positive, the electrical axis is positive. For example, if the most equiphasic lead is I, the perpendicular lead will be aVF; if the QRS deflection on the ECG is positive in aVF, the electrical axis will be +90°.


• normal axis: −30° to +90°
Stay updated, free articles. Join our Telegram channel
Full access? Get Clinical Tree
