Chapter 30 Integration of Metabolism
Insulin Is a Satiety Hormone
Insulin is the hormone of the well-fed state. Its synthesis and release are powerfully stimulated by glucose, and this effect is potentiated by amino acids. Therefore the plasma level of insulin is highest after a carbohydrate-rich meal. The list of insulin effects given in Table 30.1 shows that insulin stimulates the utilization of dietarynutrients, including glucose, amino acids, and triglycerides. It diverts excess nutrients into the synthesis of glycogen, fat, and protein.
Table 30.1 Metabolic Effects of Insulin
| Tissue | Affected Pathway | Affected Enzyme |
|---|---|---|
| Liver | ↑ Glucose phosphorylation | Glucokinase |
| ↑ Glycolysis | Phosphofructokinase-1,* pyruvate kinase† | |
| ↓ Gluconeogenesis | PEP-carboxykinase, fructose-1,6-bisphosphatase,* glucose-6-phosphatase | |
| ↑ Glycogen synthesis | Glycogen synthase† | |
| ↓ Glycogenolysis | Glycogen phosphorylase† | |
| ↑ Fatty acid synthesis | Acetyl-CoA carboxylase,† ATP-citrate lyase, malic enzyme | |
| ↑ Pentose phosphate pathway | Glucose-6-phosphate dehydrogenase | |
| Adipose tissue | ↑ Glucose uptake | Glucose carrier |
| ↑ Glycolysis | Phosphofructokinase-1 | |
| ↑ Pentose phosphate pathway | Glucose-6-phosphate dehydrogenase | |
| ↑ Pyruvate oxidation | Pyruvate dehydrogenase† | |
| ↑ Triglyceride utilization (from lipoproteins) | Lipoprotein lipase | |
| ↑ Triglyceride synthesis | Glycerol-3-phosphate acyl transferase | |
| ↓ Lipolysis | Hormone-sensitive lipase† | |
| Skeletal muscle | ↑ Glucose uptake | Glucose carrier |
| ↑ Glycolysis | Phosphofructokinase-1 | |
| ↑ Glycogen synthesis | Glycogen synthase† | |
| ↓ Glycogenolysis | Glycogen phosphorylase† | |
| ↑ Protein synthesis | Translational initiation complex |
Most of the other insulin effects included here are actions on the rate of synthesis or degradation of the affected enzyme.
PEP, Phosphoenolpyruvate.
* Insulin acts indirectly by promoting the dephosphorylation of phosphofructokinase-2/fructose-2,6-bisphosphatase, thereby increasing the level of fructose-2,6-bisphosphate.
† Insulin acts by promoting the dephosphorylation of the enzyme.
On a minute-by-minute time scale, insulin dephosphorylates metabolic and regulatory enzymes, thereby stimulating glycolysis and glycogen synthesis while inhibiting gluconeogenesis and glycogenolysis (see Chapter 22).
Glucagon Maintains the Blood Glucose Level
The secretion of glucagon from the pancreatic α-cells is increased twofold to threefold by hypoglycemia and reduced to half of the basal release by hyperglycemia. Acting through its second messenger cyclic AMP (cAMP), glucagon up-regulates the blood glucose level when dietary carbohydrate is in short supply. Its actions on the pathways of glucose metabolism are opposite to those of insulin (Table 30.2), but, unlike insulin, glucagon acts almost exclusively on the liver; it has negligible effects on adipose tissue, muscle, and other extrahepatic tissues.
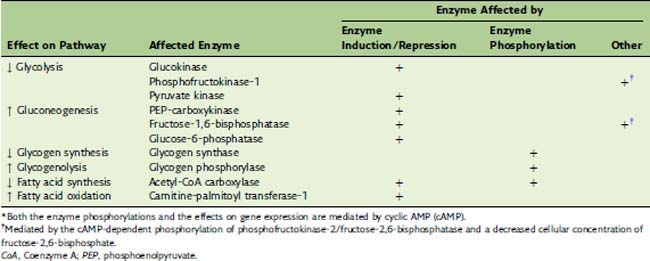
Catecholamines Mediate the Flight-or-Fight Response
The metabolic actions of the catecholamines are summarized in Table 30.3. These actions, which appear within seconds, are part of the flight-or-fight response. Most important is the mobilization of fat and glycogen reserves for use by the muscles. In muscle tissue itself, the major effects are stimulation of glycogen degradation and glycolysis.
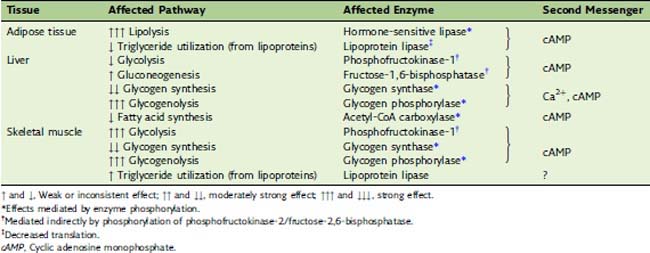
The regulatory metabolite fructose-2,6-bisphosphate activates phosphofructokinase-1 in muscle, as it does in the liver (see Chapter 22). However, the phosphofructokinase-2/fructose-2,6-bisphosphatase of skeletal muscleis different from the liver enzyme. Its kinase activity is not inhibited but is stimulated by cAMP-induced phosphorylation. Therefore the catecholamines, acting through β receptors and cAMP, stimulate rather than inhibit glycolysis in skeletal muscle.
Glucocorticoids Are Released in Chronic Stress
Stress, especially chronic stress, stimulates cortisol secretion from the adrenal cortex through corticotropin-releasing factor from the hypothalamus and adrenocorticotropic hormone (ACTH) from the anterior pituitary gland. The metabolic actions of cortisol and other glucocorticoids (Table 30.4) can best be understood as adaptations to life in a dangerous world.
Table 30.4 Important Metabolic Actions of Cortisol and Other Glucocorticoids*
| Tissue | Affected Pathway | Affected Enzyme |
|---|---|---|
| Adipose tissue | ↑ Lipolysis | Lipases |
| Muscle tissue | ↑ Protein degradation | ? |
| Liver | ↑ Gluconeogenesis | Enzymes of amino acid catabolism, PEP-carboxykinase |
| ↑ Glycogen synthesis | Glycogen synthase |
PEP, Phosphoenolpyruvate.
* The glucocorticoid effects are mediated by altered rates of enzyme synthesis.
Energy Must Be Provided Continuously


or the Mifflin-St. Jeor equation:
where Constant = 5 for males and −161 for females.
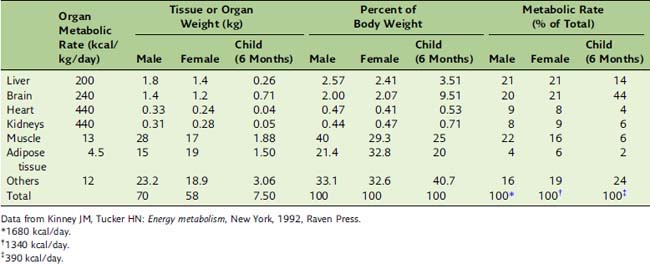
BMR depends on body composition. Men tend to have a higher BMR per body weight than do women because men have relatively more muscle than fat (Table 30.5). Women need more fat as an energy reserve for pregnancy, and men traditionally needed more muscle to fight over the women.


The fat in adipose tissue contains almost 100 times more energy than do the combined glycogen stores of liver and muscle (Table 30.6). Therefore only fat can keep us alive during prolonged fasting. It is easy to calculate that with fat stores of 16 kg and BMR of 1500 kcal/day, people can survive for about 100 days on tap water and vitamin pills alone, actually 125 days if we assume that the metabolic rate in prolonged fasting is 20% below BMR. The time to death on a hunger strike depends on the fat reserves, but survival times near 100 days are typical.
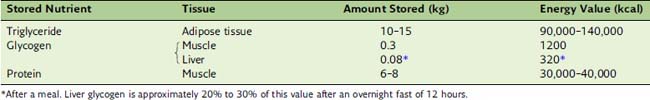
Figure 30.1 shows some of the changes in blood chemistry during the transition from the well-fed state to starvation. The most important hormonal factor is the balance between insulin and its antagonists, especially glucagon. During fasting, the plasma level of insulin falls, whereas first epinephrine, then glucagon, and finally cortisol levels rise.
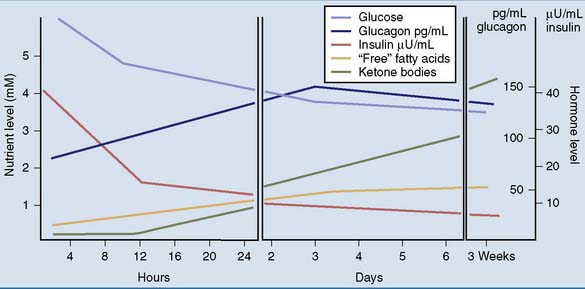
Figure 30.1 Plasma levels of hormones and nutrients at different times after the last meal. mM, mmol/liter.
Adipose Tissue Is the Most Important Energy Depot
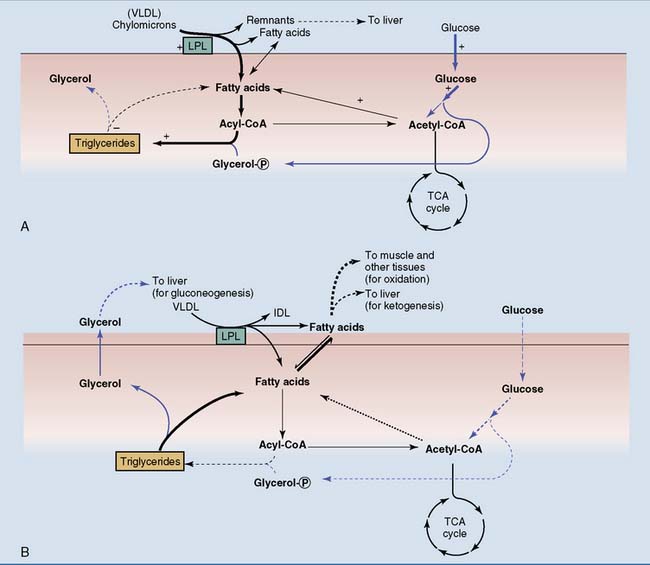
Plasma free fatty acids are low after a carbohydrate meal because lipolysis in adipose tissue is inhibited by insulin, and fat synthesis is stimulated. Insulin also stimulates the lipoprotein lipase in adipose tissue but not in muscle after a meal, thus routing the dietary triglycerides in chylomicrons to adipose tissue (Fig. 30.2).
The Liver Converts Dietary Carbohydrates to Glycogen and Fat after a Meal
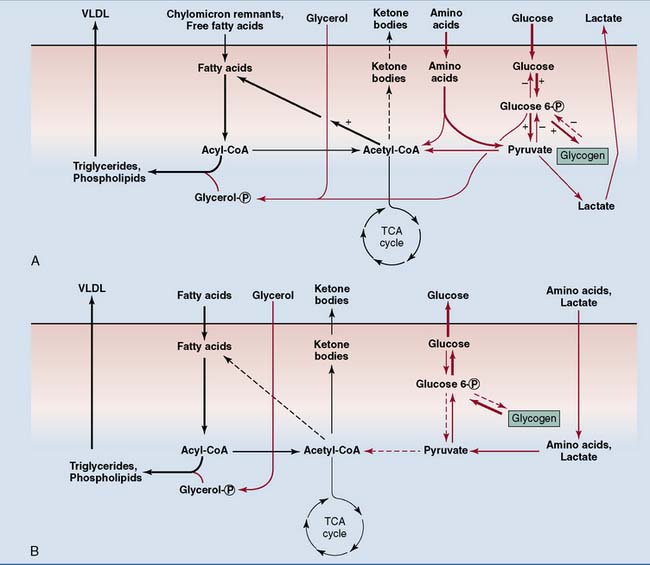
The liver converts at least two thirds of its glucose allotment into glycogen after a meal. Most of the rest is metabolized by glycolysis, but amino acids rather than glucose provide most of the liver’s energy needs after a mixed meal. Much of the acetyl coenzyme A (acetyl-CoA) from glycolysis is channeled into the synthesis of fatty acids and triglycerides. In the liver, glycolysis is the first step in the conversion of carbohydrate to fat. Triglycerides and other lipids from endogenous synthesis in the liver are exported as constituents of very-low-density lipoprotein (VLDL). Insulin coordinates this process by stimulating both glycolysis and fatty acid biosynthesis (Fig. 30.3).
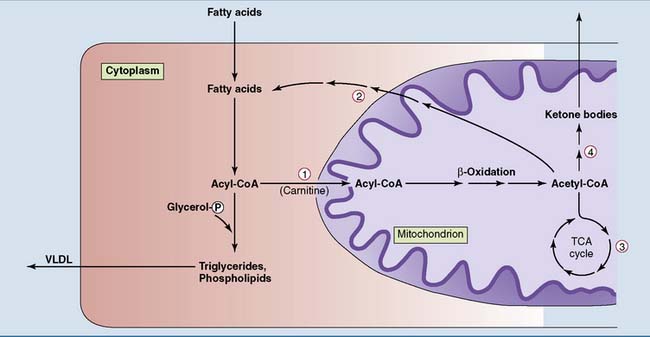
 Carnitine acyl transferase-1 is induced in the fasting state. It also is acutely inhibited by malonyl-CoA, the product of the acetyl-CoA carboxylase reaction when fatty acid biosynthesis is stimulated after a carbohydrate-rich meal.
  Acetyl-CoA carboxylase is induced in the well-fed state. It is inhibited in the fasting state by high levels of acyl-CoA, low levels of citrate (direct allosteric effects), and a high glucagon/insulin ratio (leading to phosphorylation and inactivation).
  The tricarboxylic acid (TCA) cycle is inhibited when alternative sources supply ATP and NADH. Therefore a high rate of β-oxidation reduces its activity.
  The ketogenic enzymes are induced during fasting. VLDL, Very-low-density lipoprotein.
The Liver Maintains the Blood Glucose Level during Fasting
In the fasting state, the liver has to feed the glucose-dependent tissues. The brain is the most demanding customer. It is the most aristocratic organ in the body; therefore, it requires a large share of the communally owned resources. Although it accounts for only 2% of the body weight in the adult, it consumes approximately 20% of the total energy in the resting body (see Table 30.5). This large energy demand is covered from glucose under ordinary conditions and from glucose and ketone bodies during prolonged fasting. The brain oxidizes 80 g of glucose per day in the well-fed state and 30 g during long-term fasting.
Three to four hours after a meal, the liver becomes a net producer of glucose. After this time liver glycogen is the major source of blood glucose until 12 to 16 hours after the last meal, when gluconeogenesis becomes the major and finally the only source of glucose. This switch is required because liver glycogen stores are almost completely exhausted after 48 hours. More than half of the glucose produced in gluconeogenesis is from amino acids. Other substrates are glycerol from adipose tissue and lactic acid from erythrocytes and other anaerobic cells (Fig. 30.4).
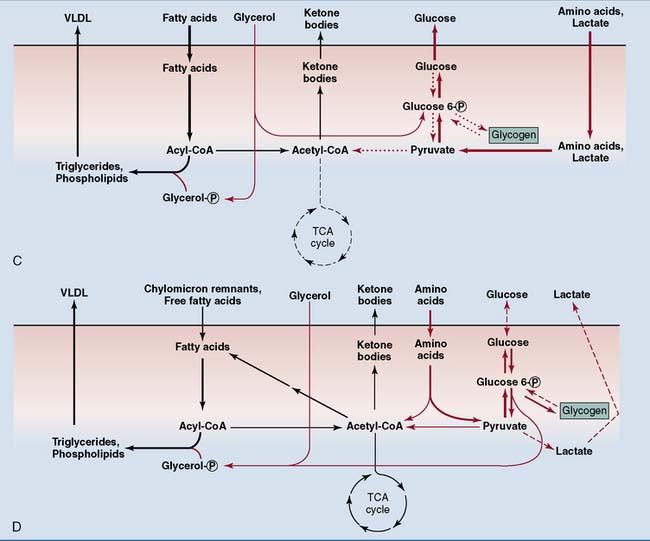
Most tissues switch from glucose oxidation to the oxidation of fatty acids and ketone bodies during the transition from the well-fed to the fasting state. Consequently, total body glucose consumption falls (Fig. 30.5). Only tissues that depend on glucose for their energy needs, including brain and red blood cells, do not respond to insulin. They continue to consume glucose even during long-term fasting. The switch from glucose oxidation to fat oxidation leads to a decline of the respiratory quotient (see Chapter 21) from about 0.9 after a mixed meal to slightly above 0.7 in the fasting state.
Ketone Bodies Provide Lipid-Based Energy during Fasting
The fasting liver has two options for the metabolism of these fatty acids (see Fig. 30.3). One option is esterification into triglycerides and other lipids for export in VLDL, which is released by the liver at all times. The fatty acids of VLDL lipids are made from dietary carbohydrate after a meal but come from adipose tissue during fasting.
The acetyl-CoA that is formed in β-oxidation must be partitioned between the tricarboxylic acid (TCA) cycle and ketogenesis. The activity of the TCA cycle depends on the cell’s need for ATP. It is inhibited by ATP and a high [NADH]/[NAD+] ratio (see Chapter 21). β-oxidation produces NADH and, indirectly, ATP. By inhibiting the TCA cycle, these products divert acetyl-CoA from TCA cycle oxidation to ketogenesis.
Ketogenesis amounts to an incomplete oxidation of fatty acids. Whereas the complete oxidation of one molecule of palmitoyl-CoA produces 131 molecules of ATP (see Chapter 23), its conversion to acetoacetate and β-hydroxybutyrate produces 35 and 23 molecules of ATP, respectively. The conversion of 50 g of fatty acids to acetoacetate during a hungry day supplies enough energy to synthesize 190 g of glucose from lactic acid without any need for the TCA cycle.
Why does the liver convert fatty acids to ketone bodies when carbohydrates are in short supply? The main reason is that the brain can oxidize ketone bodies but not fatty acids. Although the brain obtains almost all of its energy from glucose under ordinary conditions, it covers up to two thirds of its energy needs from ketone bodies during prolonged fasting, when ketone body levels are very high. This reduces the need for gluconeogenesis and thereby spares body protein. Liver metabolism in different nutritional states is summarized in Figure 30.4.
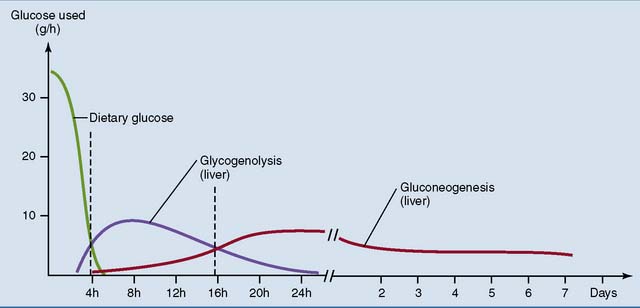
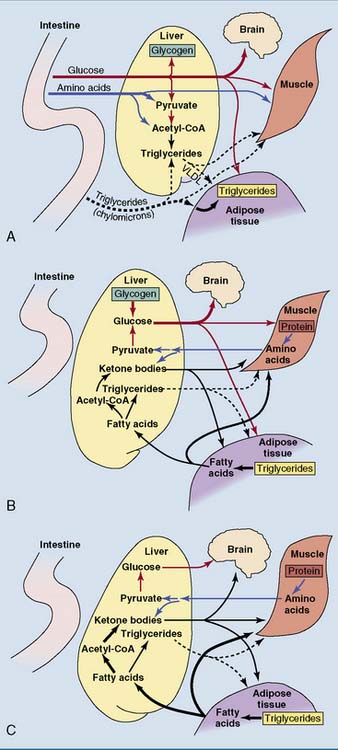
The nutrient flows in the body change dramatically in different nutritional states. Figure 30.6 shows the flow of nutrients after different kinds of meal. Figure 30.7 shows the changes during the transition from the well-fed state to prolonged fasting. The intestine provides for all of the body’s needs after a mixed meal, but adipose tissue and liver assume this role during fasting.
Obesity Is the Most Common Nutrition-Related Disorder in Affluent Countries

BMI of 20 to 24.9 kg/m2 is considered normal, BMI between 25 and 29.9 signifies overweight, and BMI of 30 or greater indicates obesity. The prevalence of overweight and obesity in different population groups in the United States during the early 1990s is listed in Table 30.7. The problem has worsened since then. In the United States, 31.1% of adult men and 33.2% of adult women were found to be obese (BMI ≥30) in 2003 and 2004.
Table 30.7 Prevalence of Overweight and Obesity among Adults 20 Years and Older in Different Population Groups in the United States, 2003–2004
| Male | Female | |
|---|---|---|
| Overweight or Obese (BMI ≥25) | ||
| White | 70.6 | 58.0 |
| Black | 69.1 | 81.6 |
| Mexican | 76.1 | 75.4 |
| Obese (BMI ≥30) | ||
| White | 31.1 | 30.2 |
| Black | 34.0 | 53.9 |
| Mexican | 31.6 | 42.3 |
BMI, Body mass index.
Data from Kuczmarski RJ, Flegal KM, Compbell SM, et al: Increasing prevalence of overweight among US adults. The National Health and Nutrition Surveys, 1960 to 1991, JAMA 272:205–211, 1994.


