Initiating and Managing Therapy
OBJECTIVES
The reader will be able to:
- Suggest an approach for initiating a dosage regimen for an individual patient, given patient population pharmacokinetic and pharmacodynamic data and the individual’s measurable characteristics.
- Describe why a pharmacokinetic or pharmacodynamic parameter in an individual patient is well known if the value in a typical population is known and its variability is small.
- Discuss why loading doses are sometimes given for drugs with half-lives in minutes and not given for drugs with half-lives in days.
- State why several sequential doses, instead of just one, are sometimes used as a loading dose.
- Explain why plasma concentration monitoring is useful for some low therapeutic index drugs but not others.
- Briefly discuss how tolerance to therapeutic and adverse effects can influence the chronic dosing of drugs.
- Discuss why adherence to the prescribed regimen is so important in drug therapy.
- Discuss why, for some drugs, dosage needs to be tapered downward gradually over time on discontinuing therapy.
- Describe how population information can be used to obtain initial estimates of an individual’s pharmacokinetics.
- Upon evaluation of a pharmacokinetic problem observed during chronic drug therapy, ascribe the problem to a change in bioavailability, adherence, clearance, volume of distribution, or a combination of these values.
- Revise pharmacokinetic parameters of digoxin and vancomycin from measured plasma concentration data acquired under either steady-state or nonsteady-state conditions.
- Use the revised parameters (in the last objective) to calculate any modification in dosage required to ensure that the plasma concentration lies within the therapeutic window.
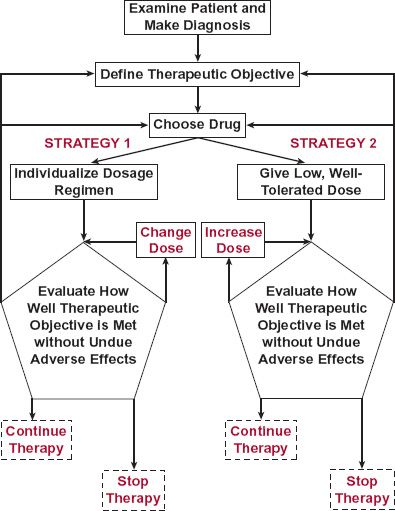
 s previously discussed, drugs are administered to achieve a therapeutic objective. Once this objective is defined, a drug and its dosage regimen are chosen for the patient. This choice is based on the assumption that the diagnosis is correct and with the expectation that the drug will be effective. Subsequently, drug therapy is often initiated and managed by one of two strategies shown schematically in Fig. 18-1.
FIGURE 18-1. Scheme showing two strategies for initiating and managing drug therapy. The dashed line in strategy 1 indicates that changes in dosing rate may be carried out, but the main expectation is that the regimen has already been tailored to the needs of the individual patient. This is in contrast to strategy 2 in which the dosing rate starts low and is increased to find the patient’s dosage requirement.
Management is usually, to one degree or another, accomplished by monitoring the incidence and intensity of therapeutic and adverse effects. In the first strategy, a “usual” dosage regimen anticipated for the patient is administered and adjusted only if the desired response is inadequate or an adverse response is excessive. In the second strategy, an individual’s dosage requirements are established by initially giving a low dose and then titrating the dose upward based on assessment of therapeutic and/or adverse end-points. Both strategies probably reach a similar optimal dosage regimen; only the method of getting there differs.
The first strategy is primarily based on population pharmacokinetics and pharmacodynamics, that is, on what is known about the general tendencies and variabilities in dosage–exposure (pharmacokinetics) and exposure–response (pharmacodynamics) relationships. This strategy also allows a degree of individualization of the regimen based on specific information about the individual patient. Most of the subsequent discussion revolves around this strategy. The second strategy, involving dose adjustment to measured effects, clearly is also a means of individualizing dosage and managing therapy.
This chapter examines pharmacokinetic and pharmacodynamic issues in the initiation (starting dose) and management (maintenance regimen) of drug therapy in both the patient population, in general, and the individual patient. It brings together, from previous chapters, many points presented there, often in other contexts.
ANTICIPATING SOURCES OF VARIABILITY
Choosing the right dose, loading dose and dosing rate, for patients with a given disease or condition is best accomplished when the sources of variability in the response to the drug are well understood and when there are good correlates between response and easily measured patient characteristics. First, consider the issue of the causes of variability.
Obviously, the desired therapeutic objective would be most efficiently achieved if the individual’s dosage requirements could be established before administering the drug. In the absence of this information, one must often rely on knowledge from a typical patient population. In Chapters 12 to 17, we examined variability in drug kinetics and response. The question before us now is how to handle this information in treating individual patients.
PHARMACODYNAMIC VARIABILITY
In the pie chart of Fig. 18-2, the sources of pharmacodynamic variability of a hypothetical drug are indicated. For this drug, it is apparent that most of the variability in response is genetically related. Clearly, pharmacogenomic correlates of exposure and response could be very useful to guide therapy of this drug (e.g., trastuzumab). Such information would be useful to identify individuals who are unlikely to respond, and so would not be given the drug (e.g., trastuzumab), or who are likely to respond differently (have a different dosage requirement, exhibit a peculiar adverse event, or show an increase in the incidence of usual adverse events) to a given drug. As an example, recall, from Chapter 13, Genetics, the β-agonist albuterol in which response has been found to correlate with genotypic status. Knowing a patient’s genotype may well help in selecting an appropriate dosage regimen for this individual.
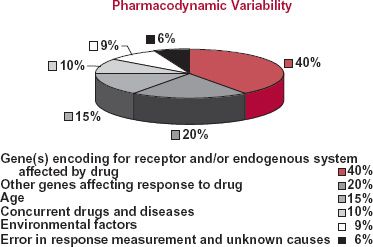
FIGURE 18-2. Schematic representation of the pharmacodynamic variability in drug response within the patient population. The variability occurs for various reasons. In this hypothetical analysis, six different categories causing the variability are identified along with the percent of the total variability associated with each category.
The data in the pie chart also suggest that one may be able to individualize dosage based on other factors, such as age, concurrent diseases, and environmental factors. The questions to be asked are how much of the variability can be captured by patient-specific information and whether or not major adjustment in the dosage or movement to another therapeutic procedure is needed.
PHARMACOKINETIC VARIABILITY
As discussed in several previous chapters, variability in dose–exposure relationships has an impact on the overall response to drugs. Again, one may be able to predict the dosage in an individual patient based on patient-specific information. The general approach is to move from population pharmacokinetic parameter estimates to those most likely to apply to the individual patient.
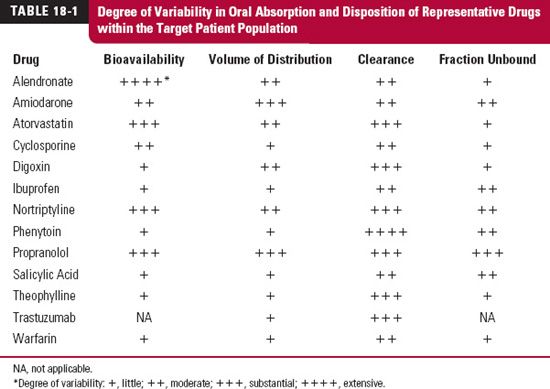
The first step is to identify the most variable parameters within the patient population. Variability in the various pharmacokinetic parameters within the patient population differs widely among drugs, as shown in Table 18-1 for several representative drugs. For some drugs, such as digoxin and propranolol, there is variability in absorption but for different reasons. With digoxin, the variability in absorption is caused primarily by differences in pharmaceutical formulation and efflux transport (involving P-glycoprotein) of the drug in the intestines, but with propranolol, it is caused by differences in the extent of first-pass hepatic metabolism. For other drugs, such as phenytoin, the only substantial source of variability is clearance. With others, the antiviral protease inhibitors and the statins included, significant variability exists in both absorption and disposition parameters.
The next step is to try to accommodate as much of the variability as possible with measurable characteristics. If the characteristic is discrete and independent, this can be achieved by partitioning the population into subpopulations. For example, as illustrated for clearance in Fig. 18-3, the discrete characteristics are hepatic disease and smoking (which are known to be important determinants of theophylline clearance). The population can be divided into four categories: (a) those who smoke and have no hepatic disease, (b) those who smoke and have hepatic disease, (c) those who have hepatic disease but do not smoke, and (d) those who neither have hepatic disease nor smoke. The frequency distribution for the entire population is determined from the relative size and shape of the distribution curve of each subpopulation. If, on the other hand, the measurable characteristic is continuous, such as age, weight, or renal function, it may be possible to find a functional relationship with one or more pharmacokinetic parameters, such as that seen between the renal clearance of ganciclovir, an antiviral agent, and creatinine clearance, a graded measure of renal function (Fig. 18-4). Clearly, the dosing rate of this drug should be reduced in patients with impaired renal function to avoid excessive adverse effects.
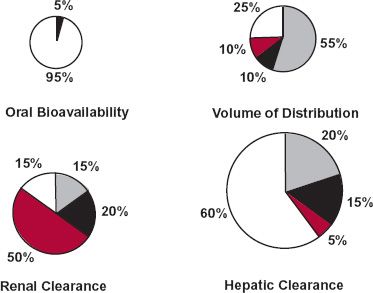
To envisage how the entire strategy would work, consider the data in Fig. 18-5 (page 532) for a drug, partly metabolized in the liver and partly excreted unchanged in the urine, for which population pharmacokinetic parameter values are: oral bioavailability, 0.73; volume of distribution, 83 L; renal clearance, 2.7 L/hr; and metabolic clearance, 14.1 L/hr. Depicted are four tablets, representing these four parameters. The size of each tablet is a measure of variability (coefficient of variation) of that parameter within the patient population. For this drug, oral bioavailability is the least variable and hepatic clearance is the most variable. Stated differently, greatest confidence exists in assigning the population value of oral bioavailability to the patient; least confidence exists in assigning the population value of hepatic clearance to the patient. Moreover, as the population value for hepatic clearance is much greater than that for renal clearance, variability in total clearance within the population is also high.
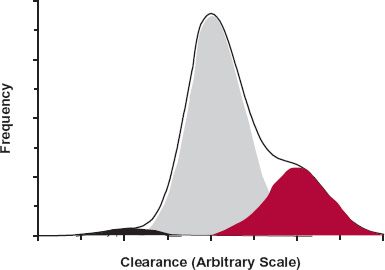
FIGURE 18-3. The frequency distribution of clearance of a drug within a total patient population (heavy line) is a function of the shapes of the frequency distributions within the various subpopulations that comprise the total patient population and the relative sizes of each of these subpopulations. In this simulation, the variables are smoking and hepatic disease, and the subpopulations are: those who neither have hepatic disease nor smoke (75%), the majority (shaded gray); those who smoke but have no hepatic disease (22.5%) (shaded in red); those who have hepatic disease but do not smoke (2%) (shaded in black); and those who both smoke and have hepatic disease (0.5%). The size of the last subpopulation is too small to be readily seen in this figure. The average values for clearance in the four subpopulations were set at 1, 1.5, 0.5, and 0.75 U, respectively, assuming that smoking increases clearance by induction and that clearance is reduced in hepatic disease.
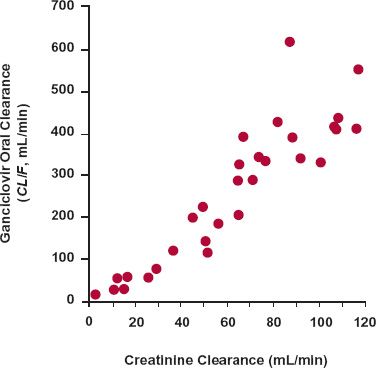
FIGURE 18-4. The apparent total body clearance (Dose/AUC or CL/F) of ganciclovir after oral administration of its prodrug, valganciclovir, increases linearly with creatinine clearance, a measure of renal function. Note that there is very little clearance when the renal function approaches zero (no creatinine clearance), indicating that this drug depends almost completely on renal excretion for its elimination. To maintain a comparable systemic exposure to the drug in patients with renal function impairment, the dosage of the drug needs to be decreased in proportion to the decrease in creatinine clearance. (From: Czock D, Scholle C, Rasche FM, et al. Pharmacokinetics of valganciclovir and ganciclovir in renal impairment. Clin Pharmacol Ther 2002;72:142–150.)
FIGURE 18-5. Schematic representation of variability in various pharmacokinetic parameters within a patient population. The size of each tablet is related to the degree of variability in the parameter. The portion of each tablet labeled with body weight (gray), age (black) or renal function (colored) reflects the fraction of total variability captured by each of these patient-specific measures.
Not unexpectedly, body weight accounts for most of the variability in volume of distribution and for some of the variability in hepatic clearance. Age, separated from its influence on body weight, accounts for some of the variability in hepatic clearance and, to a lesser extent, in volume of distribution. Renal function accounts for half of the variability in renal clearance. Surprisingly, perhaps, renal function helps to explain some of the variability in metabolic clearance and volume of distribution. Drug distribution and metabolism can be altered in patients with renal function impairment, because such patients manifest many systemic effects associated with this end-stage disease. Only 5% of the variability in oral bioavailability can be accounted for but, as mentioned, its value is small and acceptable. Correcting the population pharmacokinetic parameters for the patient’s weight, age, and renal function should give reasonable individual estimates of F, V, and CLR but little confidence in the estimate of CLH and, hence, total clearance.
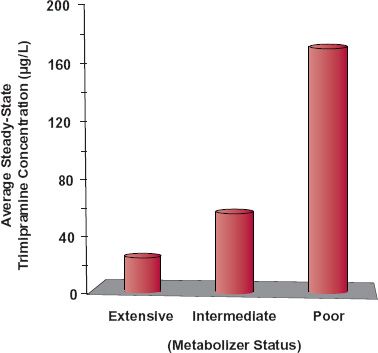
Genetics, concurrent disease(s), and associated concomitant medication undoubtedly play a role in determining CLH, but the variability produced by them is not accounted for by the observed patient-specific information. Markers of genetic control of drug metabolism have been developed for some drugs that help to explain much of their inherited interindividual differences in metabolic clearance (Chapter 13, Genetics). An example (Fig. 18-6) is that of the antidepressant trimipramine. Like nortriptyline, this drug is primarily eliminated by CYP2D6-catalyzed metabolism. The patient population can be divided into four groups: (a) poor metabolizers (5%–10% of population), intermediate metabolizers (10%–15%), extensive metabolizers (65%–80%), and ultrarapid metabolizers (5%–10%). The last two groups are combined in the figure. The group to which an individual belongs can be determined by genotyping (pharmacogenomic test) or phenotyping. Phenotyping might involve a urine test of drug/metabolite ratio following a single dose of drug. The higher the ratio, the lower the amount of metabolite formed and the poorer the metabolic status of the individual, although renal function can affect the ratio thereby complicating the interpretation of this test.
FIGURE 18-6. The daily maintenance dose of the antidepressant trimipramine depends on an individual’s genotype. Without adjusting for genotype of CYP2D6, the average steady-state concentrations of trimipramine and its active metabolite, desmethyltrimipramine, vary greatly between the genotypes, identified here as extensive (including ultrarapid metabolizers), intermediate, and poor metabolizers. The concentrations are calculated from single-dose data for a regimen of 75 mg twice daily. The metabolite concentration (not shown) also goes up in the groups with intermediate and poor metabolism, a result of the demethylation reaction forming the metabolite (CYP2C19) not being affected by the genotype of CYP2D6, the enzyme responsible for hydroxylation of both trimipramine and desmethyltrimipramine. (From: Kirchheiner J, Müller G, Meinke I, et al. Effects of polymorphisms in CYP2D6, CYP2C9, and CYP2C19 on trimipramine pharmacokinetics. J Clin Psychopharmacol 2003;23:459–466.)
Another example is that of patients placed on thiopurine drugs (Chapter 13, Genetics) for which measurement of thiopurine S-methyltransferase activity can identify those patients likely to show severe adverse effects to drugs in this class, unless the normal dose is reduced accordingly. Pharmacogenomic information and its application in drug therapy are likely to become more common in the future. At the very least, knowledge of a patient’s genotype can sensitize a clinician to a patient’s needs before starting treatment. The clinician would then initiate therapy in this patient more cautiously, thereby reducing the risk of adverse events.
The pharmacokinetic approach presented previously for predicting an individual’s optimal dosage regimen before administering a drug is based on the assumption that little interindividual variability in pharmacodynamics exists. This is, of course, frequently not so. Many times, the majority of variability in drug response within a patient population is of pharmacodynamic origin. Although knowing the mean pharmacokinetic parameters of the drug may help to explain the time course in response, quantifying pharmacokinetic variability then adds little to our ability to predict individual dosage. Nonetheless, the basic strategy still holds, namely, to determine the relative contribution of measurable characteristics, such as age and weight, to drug response within the patient population, and then to use the individual’s characteristics to predict his or her therapeutic dosage regimen. Frequently, however, age, weight, and other measurable characteristics fail to account for much of the variability in pharmacodynamics. Then, there is little choice but to start the individual patient on a typical dosage regimen, which may be far from the individual’s requirement, and to monitor and adjust the regimen based on the patient’s response to the drug. When the drug has a low therapeutic index or when there is no urgency to starting therapy, it may be prudent to start with a low, generally safe dose and titrate up to the individual patient’s need for the drug (strategy on right in Fig. 18-1). Let us now apply this information to initiating and managing drug therapy.
INITIATING THERAPY
The first dose given depends on the strategy used to treat a patient. There are situations in which the first dose needs to be smaller than the maintenance dose. For other drugs, a loading dose larger than the maintenance dose may be appropriate.
CHOOSING THE STARTING DOSE
Let us examine situations requiring a starting dose different from the maintenance dose and the determinants of its size. The argument was presented in Chapter 11, Multiple-Dose Regimens, that a priming or loading dose may be needed to rapidly achieve a therapeutic systemic exposure and, therefore, a therapeutic response. There are times when this strategy is appropriate and times when it is not.
When is a Loading Dose Needed? One consideration is the urgency of drug treatment. Recall from Table 10-1 (Chapter 10, Constant-Rate Input) that a loading dose is recommended for esmolol, a drug given by intravenous (i.v.) infusion to treat lifethreatening supraventricular tachycardia. With a half-life of only 9 min, one would expect steady state to be reached in about 30 min; however, this is too long to wait in this emergency situation. By giving the loading dose at the time the infusion is started, an effective systemic concentration can be achieved within less than 5 min. The infusion thereafter maintains therapy. This strategy is relatively common to other drugs given by i.v. infusion (see Table 10-1).
When a loading dose is required, it may comprise the full therapeutic regimen. Consider the choice of an oral loading dose for the antimalarial, mefloquine hydrochloride. To treat patients with mild-to-moderate malaria caused by Plasmodium vivax or mefloquine-susceptible strains of Plasmodium falciparum, a loading dose of 1250 mg (five 250-mg tablets) is recommended. No maintenance dose is required because the drug has a 3-week half-life, a period of time sufficient to cure the patient. It is of interest to note in passing that the maintenance dose of mefloquine as a prophylaxis for the prevention of malaria is 250 mg once weekly, starting 1 week before going to areas where malaria is endemic and continuing for 4 weeks after returning from the area. The accumulation index of this drug on this regimen is 5 (Eq. 11-10 in Chapter 11, Multiple-Dose Regimens). Thus, the average amount of mefloquine in the body at steady state (F ≈ 1.0) is about 1250 mg, the level found to be effective for treating an acute episode of malaria.
Adverse reactions often give rise to no loading dose being used or to the need to administer the loading dose over a period of time, but a short time relative to the drug’s half-life. Another antimalarial drug serves as a good example of this situation. For treating an acute attack of chloroquine-sensitive malaria, chloroquine phosphate is given orally in a loading dose of 1000 mg initially, followed by 500 mg in 6 to 8 hr, and then 500 mg on each of 2 successive days for a total of 2500 mg. Again, this treatment completes therapy as the half-life of the drug is about 40 days. The reason for the divided loading dose is to reduce the occurrence of adverse effects (headache, drowsiness, visual disturbance, nausea, and vomiting, which, in the worst scenario, may lead to cardiovascular collapse, shock, and convulsions). These effects can occur within minutes of ingestion of a single 2500-mg loading dose.
The need for a loading dose is also a question of the kinetics of the pharmacodynamic response. Certainly, a loading dose is unnecessary for antidepressants, antihyperlipidemic agents, and agents used to treat and prevent osteoporosis. For these drugs, the therapeutic response takes from weeks to months to fully develop. Although a loading dose may shorten the time somewhat to achieve a therapeutic response, the major cause of the delay is in the response of the body to the drug. An example of a drug in this category is alendronate, an agent used to treat and prevent osteoporosis in postmenopausal women. As shown in Fig. 18-7, the increase in bone mineral density, a likely surrogate endpoint of the therapeutic use of the drug, namely, a reduction of bone fracturing, takes months, if not years, to fully develop.
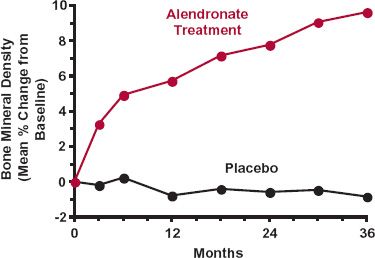
FIGURE 18-7. Time course of the change from baseline in bone mineral density following 10 mg of alendronate sodium daily in postmenopausal women with osteoporosis. Mean data for both treated (colored) and placebo (black) groups are shown. Note the time required for development of the effect, a surrogate of the desired reduction in frequency of bone fractures. (From: 2005 Physicians’ Desk Reference. Montvale, NJ: Thomson PDR, 2005:2051.)
What Should the Loading Dose Be? A loading dose is a consideration for drugs with half-lives of 24 hr or more when they are administered in a convenient once-a-day or twice-a-day regimen. In these situations, the size of the loading dose may be anticipated from a pharmacokinetic perspective. The loading dose can be approximated from the amount accumulated in the body at plateau on chronic dosing and knowledge of the bioavailability. It might also be estimated from the window of concentrations associated with optimal therapy. As an example, consider the individual patient for whom data were presented in Fig. 18-5. As the ratio F/V strongly influences the peak plasma concentration after a single dose, reasonable confidence can be expected in estimating the patient’s loading dose based on body weight, if required. This particularly applies to the administration of drugs to both very small and very large adults and to infants and children for whom the volume of distribution is expected to deviate extensively from that of a typical patient.
DOSE TITRATION
For those drugs that do not require an immediate response, a logical and safe procedure to initiate therapy is to titrate dosage in the individual. Dosage is adjusted until the desired therapeutic response is obtained without undue adverse effects. This procedure is recommended for several drugs. Flecainide acetate is an example of a drug dosed in this manner. For patients with paroxysmal supraventricular tachycardia, the recommendation is to start with 50 mg every 12 hr. Doses are then increased in 50-mg increments every 4 days until an optimal response is obtained. The 4-day interval between changing the dosing rate is based on the observation that at least 2 to 4 days is required to achieve a steady state of drug effect. This is not surprising from a pharmacokinetic point of view, because the half-life of the drug ranges from 12 to 27 hr in patients.
Another example is valproic acid, an agent used to treat complex partial seizures. When given alone, therapy is initiated with 10 to 15 mg/kg per day in divided doses. The dosage is increased by 5 to 10 mg/kg per week until optimal control of seizures is achieved. Optimal clinical response is usually achieved with daily maintenance doses below 60 mg/kg per day. With terazosin, an agent used to symptomatically treat patients with an enlarged prostate and sometimes to treat hypertension, the recommendation is similar. The initial dose is 1 mg at bedtime. The nightly dose is increased in a stepwise fashion, based on blood pressure response, to 2 mg, then to 5 mg, then to 10 mg, or until the desired improvement in urine flow rate is achieved by relaxing the smooth muscles in the bladder neck. Daily doses of 10 mg are typically required. Accumulation of this drug is not very extensive on once-daily administration of a fixed regimen as the half-life is about 12 hr. Careful and slow upward titration of dosage reduces the incidence of severe postural hypotension and syncope and explains, in part, why weeks to months of treatment are often required to achieve the optimal response.
MANAGING THERAPY
For some drugs, there is a standard maintenance dosage regimen that works in almost all patients, with adjustments made for infants, children, and perhaps the elderly, especially those who are frail. For other drugs, therapy is frequently monitored and dosage is optimized by continual assessment of therapeutic or adverse effects, or both. For still a few others, measurement of plasma drug concentration is incorporated into the strategy for drug utilization. One of the key considerations that determines how therapy is managed is the therapeutic index of the drug.
LOW THERAPEUTIC INDEX
Stay updated, free articles. Join our Telegram channel

Full access? Get Clinical Tree


