- what inequalities in health are and why they are amenable to change;
- different axes of inequalities in health, how to measure them and their cumulative effect on health;
- understand different life course patterns of health inequalities and what they tell us about the disease;
- understand and interpret relative and absolute health inequalities;
- understand possible mechanisms to minimise health inequalities and the role that doctors can play in achieving this.
Definitions: what are health inequalities?
Health inequalities are variations in health between population groups resulting from a variety of societal and economic processes that are unequally distributed within or between populations.
Health inequalities do not arise because of mere physiological (‘normal’) differences between population subgroups. For example, we will not characterise as inequality the higher incidence of breast cancer in women compared to men because it is explained by inherent biological characteristics (e.g. volume of breast tissue and hormonal levels). However, if a higher breast cancer incidence were to be partly determined by reduced access and/or standard of care among women compared to men, this would then constitute a gender inequality.
The World Health Organisation (WHO) distinguishes between health inequalities and health inequities, defining health inequalities as all types of variations in health (e.g. a different prevalence of dementia by age group would be referred to as a health inequality) and health inequities as those variations that are ‘attributable to the external environment and conditions mainly outside the control of the individuals concerned’ (WHO, ). However, before the WHO made this distinction, the term health inequalities was already well established and has continued to be used in the UK and elsewhere (in research as well as in government) to refer exclusively to those variations in health that are avoidable and ‘unfair’ as described in the first paragraph. Thus, following this tradition, this is how the term health inequalities is used in this chapter.
There are great variations in the magnitude and direction of health inequalities across populations and over time, indicating that health inequalities are modifiable and the likely result of changes in specific exposures. A recent review on the decline of cardiovascular disease in high income countries highlighted however, that the role of the social determinants in explaining this decrease is often context-dependent (Harper et al., ). The socioeconomic patterning of adiposity also illustrates this. Obesity is currently more prevalent among poor people in high income countries but among rich people in low income countries (McLaren, ; Subramanian et al., 2011). The socioeconomic patterning of adiposity within a country has changed in successive cohorts. The higher prevalence of adiposity we observe in today’s poorer children in rich income countries like the UK did not exist in cohorts born earlier in the century. These changes over time and across countries are due to environmental, and therefore modifiable, factors. These factors relate to an individual’s choices of diet and physical activity, as well as to the societal determinants of equal access to and affordability of healthy diet and opportunities for physical activity that are differently distributed across socioeconomic groups.
Axes of inequalities, how to measure them and current patterns
Societies develop and maintain systems of social stratification along multiple dimensions. We present here four different but interrelated axes of inequalities: socioeconomic position including social class; geography; gender and ethnicity or race.
Socioeconomic inequalities in health
Socioeconomic position (SEP) refers to the social and economic factors that influence what positions individuals or groups hold within the structure of a society (Lynch and Kaplan, ). A variety of other terms, such as social class or socioeconomic status, are often used interchangeably although they have different theoretical bases and, therefore, interpretations. There is no single best indicator of SEP suitable for all study aims and applicable at all time points in all settings. Each indicator measures different, although related, aspects of socioeconomic stratification. SEP measures are based on individual characteristics such as educational level, occupation (NS-SEC and previously the Registrar General Social Class in the UK), household condition or amenities and income. However, especially when using routine datasets, an area-based or ecological measure is derived, based on census-derived variables (e.g. percentage of unemployed and low income) to produce a deprivation indicator, for example the Index of Multiple Deprivation (Communities and Local Government, 2008; Scottish Government, ; Welsh Government, 2011) which can then be used to characterise small geographical areas where individuals live. This is often done in ecological studies (see Chapter 5).
The magnitude of inequality for a given outcome can be expressed in terms of the relative index of inequality (RII) or, for absolute differences, the slope index inequality (SII). These indices summarise the inequalities that arise throughout the whole population and not just the extreme groups. They are useful when comparing inequalities across countries or over time as they also take into account changes in the size of the socioeconomic groups, such as the decrease over time of people working in manual occupations. It is important to note that the unit over which the RII and SII are calculated may vary. As some of the examples in this chapter illustrate it can be an area (comparing the hypothetically best-off with the worst-off areas as in Figure 18.1) or an individual (comparing the hypothetical person with the lowest occupational level with the person with the highest occupational level as in Figure 18.2).
Figure 18.1 Relative Index of Inequality (RII) of premature mortality (0–64 years) from 1921 to 2007 in Britain.
Source: Adapted from Thomas et al. ().
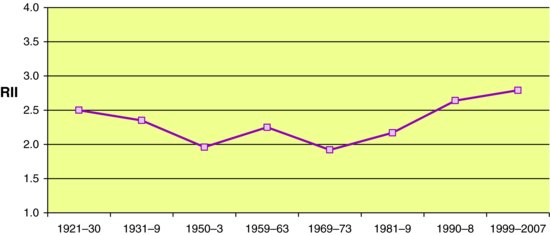
Figure 18.2 Absolute (slope index of inequality) and relative (relative index of inequality) inequalities in mortality rates of NS-SEC classes (socioeconomic groups based on occupation) by year (2001 as reference year=100), in men aged 25–64 in the UK.
Source: Adapted from Langford and Johnson ().
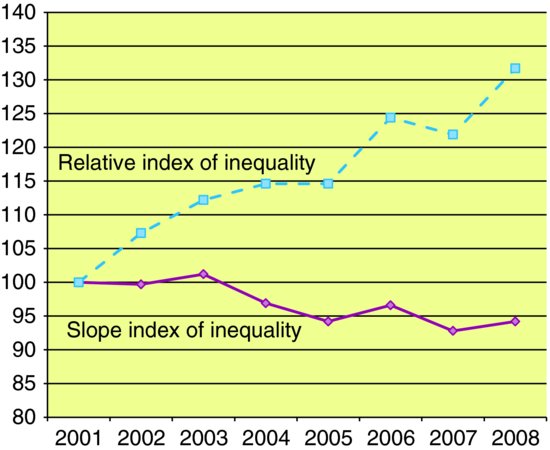
Figure 18.1 shows the RII of premature mortality from 1921 to 2007 in Britain using the Breadline Britain Index, a measure of poverty (Thomas et al., ). The RII is interpreted as the relative rate of mortality for the hypothetically worst-off compared with the hypothetically best-off areas (in this case parliamentary constituencies), assuming a linear relationship between poverty and mortality risk. From an initial almost 2.5 times higher risk of premature mortality in the worst–off area, the differentials diminished until the early 1970s, showing that health inequalities can be diminished, but have been increasing in recent decades, reaching a peak at 2.8. It is important to note though that this recent increasing trend in inequalities is in relative terms and has occurred in the presence of an increasing life expectancy across all population groups. Thus, the increase in relative inequalities currently arises because of a faster improvement in health in best-off areas compared to the improvement in the worst-off areas (see Section on p. 166 Relative versus absolute health inequalities).
Geographical inequalities
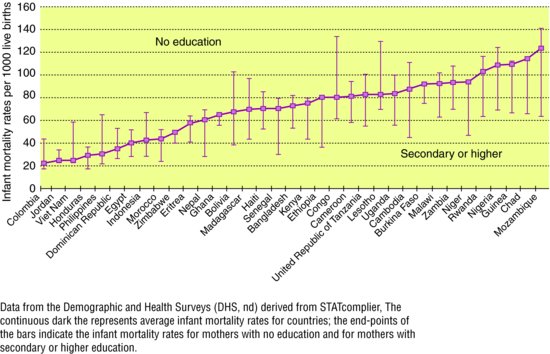
Geographical inequalities in health have been extensively described between and within countries. The recent WHO Commission on Social Determinants of Health highlighted the extent of variation in health inequalities across the globe (WHO, ). Figure 18.3 shows the variation between countries in infant mortality from just over 20/1,000 live births in Colombia to just over 120 in Mozambique. The lowest mortality rate of 2/1,000 live births is in Iceland (not in the graph). In addition, the figure shows dramatic inequalities within countries as the differences in survival between offspring of educated and non-educated mothers.
Figure 18.3 Infant mortality rates between countries and within country by mother’s educational group.
Source: Reproduced from WHO Commission on the Social Determinants of Health (2008).
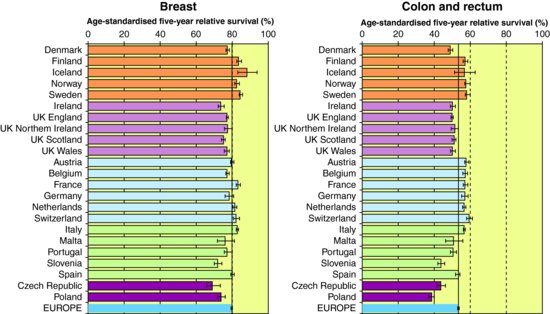
Inequalities in health persist also between rich nations. The variation in cancer survival rates across 21 European countries shows that survival is lower in UK than the European average (Figure 18.4) (Eurocare, 2012). This has been the driver of several initiatives in the UK to ensure earlier diagnosis of cancer, such as the National Awareness and Early Diagnosis Initiative for cancer. Finally, similar large variations have been described within rich countries. Figure 18.5A shows that within a small area of London important differences in life expectancy remain. Travelling east from Westminster the life expectancy of a man decreases nearly one year at each stop of the London Underground, resulting in a six year difference from a men leaving in Canning Town. These differences are even larger in Glasgow (Figure 18.5B).
Figure 18.4 Age-standardised five-year relative survival of breast and colon and rectum cancers in 21 European countries.
Source: Reproduced from EUROCARE-4 Database on Cancer Survival in Europe (2012).
Stay updated, free articles. Join our Telegram channel

Full access? Get Clinical Tree


