Fig. 3.1
Workflow of fluorescent in situ hybridization (FISH) methodology (a) and the different types of probes used for DNA-FISH (b)
The most widely used targets are metaphase chromosomes , providing the possibility to study whole chromosomes or chromosome regions. Its sensitivity in terms of spatial resolution (5–10 Mb) is limited essentially by the degree of chromosome condensation [47, 55]. For metaphase chromosome analysis it is necessary that the sample exhibits mitotic activity per se or that it is prone to cell culturing and propagation. The only way to analyze (fixed) chromosomes is to block cell division in metaphase, the cell cycle stage in which chromosomes are clearly visible as individual entities. This is made by cells’ exposure to mitotic blocking agents (e.g., colchicine, colcemid, vinblastine) [45].
But one of the great advantages of FISH technology is the possibility to analyze nondividing cells by the identification of some chromosomal aberrations in interphase nuclei (Interphase-FISH ) and simultaneously increase the resolution (50 kb–2 Mb) [47]. This approach is particularly useful in some tumors, like lymphomas and solid tumors that present low mitotic indexes and wherein the preparation of high-quality metaphase chromosomes is often difficult [45, 55]. I-FISH allows a rapid screening of numerical chromosomal abnormalities and the identification of specific structural rearrangements, such as translocations using breakpoint-flanking probes, among others [9, 45]. In addition, I-FISH can be performed on paraffin-embedded and formalin-fixed tissue sections, which allow a possible correlation between chromosome aberrations and biologic and clinical outcomes (e.g., [56, 57]).
Released chromatin fibers (Fiber-FISH) from interphase nuclei provide high-resolution target analysis on microscope slides (5–500 kb) [47, 58]. Due to its powerful application in gene mapping, Fiber-FISH can be applied to the detection of chromosomal rearrangements when the analysis of the order of different sequences is the main objective and cannot be accessed by FISH-based approaches with lower resolution, as in the case of micro-inversions. This approach allows accurate sizing of gaps and overlaps between probes [47]. However, the use of Fiber-FISH has been limited to research laboratories rather than clinical ones, because of the complexity of the procedures involved [59].
The need to define even with higher-resolution chromosomal rearrangements led to the development of cytogenetic analysis approaches that are beyond the cytological targets. This was achieved by the introduction of DNA microarrays in the cytogenetic analysis [60]. Generally, microarrays are constructed from various-sized genomic targets ranging from bacterial artificial chromosome (BACs; 80–200 kb in size) clones to synthetic oligonucleotides (25–85 bp in length), which are spotted on a glass surface on the array [61, 62]. Once the genomic targets are spotted strategically in the array, where genomic position of each clone is exactly known, it is possible to identify specific chromosomal abnormalities such as amplifications and deletions [62]. The resolution of the array depends on the genomic coverage, which is restricted by the density and size of the clones [47, 62]. Array platforms can be designed for whole genomes or for specific genome regions, such as specific chromosomes or chromosomal segments [63]. Currently, several platforms are commercially available for several species, namely human, mouse, rat, among many others (e.g., http://www.microarrays.com/). Section “Microarrays Based Cytogenetics” will address the types of microarrays for cytogenetic analysis and its importance in detecting chromosomal abnormalities in rodent tumors.
DNA Probes
Typically, the probe consists of a cloned nucleic acid (mainly a DNA) sequence. In addition, probes of oligonucleotides and synthetic nucleic acids, peptide nucleic acids (PNA) [28, 64], and Locked Nucleic Acids (LNA) [65, 66] can be designed for improvement of both sensitivity and resolution. According to the target sequence, the probes can be subdivided into two major classes: single copy and repetitive probes (Fig. 3.1b). The first correspond to probes that are specific for unique sequences , which are typically present in euchromatin and in specific loci. This class includes probes for a particular locus (genes), band, region, or even chromosome arm or whole chromosome. The second class of probes targets sequences that are naturally repeated in the genomes (repetitive) and the majority are located in heterochromatin . These regions are present in centromeres, the primary constrictions of chromosomes, and in telomeres, but can also be found interstitially along the entire chromosome. The majority of these sequences are common to a number of chromosomes from the complement (some—pan—are common to all the chromosomes). Nevertheless, there are also chromosome-specific repetitive probes, as it is the case of human chromosomes. In addition, probes for ribosomal DNA genes (NOR probes), which are tandemly arranged, are also grouped in this class.
Single-Copy Probes
The sequencing of genomes from several species, including human, mouse, and rat, has enabled the availability of genomic DNA sequences (especially coding genes) cloned in vectors, such as bacterial artificial chromosomes (BACs) or P1-derived artificial chromosomes (PACs) , which assists the generation of locus -specific probes (LSPs) [12, 53]. Considering the spatial resolution of the cytological targets, the use of these vectors permits the detection of specific genomic regions, such as protein-coding genes that typically comprise about 100 kb [29], allowing performing gene mapping. In FISH experiments using LSP s (BAC clones), hybridization occurs only between the insert in the vector (sequence of interest) and the complementary target sequence. However, since the total BAC vector is labeled, even the regions not involved in the hybridization are also detected, and targets as small as genes can be identified.
In addition to gene mapping, LSPs can be used for assessing copy number changes involving specific chromosome regions/genes, such as deletions, duplications, and dmin’s that are common in solid tumors [67, 68]. These probes are also a valuable resource in the validation and more detailed characterization of inter- and intrachromosomal rearrangements, such as translocations and inversions [23]. LSP probes can be designed for a specific gene, a translocation breakpoint, or another DNA sequence [12, 53]. Additionally to metaphase spreads’ analysis, these probes can also be used in interphase nuclei, which allow a rapid screening of chromosomal abnormalities that are often tumor specific, such as the BCR/ABL fusion gene associated with the translocation t(9;22)(q34;q11.2) in chronic myeloid leukemia (CML) and the PML/RARA fusion gene associated with t(15;17)(q22;q12) in acute promyelocytic leukemia (APL). LSPs spanning the breakpoint region can be applied in a dual-color FISH experiment for two different chromosome regions/genes involved in a reciprocal translocation, and the translocation can thus be identified by color overlap in interphase nuclei [9]. Currently, LSPs are commercially available for the referred and other specific chromosome translocations followed by chimeric gene fusions that are common in hematological disorders [9].
Probes for larger genomic regions are also widely available; entire genomes (described in more detail in section “Multicolor Banding”) are probed for specific chromosomes (known as whole chromosome painting (WCP) probes) [69, 70], chromosome arms [71], bands, or regions [72]. These specific probes are typically obtained by procedures that allow isolation of specific chromosomes or chromosome segments. To date, the most successful and almost universally used approach for preparing probes of entire chromosomes is fluorescent activated cell (chromosome) sorting (FACS) , a method designed to physically separate chromosomes based on their size and AT/GC composition [73]. Then, the DNA correspondent to a specific chromosome is subjected to a primary degenerated oligonucleotide primed PCR (DOP-PCR) with a universal primer (e.g., 6MW) [70]. The primary PCR products are further amplified in a second DOP-PCR , thus providing the template for labeling [74]. In the case of mouse chromosomes, their similar size makes the isolation of each chromosome by FACS difficult [75]. However, the use of specific mouse strains has overcome these difficulties [46]. Another approach, laser microdissection , provides an excellent opportunity to isolate chromosomes or chromosome segments (a chromosome arm, band, or region) [76]. This technology employs a focused laser beam to extract a defined microscopic area in metaphase chromosomes, which were previously transferred onto a microscope slide covered with a polyethylene–naphthalate supporting membrane. Probes are generated by laser microdissection by catapulting from 8 to 15 copies of the chromosome or segment of interest from the slide into a microtube [77]. This material is then amplified by the DOP-PCR-based method referred above and direct /indirectly labeled [77, 78]. Other methods like nick translation or random primed labeling are also suitable for labeling these probes [78]. It is important to notice that these probes are not “unique” in their sequence. Actually, it may contain disperse repetitive elements or, in case of WCPs, also centromeric repeats, which can result in unwanted nonspecific hybridization all over the genome. This problem is overcome by in situ suppression hybridization [69], where repetitive sequences are suppressed by addition of an excess of unlabeled DNA fractions enriched in repetitive sequences (e.g., cot-1 DNA) to the hybridization mixture [12, 69]. Currently, in addition to human, mouse, and rat, chromosome-specific paints are commercially available for a vast number of vertebrate species.
The main application of WCPs is the detection of translocations involving nonhomologous chromosomes [12], being the detection of intrachromosomal changes, like deletions, duplications, or inversions limited with these probes (Fig. 3.2). However, the combination of these with other probes is an excellent resource for the cytogenetic characterization of rodent tumors (e.g., [23, 48, 67]).
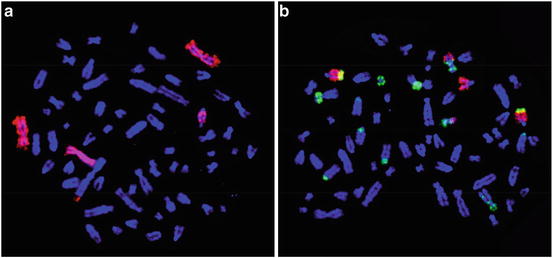
Fig. 3.2
Representative images of WCP with painting probes from Rattus norvegicus and Mus musculus in metaphase preparations from the rat tumor cell line CLS-ACI-1: (a) rat painting probe for chromosome RNO6 (labeled with digoxigenin and detected with anti-dig-rhodamine, red signal); (b) mouse chromosomes MMU5 (labeled with biotin and detected with avidin-FITC, green signals) and MMU11 (labeled with digoxigenin and detected with anti-dig-rhodamine, red signals)
Works carried out by our group reflect the applicability of WCPs and LSPs in the cytogenetic characterization of rodent tumors. Louzada et al. [23] performed the first cytogenetic characterization of HH-16 cl.2/1 rat mammary tumor cell line using a multi-cytogenetic approach, which included G-banding, chromosome painting using rat and mouse probes, and BAC/PAC clones’ hybridization [23]. G-banding permitted a global analysis of the numerical and structural chromosomal abnormalities, and WCPs and BAC/PAC clones (LSPs) allowed the characterization of the clonal evolution of this cell line by the accurate detection of complex chromosome rearrangements and breakpoint regions. This analysis enabled the identification and characterization of different cell subclones, which allowed inferring ancestral rearrangements as well as the reconstruction of the clonal evolution that occurred during this tumor progression. In silico analysis of the breakpoint regions detected in the cell line demonstrated that almost all contain genes in the rat genome for which the human homolog has been associated with breast cancer. Among these, Erbb2 and Mycn oncogenes were selected by the authors for further FISH analysis with specific BAC clones, which revealed their amplification (one of the mechanism for oncogene activation) [23]. This study allowed a deeper characterization of this cell line, and importantly, it demonstrated its potential as a model for breast cancer research.
Finally, probes generated from rearranged chromosomes can be applied for reverse chromosome painting, called reverse-FISH [79]. In this approach, WCP probes generated from flow-sorted or microdissected rearranged chromosomes are hybridized onto normal metaphase spreads and the content and breakpoints of that rearranged (derivative) chromosome can be revealed [47, 79]. In a mouse model of plasmacytoma (BALB/c mouse plasmacytoma, MOPC 315), typically harboring a balanced t(12;15) chromosomal translocation deregulating the expression of the proto-oncogene c-myc (by the result of the IgH/Myc fusion gene), two quimeric marker chromosomes were analyzed by reverse-FISH, which allowed the characterization of their composite nature and the exhibition of the t(12;15) breakpoint region in both of them, probably by the occurrence of a jumping translocation involving this region [80].
Each type of probe has a specific ability and provides very specific answers about chromosomal abnormalities [45]. The choice of the right probe or of the simultaneous use of a pool of probes in a multicolor approach, as well as the election of the most suitable target, depends on the purpose in question, the resolution needed, and the detail of information required.
Whole-Genome Analysis in a Single Experiment with FISH-Based Technologies
The development of metaphase chromosome analysis, as well as a vastly increased number and combination of probes, in association with probe labeling developments and significant advances in optical microscopy, allows nowadays a detailed and thorough analysis of tumor genomes. Currently, the screening of entire tumor genomes for chromosomal abnormalities is possible in a single experiment without prior knowledge of the chromosomal segments involved.
Multiplex-FISH and Spectral Karyotyping Analysis
The use of differently labeled WCPs combined in a single experiment led to the development of two main technologies that allow to delineate each individual chromosome of the complement in a single experiment: multiplex-FISH (M-FISH) using different fluorochrome-specific filters and a combinatorial labeling algorithm [81], spectral karyotyping ( SKY ) similar to M-FISH but using an interferometer-based spectral imaging [82], and combined binary ratio labeling (COBRA) that use simultaneously combinatorial and ratio labeling for probe discrimination [83]. By using computer-generated false colors, each chromosome is imaged with different colors, and a multicolor karyotype is obtained.
Since all chromosomes are analyzed simultaneously, no prior knowledge of the affected chromosome(s) is required and complex rearrangements in tumor cells can be rapidly identified, which is a great advantage in the analysis of tumor karyotypes that can be often highly complex. In a single procedure, each of these approaches is capable of detecting numerical and structural interchromosomal abnormalities involving large regions, such as interchromosomal translocations, dmin’s, and hsr’s [12, 84]. In fact, next after numerical chromosomal alterations and translocations in tumor cells, formation of unidentifiable marker chromosomes of multiple chromosomal origins is often common [85] and SKY has assisted greatly in the identification of the origin of such marker chromosomes [86]. The identification of aberrant chromosomes in rodent tumor models was greatly simplified by the introduction of M-FISH/SKY analysis on mouse [82] and rat chromosomes [87], and the current commercial availability of WCP probes (Applied Spectral Imaging, Inc). A wide variety of rodent models of human cancer, including hematological malignancies and solid tumors, were cytogenetically characterized and analyzed with a M-FISH/SKY approach (e.g., [29, 80, 82, 86, 88, 89]). With this approach, Coleman et al. [80] analyzed ten established BALB/c plasmacytomas in which the t(12;15) harboring the IgH/Myc fusion had been previously detected by G banding. But the sequential SKY analysis revealed that secondary chromosomal rearrangements were contributing to the tumor progression in BALB/c mice [80, 90, 91]. Recently, Falck and coworkers [86] used SKY to identify cancer-related aberrations in a well-characterized experimental model for spontaneous endometrial carcinoma (EC) in the BDII rat tumor model. The analysis of a set of 21 BDII rat EC revealed nonrandom numerical and structural chromosome alterations, including gain of chromosome 4, loss of chromosome 15, and structural rearrangements in chromosomes 3, 6, 10, 11, 12, and 20. Importantly, the nonrandom nature of these events suggests their potential contribution in the development of BDII EC [86]. Having the syntenic segments between rat and human as a guide and the analysis of specific genes located in chromosomes and regions involved in structural abnormalities in both rat and human EC, the discovery of potential genes influencing EC onset and progression is possible.
However, taking into account that the probes for SKY/M-FISH analysis are usually WCPs from the same species as the target, detection of rearrangements within the same chromosome like intrachromosomal translocations, duplications, deletions, and inversions is almost impossible (involving <3 Mb of sequence) [47, 55]. The same happens for very small markers or dmin’s, which cannot usually be unambiguously classified [55]. In these cases the limitations of SKY/M-FISH can be supplemented with other FISH-based approaches [90, 91] that will be addressed below.
Comparative Genomic Hybridization Analyses
Comparative genomic hybridization (CGH) technology was developed to overcome the difficulties in preparing high-quality metaphase spreads from solid tumors [92]. CGH is a potent and reliable technique that, in a single hybridization experiment, identifies and maps DNA copy number changes (gains and losses) on chromosomes (conventional CGH, i.e., cCGH), providing detailed information about tumor genomes [93]. Particularly frequent in solid tumors, copy number aberrations are expected to contribute to tumor evolution by inducing alterations in gene expression. Once no initial knowledge of the chromosome imbalance in the genome is required, CGH is used as a “discovery tool” [47]. This approach is based on the hybridization of differentially labeled tumor (test) and reference DNA from the standard counterpart (e.g., in red and green, respectively) on normal metaphase chromosomes under in situ suppression hybridization [92, 94]. The probes compete for complementary hybridization sites, which results in differences in fluorescence intensities along the chromosomes that are a consequence of changes in the tumor sample. In general, an even combination of red and green fluorescence is observed in a specific chromosome region if DNA is present in identical copy numbers in both reference and tumor genome [47]. The presence of losses or gains results in a shift to green or red staining, respectively. After image capturing and karyotyping, the fluorescence ratios are quantified using digital image analysis and a copy number change profile of tumor genome along the chromosome length is produced [54, 55]. Quantification is thus a crucial step for a precise CGH analysis. In terms of spatial resolution, its sensitivity is mainly limited by the degree of chromosome condensation on the reference metaphase chromosomes. However, it is also influenced by copy number changes. In fact, despite the resolution limit in metaphase chromosomes (5–10 Mb), amplifications in small regions (minimum 50 kb) can be detected if the copy number change is high [55].
In contrast with other FISH-based technologies, CGH has the enormous advantage of not needing tumor cell culturing and metaphase chromosomes for screening. DNA can be extracted from fresh or frozen tumor tissue or even from formalin-fixed paraffin-embedded tissues [57, 95]. These procedures involve the extraction of DNA from a cell population; however, advances in CGH have enabled its application to the analysis of single cells, allowing the analysis of clonal heterogeneity [96, 97].
CGH has been applied to a variety of rodent models , from solid (e.g., [93]) to hematological tumors (e.g., [98]), and has been a valuable tool for genome-scale analysis. Kogan and coauthors [98], through CGH analysis of murine APL, identified recurrent gain of chromosomes 7, 8, 10, and 15 and recurrent loss of chromosome 2, which, based on orthologous regions, correspond to karyotype abnormalities in human APL. The analysis of chromosome copy number abnormalities in murine APLs may facilitate the identification of genetic changes that cooperate with the fusion protein PML/RARA to cause acute leukemia [98], which can improve the diagnosis, therapy, and outcome of this pathology.
A detailed and precise analysis of human and rodent tumor models allowed the determination of a specific pattern of chromosomal gains and losses that is a landmark of a specific tumor (e.g., [25, 93, 99]). In fact, in most studies, a concordance between the rodent and the human patterns for specific tumors was reported (e.g., [25, 29, 30, 89, 93]). As an example, Christian et al. [93] used the CGH approach to analyze mammary carcinomas in rats that were induced by 2-Amino-1-methyl-6-phenylimidazol[4,5-b]pyridine (PhIP), the most prevalent of the known carcinogenic heterocyclic amines in the human diet that was implicated in human cancers as breast cancer [100]. The analysis of rat carcinomas’ imbalanced regions seems to represent a signature pattern for PhIP-induced carcinomas. Moreover, these regions are located on orthologous regions of human chromosomes and deletions on these regions are reported as involved in human breast cancer [99]. In addition to specific patterns analysis, several CGH studies in rodent models focus on the study of specific genes that play a known and important role in carcinogenesis (e.g., [98]). The analysis of genomic imbalances in mammary tumors of BRCA1 conditional mutant mice, with a similar pattern to human breast carcinomas [29, 30, 89], reveals that chromosomal regions involved in genomic imbalances are orthologous to human, and harbor tumor-related genes like Erbb2, p53, or c-Myc. The CGH analysis performed by Weaver and colleagues [89] revealed a gain and loss, respectively, in the distal and proximal regions of chromosome 11, syntenic to human chromosomes 17q11-qter and 17p, which comprise Erbb2 oncogene and the tumor suppressor gene p53. Furthermore, a whole or partial gain of chromosome 15 and consequently of c-Myc oncogene was also observed. Recently, Heiliger et al. [31] analyzed copy number changes in 30 murine tumors from aTrk-T1transgenic mouse model of thyroid neoplasia. The copy number analysis of murine thyroid tumors revealed novel gene alterations that are also prevalent in the human counterpart [31]. The comparison of genomic abnormalities in tumor genomes in rodent models and human cancer allows the discovery of novel candidate genes with a crucial function in the tumoral process, as well as a better understanding of the processes underlying carcinogenesis.
The applicability and advantages of CGH genome analysis are clear. However, this technology has some limitations. Firstly, no information is provided about the structural arrangements (e.g., duplications, isochromosome formations, dmin’s, and hsr’s) involved in the gains and losses. Secondly, balanced rearrangements such as translocations and inversions, in which no copy number is changed, cannot be detected. Thirdly, it is not possible to discriminate a whole genome copy number change such as it happens in ploidy [12, 47, 101].
Microarrays Based Cytogenetics
The advent of microarrays provided a description of chromosome abnormalities at a resolution that exceeds the microscopic analysis [47]. The array technology enhanced the cytogenetic analysis with the development of the array-CGH (aCGH) [60, 94, 102, 103]. In this approach, the tumor and normal genome are differentially labeled and co-hybridized to a microarray (Fig. 3.3 with cCGH and aCGH methodologies). Then, the array is scanned and the relative fluorescence intensities are calculated for each known mapped clone/sequence that is spotted in the array. DNA copy number changes are analyzed by the resulting intensity ratio [75]. Due to the resolution of the analysis that depends on the density and size of the clones on the array [61, 103], it is possible to detect changes in specific loci. The highest resolution for array CGH can be provided by high-density oligonucleotide arrays, which can detect very small alterations (100 kb) [62, 103]. Currently, another type of array is available for copy number changes assessment, which can provide resolution at a single nucleotide level, single nucleotide polymorphism-based arrays (SNP arrays) [47, 62, 104]. In addition to copy number alterations, this platform allows the identification of loss of heterozygosity (LOH) or copy number neutral loss (CNNL ) that cannot be detected using CGH-based arrays. SNP arrays allow the study of the contribution of LOH/CNNL to tumor onset and progression (for details see [62]).
Fig. 3.3
Schematic diagram of comparative genomic hybridization (CGH) methodologies, namely conventional CGH and array CGH
In addition to human diagnosis and research, the whole-genome analysis with aCGH has been performed in tumor studies in mouse (e.g., [105–111]) and rat models [112]. It is noteworthy that Hackett et al. [106] analyzed 40 mouse neuroblastoma (initiated by the TH-Mycn transgene) using an array comprised of 1056 BAC clones providing 5 Mb average resolution across the genome, and sub-Mb resolution in regions identified in previous genetic screenings [105]. Additionally, specific alterations detected by aCGH were validated by FISH with LSPs (BAC clones). Globally, the results obtained by Hackett et al. [105] demonstrated conservation of many genetic changes in mouse and human neuroblastoma. Recently, the same array platform was used by To et al. [110] to analyze DNA copy number alterations across the genomes of lung tumors in the Kras LA2 model of lung cancer on the inbred FVB/N mouse strain. This analysis showed a significant association between progressive increase of genomic instability and tumor size. Moreover, on smallest tumors the amplification of Kras was the only detectable change, which can suggest that this may be the earliest genetic event during lung tumor development in the Kras LA2 model [110]. Currently, aCGH platforms with variable resolutions are commercially available for mouse and rat genomes (Agilent Technologies). The online availability of CGH data for a wide range of human tumors (Progenetix database http://www.progenetix.org/) in addition to the mapping of conserved syntenies between the human, mouse, and rat genomes (e.g., ensembl database, http://www.ensembl.org/) allows an effective comparison between rodent and human tumors.
Array CGH is a powerful approach for detecting copy number changes with high resolution. However, like conventional CGH, chromosomal abnormalities that do not involve copy number changes, such as inversions or balanced translocations, cannot be accessed by aCGH. In 2003, Fiegler et al. [113] combined the reverse chromosome painting with microarray technology, in a process termed array painting, a modification of the array CGH method. In this approach, probes obtained from flow sorted (or microdissected) derivative chromosomes are amplified and the amplified products are differentially fluorescently labeled and co-hybridized onto a microarray [113, 114]. Array painting allows the rapid and efficient high-resolution mapping of chromosome translocation breakpoints restricted only by the density of clones on the array. In the last decade, several improvements in the resolution of microarrays for array painting applications were performed [114, 115]. In addition to balanced translocations, array painting can be used in the identification of rearrangements within the derivative chromosomes, such as inversions at the breakpoint region, deletions, and translocations or insertions of extra material from other chromosomes [47, 114].
Multicolor Banding
As referred previously, WCPs are powerless in detecting the precise location (mapping) of the breakpoints preceding a certain chromosome rearrangement or in the identification of an exact intrachromosomal rearrangement. To overcome these limitations, other approaches have been developed [116–118]. A set of subregional chromosome probes or partial chromosome painting (PCP) probes can serve as a base for the so-called multicolor banding (MCB/mBAND) [116, 117]. Generally, these subregional segments for MCB probe mixes are generated by microdissection [76, 116]. In some cases, FISH with WCPs may precede microdissection for accuracy in the identification of mouse chromosomes (known as FISH-microdissection) [119].
The MCB approach was established for all murine chromosomes (Fig. 3.4) by Thomas Liehr group [90, 91, 119–121]. MCB probes can unambiguously determine peri- and paracentric inversions and map breakpoints, but with metaphase chromosomes resolution. This approach was used for the characterization of rodent tumor cell lines [90, 91, 121, 122]. The first mBAND study for murine chromosomes is reported by Benedek et al. [122]. In this work, MCB probes were developed for chromosome 11, to further characterize the nature of the intrachromosomal rearrangements on this chromosome in BALB/c PreB ABL/MYC lymphocytes. With this approach, chromosomal rearrangements such as simple duplications, inverted duplications, deletions, translocations, and insertions were detected. Later, Karst et al. [90, 91] studied WMP2 cell line using SKY combined with five mouse-specific MCB probes for chromosomes X, 3, 4, 6, and 18, allowing the detection of five previously unrecognizable (by SKY) intrachromosomal rearrangements with nine breakpoints. This study demonstrated that cryptic abnormalities could easily be detected by MCB. More importantly, this effective cytogenetic characterization allows establishing a genotype/phenotype correlation. The continuous improvements in murine MCB probes allowed recently the first genome-wide high-resolution characterization of the extensively used murine tumor cell line NIH 3T3 using all 21 chromosome-specific murine MCB probe sets [121]. In addition to karyotype delineation, this approach can be used for detecting chromosomal imbalances such as the CGH analysis [117, 121]. The gains and losses of NIH 3T3 were aligned with the orthologous regions in the human counterpart in 18 human carcinomas, and a high rate of concordance was observed in the tumors originated from ectoderm (e.g., breast carcinoma, neuroblastoma, and glioma) [121].
Fig. 3.4
Combined image of multicolor banding (MCB) for all the 19 mouse autosomes and the X chromosome (adapted from [119])
In addition to the MCB approach, a YAC/BAC-based chromosome bar code can also work as a FISH-banding method. This has been done for mouse chromosomes [123, 124]. But there is a clever form of getting a multicolor banding of any genome, at least in theory, by using WCP probes from a different species than the one from the target in analysis (cross-species/ZOO-FISH) [125, 126]. This is especially effective when the two species involved are karyotypically very different (due to the course of evolution), but with a certain degree of phylogenetic proximity (due to constraints of the methodology, namely in the time required to produce a stable probe/target hybrid). Comparative genomics play a key role in this issue as it allows choosing the ideal genome to generate the probes. Of course this may not be feasible when working in a strict clinical ground, but the fundamental research has assisted in this issue and today there are already laboratories applying this technology not only in human but also in rodents and other species’ cancer cytogenetics and providing this technology to the public in general.
The first and the best known case is the use of gibbon (e.g., Hylobates concolor) WCPs to delineate up to 90 different chromosome segments in the human karyotype [125, 126]. But also in rodents this has been done, as it is the case of Buwe et al. [87] for rat chromosomes and later human, mouse, or rat probes that have been used to cytogenetically characterize complex rodent tumor genomes (e.g., [23]). Recently, our group, using this methodology, was able to precise the exact rat chromosome segment involved in a clonal rearrangement of the commercial rat tumor cell line HH-16 cl.2/1 with a mouse WCP probe [23]. The choice of the probe to be used was based on the syntenies between rat and mouse assessed by the ensembl database (http://www.ensembl.org/; assembly RGSC 3.4).
Analysis of Centromeres and Telomeres in Tumors
The centromere and the telomere are essential components for the stability and integrity of genomes and for the faithful transmission of the genetic information from one cell generation to the other (for a review, see [127, 128]). Aneuploidy and CIN are hallmarks of the majority of tumors [3] studied so far and can be driven by centromere and/or telomere dysfunction resulting from eroded or unprotected telomere structures [64]. FISH experiments with centromere and telomere probes are not only used in human tumors’ diagnosis and research, but also in rodent tumors [28, 64].
Telomeric sequences were highly conserved across evolution. By contrast, centromeric satellite DNA families are extremely diverse, as these repetitive sequences may evolve rapidly. This fact was used to generate chromosome-specific centromeric probes for several species, including human and rat [129, 130]. So far, in mouse this wasn’t possible to achieve due to the great centromeric homogeneity that the chromosomes of this species seem to exhibit.
Stay updated, free articles. Join our Telegram channel

Full access? Get Clinical Tree


