Fig. 5.1
Representative confocal microscopy images showing an endothelial cell with a fused mitochondria and b fragmented mitochondria
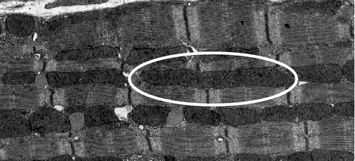
Fig. 5.2
Representative electron micrograph depicting an elongated mitochondrion (in oval) in the adult heart tissue
The movement of the mitochondria and subsequent changes in shapes (morphology) of the mitochondria constitute the term of ‘mitochondrial dynamics’ and have since led to an impetus of research in this particular area. The number and shapes of mitochondria vary according to cell type and energy requirement. The balance between fused and fragmented forms of the mitochondria is governed by specific mitochondrial-shaping proteins, mitofusin 1 (Mfn1) (Santel et al. 2003), mitofusin 2 (Mfn2) (Bach et al. 2003), and optic atrophy 1 (OPA1) (Cipolat et al. 2004) for mitochondrial fusion and dynamin-related protein 1 (Drp1) (Smirnova et al. 1998) and human fission 1 (hFis1) (James et al. 2003) for mitochondrial fission. Mitochondrial fusion serves to facilitate the exchange of contents, DNA, and metabolites between neighboring mitochondria and to compensate for mutations in mtDNA (Chen et al. 2010; Nakada et al. 2001) and prevents healthy mitochondria from being removed via autophagy, a process of recycling dysfunctional mitochondria (Gomes et al. 2011). Mitochondrial fusion by inhibition of Drp1 or upregulation of Mfn1 and Mfn2 has been shown to protect the heart from ischamia–reperfusion injury via inhibition of the mitochondrial permeability transition pore (mPTP), a channel in the IMM that opens upon calcium overloading and accumulation of oxidative stress (Ong et al. 2010). Conversely, fission is crucial for enhancing optimum mitochondrial transport, to subcellular regions of specific energy demand. Fragmentation of the mitochondria by upregulation of Drp1 predisposes the cardiac cells to autophagy and cell death upon stress insults such as oxidative stress buildup and calcium overloading (Chen et al. 2005; Gomes et al. 2011; Jheng et al. 2012; Lee et al. 2011).
A variety of methods have been employed to monitor the changes in mitochondrial morphology. Traditional studies of mitochondrial morphology employ electron microscopy. However, this only provides a snapshot in time and space. Mitochondrial dynamics, which encompass the movement, change in shapes, and positioning, can be monitored using photoactivatable fluorescent proteins (mtPA-GFP). The photoactivated GFP diffuses rapidly within the entire mitochondrial matrix and can therefore be used to tag individual mitochondria (Lovy et al. 2012; Twig et al. 2006, 2008). In addition, monitoring mitochondrial fusion using the Renilla luciferase complementation assay has also been described (Huang et al. 2010; Schauss et al. 2010).
Contact between two mitochondria does not necessarily lead to fusion. Fission, conversely, can occur without movement and connection of two juxtaposed mitochondria. Fluorophores are targeted to the mitochondria via the differences in mitochondrial membrane potential to visualize the intermixing and segregation of the inner mitochondrial components. The study of mitochondrial dynamics using this tool enables a better understanding of physiological and pathophysiological processes affecting mitochondrial activity, positioning, and the number of mitochondria (Molina and Shirihai 2009). Certain dyes such as MitoTracker® Green FM, Orange CMTMRos, Red CMXRos, and Deep Red FM probes are not affected by the energetic state of the mitochondria, compared with conventional dyes such as rhodamine 123 and tetramethylrhodamine methyl ester (TMRM). Novel, non-cytotoxic dyes, e.g., AcQCy7, have also been formulated to specifically target mitochondria (Han et al. 2013). Different model organisms, most of which express fluorescent mitochondria in vivo, have also been developed or modified to study mitochondrial dynamics in disease systems (Chandrasekaran et al. 2006; Misgeld et al. 2007; Plucińska et al. 2012). The presence of giant mitochondria can also be detected by electron microscopy (Haas et al. 2008).
The change in mitochondrial morphology has been demonstrated to affect various physiological processes. Mutations in OPA1 lead to type 1 dominant optic atrophy, a common cause of inherited visual failure starting in early childhood characterized by irreversible loss of retinal ganglion cells (RGCs) (Alavi and Fuhrmann 2013; Amati-Bonneau et al. 2009; Eiberg et al. 1994; Galvez-Ruiz et al. 2013; Kjer 1959; Lenaers et al. 2012; Lunkes et al. 1995) as well as impairment of neuronal maturation (Bertholet et al. 2013). Disruption or loss of OPA1 has been demonstrated to be associated with complex I deficiency (Ramonet et al. 2013) and Parkinson’s disease (Anglade et al. 1997; Fernandes and Rao 2011; Sekiya et al. 1982; Trimmer et al. 2000) as well as affecting vertebrate development (Rahn et al. 2013). Mfn2 mutations lead to primary axonal Charcot–Marie–Tooth disease type 2A, an autosomal dominant neuropathy that impairs motor and sensory neurons with the longest axons, resulting in earliest symptoms in distal extremities (Züchner et al. 2004). Similar to OPA1, a missense mutation in Mfn2 can lead to instability of mtDNA and optic atrophy ‘plus’ phenotypes such as syndromic forms of autosomal dominant optic atrophy associated with sensorineural deafness, axonal sensory motor polyneuropathy, ataxia, chronic progressive external ophthalmoplegia, and mitochondrial myopathy with cytochrome c oxidase (COX)-negative and ragged-red fibers (Amati-Bonneau et al. 2008; Hudson et al. 2008; Rouzier et al. 2012). Brain MRI from the patient revealed multiple periventricular white matter lesions and severe diffuse cerebral atrophy (Rouzier et al. 2012). Fragmentation of the mitochondrial network was also observed in the fibroblasts of the patient (Rouzier et al. 2012). Concurrent with reduced levels of Mfn1, Mfn2, and OPA1 and high levels of Fis1 and Drp1, increased mitochondrial fragmentation has also been observed in cells and tissues from patients with Alzheimer’s disease (Manczak et al. 2011; Wang et al. 2009). Mfn2 ablation promotes axon degeneration and disrupts axonal mitochondrial positioning in parkinsonism (Lee et al. 2012; Misko et al. 2012).
5.3.2 Determining Mitochondrial Membrane Potential
Adenosine triphosphate (ATP), the source of cellular energy from the mitochondria, is mainly produced via OXPHOS (Kaim and Dimroth 1999). The OXPHOS system is made up of five multiprotein complexes embedded within the IMM: complex I (reduced nicotinamide adenine dinucleotide: ubiquinone oxidoreductase), complex II (succinate: ubiquinone oxidoreductase), complex III (ubiquinol: cytochrome c oxidoreductase), complex IV (cytochrome c oxidase), and complex V (ATP synthase). Protons, donated by reduced nicotinamide adenine dinucleotide, ubiquinone, and cytochrome c, are channeled by complexes I, III, and IV, respectively, into the mitochondrial IMS. The channeling of protons through the complexes creates a proton gradient between the mitochondrial matrix and the IMS. The proton gradient is crucial for generating and maintaining the electrochemical membrane potential (ΔΨ), which is the driving force for the conversion of ADP and inorganic phosphate into ATP (Kaim and Dimroth 1999).
Mitochondrial membrane potential (ΔΨm) can be estimated using fluorescent voltage-sensitive dyes that are membrane-permeant lipophilic cationic compounds that distribute across the IMM (Lemasters and Ramshesh 2007) based on the Nernst equation. Changes in ΔΨm have been usually expressed in percentage over the basal level (Dedkova and Blatter 2012). Rhodamine 123, tetramethylrhodamine methyl, and ethyl ester (TMRM and TMRE) are specifically used to monitor changes in ΔΨm, which are useful for monitoring pathophysiological states or pharmacological treatment that induces changes in mitochondrial energetic states. Although it is least toxic to cells, TMRM should be used at a low concentration. An alternative fluorescent probe is the carbocyanine compound, JC-1, which exists as a green fluorescent monomer at low membrane potential but switches to form red fluorescent aggregates at higher potentials (Di Lisa et al. 1995). This change in fluorescence is solely based on membrane potential and independent of size and density of the mitochondria. Various factors such as loading times and dye concentration affect the formation of aggregates (Diaz et al. 2001; Duchen et al. 2003). Defects in complexes of the RC, which concurs with defects in OXPHOS, were detected using JC-1, as the buildup of mitochondrial membrane potential is disrupted by impairment of OXPHOS (De Paepe et al. 2012). Simultaneous detection of both ΔΨm and morphology can also be achieved via a combination of potential-insensitive mitochondrial GFP and a potential-sensitive probe such as TMRM (Distelmaier et al. 2008). This will also help in correcting for movement artefacts by applying a ratiometric approach (Twig et al. 2006). Nevertheless, it is important to ascertain that certain considerations should be taken into account when using these dyes, e.g., the optimum dye concentration to be used, the presence of the dye in superfusion solution throughout the experiment, timing for addition of dye, and other factors affecting the localization of the dye such as movement and changes in volume of the mitochondria (Dedkova and Blatter 2012; Duchen et al. 2003; O’Reilly et al. 2003). The potential occurrence of FRET phenomena (Förster resonance energy transfer or fluorescence resonance energy transfer) between two different dyes that can lead to erroneous interpretations of the results should also be evaluated (Aon et al. 2007; Dedkova and Blatter 2012; Honda et al. 2005; Hüser et al. 1998; Slodzinski et al. 2008). The plasma membrane potential, together with the ΔΨm, dictates the accumulation of the dye (Davidson et al. 2007). Upon opening of the mPTP, dyes may leak out of the mitochondria via simple diffusion (O’Reilly et al. 2003; Twig et al. 2006). Quantitative calibration of experimental data with potentiometric probes is usually expressed as a percentage change from basal levels (Dedkova and Blatter 2012). The standard deviation (SD) of the measured fluorescence signal is important as the SD may vary from high (in polarized mitochondria) to low (in depolarized mitochondria) (Duchen et al. 2003). Calibration of ΔΨm can be achieved by obtaining the ratio of mean fluorescence to SD (mean/SD), which gives a quantitative measure of dye localization (Dedkova and Blatter 2012; Duchen et al. 2003).
5.3.3 Detecting Mitochondrial Calcium Flux
Calcium (Ca2+) is an important signaling molecule regulating the process of ATP synthesis and hydrolysis. In response to physiological stimuli, the concentration of mitochondrial Ca2+ is increased in line with the activity of mitochondrial RC to cope with enhanced energy demand and ATP synthesis (Jouaville et al. 1999; Rizzuto and Pozzan 2006). Mitochondria are crucial in maintaining intracellular calcium homeostasis. The mitochondria act as a Ca2+ sink to prevent propagation of large calcium waves by taking up Ca2+ released from the endoplasmic reticulum (ER) into the cytosol (Baughman et al. 2011; Boitier et al. 1999; Jouaville et al. 1995; Mallilankaraman et al. 2012; Plovanich et al. 2013; Tinel et al. 1999; Williams et al. 2013). The Ca2+ will then be released back into the cytosol by release mechanisms (Ca2+/Na exchanger, Ca2+/H+ exchanger, and transient opening of the mPTP) (Ichas et al. 1997; Pinton and Rizzuto 2006; Putney and Thomas 2006; Rizzuto et al. 1993; Tian et al. 2005). Perturbations in the normal functions of cells may result in pathophysiological Ca2+ overloading in mitochondria, followed by the initiation of a cascade of events that lead to cell death (Hajnóczky et al. 2006). Permeabilization of the mitochondrial membrane by prolonged opening of the mPTP leads to the release of apoptogenic proteins from the IMS and subsequent cell death (Hausenloy et al. 2009; Martinou et al. 2000). Mitochondrial calcium can be measured using fluorescent Ca2+ indicators such as indo-1 (Miyata et al. 1991; Schreur et al. 1996), fura-2 (Abdallah et al. 2011), fluo-3 (Sedova et al. 2006), and rhod-2 (Jou et al. 1996) as well as luminescent and fluorescent targeted proteins such as aequorin, pericam, and camaleons (Bonora et al. 2013; De la Fuente et al. 2012; Fonteriz et al. 2010). The membrane-permeant fluorescent Ca2+ indicators [typically acetoxymethyl (AM) esters] are entrapped in the mitochondrial matrix via a de-esterification process by intracellular (cytosolic and intramitochondrial) esterases (Dedkova and Blatter 2012). Combining the use of rhod-2 with mitochondrial-targeted GFP, the mitochondrial positioning, morphology, and relation to sequestration of calcium can be concurrently studied. Potential downsides to using these dyes include the non-ratiometric nature of all rhodamine-derived indicators which may cause errors from changes in dye concentration and motion artifacts (Dedkova and Blatter 2012). Following repetitive simulation with certain agonists, Rhod-2 has been reported to induce Ca2+-dependent inhibition of mitochondrial Ca2+ uptake (Fonteriz et al. 2010). Besides that, the optimum dye concentration has to be determined as this affects mitochondrial membrane potential, morphology, and toxin production (Fonteriz et al. 2010). Classical ratiometric indicators such as fura-2 and indo-1, conversely, have low dissociation constant (Kd) and may accumulate in the cytosol (Dedkova and Blatter 2012). Recent innovations in mitochondrial calcium measurement include the development of Mt-pericam, a mitochondrial-matrix-targeted, circularly permuted green fluorescent protein fused to calmodulin and its target peptide M13 (Nagai et al. 2001), Mitycam which is targeted to mitochondria with a standard mitochondrial-targeting sequence (subunit VIII of human cytochrome c oxidase) (Kettlewell et al. 2009; Nagai et al. 2001), a low-Ca2+ affinity aequorin probe which is able to measure [Ca2+] in the millimolar range for long period of time without problems derived from aequorin consumption (De la Fuente et al. 2012), and, most recently, GCaMP2-mt, consisting of a mitochondrial-targeting sequence attached to a high signal-to-noise Ca2+ sensor protein GCaMP2 to measure oxidant-induced responses of [Ca2+]m in cultured neonatal myocytes (Iguchi et al. 2012).
5.3.4 Monitoring Mitochondrial Autophagy
Autophagy refers to the evolutionarily conserved process of segregation and recycling of damaged or unused cellular components (Klionsky 2007; Mizushima 2007). Autophagy is defined by the formation of autophagosomes—double-membrane structures that sequester defective organelles and cytotoxic protein aggregates, or even viruses or bacteria (Fig. 5.3) (Hayashi-Nishino et al. 2009; Klionsky 2007; Mizushima et al. 2011; Mizushima 2007). The autophagosomes subsequently fuse with lysosomes leading to bulk degradation of their content, and the produced nutrients will then be recycled back to the cytoplasm (Hayashi-Nishino et al. 2009; Klionsky 2007, 2008; Mizushima et al. 2011; Mizushima 2007; Ylä-Anttila et al. 2009a). Specific removal of mitochondria is termed mitophagy (Kissová et al. 2004; Rodriguez-Enriquez et al. 2004). Through mitophagy, dysfunctional mitochondria are recycled to produce useful amino acids and other nutrients.
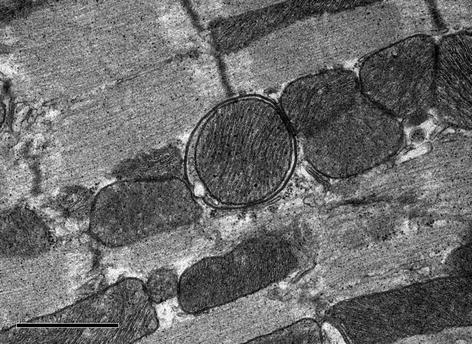
Fig. 5.3
Representative electron micrograph depicting an autophagosome with an engulfed mitochondrion in the heart
Pathologic dysregulation of autophagy results in various disorders such as synaptic dysfunction, stroke, brain trauma, Parkinson’s, Alzheimer’s, Huntington’s, and other neurodegenerative diseases (Chu et al. 2007; Lai et al. 2008; Liu et al. 2008; Nixon et al. 2005; Ong and Gustafsson 2012; Rudnicki et al. 2008).
Mitophagy is generally visualized via the protein LC3B, a general marker for autophagic membranes (Dagda et al. 2008; Du et al. 2009; Klionsky et al. 2012) or using electron microscopy (Klionsky et al. 2012). Autophagosomes are visualized on TEM as two parallel membrane bilayers separated by an electron-lucent cleft (Eskelinen and Kovács 2011), containing organelles that look morphologically intact, i.e., similar to the cytosol and organelles elsewhere in the cell (Ylä-Anttila et al. 2009b). Autolysosomes usually have only one limiting membrane, while the engulfed cytoplasmic material and/or organelles are at various stages of degradation (Ylä-Anttila et al. 2009b). The recommended quantification of TEM results is to obtain the volume occupied by autophagic structures and express it as a percentage of cytoplasmic or cellular volume in a predetermined number of cells (by power analysis) per sample (Klionsky et al. 2012; Sigmond et al. 2008). Autophagosomes in the brain have been evaluated using confocal immunohistochemistry and antibodies against LC3 (Lai et al. 2008). Caution should be exercised when interpreting the increase in autophagosomes as this can reflect induction of autophagy, impairment of autophagosome turnover (Kovács et al. 1986, 1987, 1988), or the inability of turnover to keep pace with increased autophagosome formation (Chu 2006).
Similar to the cases described before, LC3B-GFP or LC3B-RFP can be used in conjunction with mitochondrial-targeted fluorescent proteins to concurrently study mitochondrial dynamics and mitophagy. High-quality images at a high magnification from epifluorescence or confocal laser microscope are used to quantify LC3B puncta colocalized with mitochondria, average number of LC3 puncta per cell or percentage of cells displaying punctate LC3 that exceeds a particular pre-defined threshold (Klionsky et al. 2012). Anti-LC3 antibodies for immunocytochemistry or immunohistochemistry can be used to detect the endogenous protein without the need for transfection as the overexpression of GFP-LC3 may cause the nuclear localization of the marker (Elsässer et al. 2004; Klionsky et al. 2012; Ost et al. 2010). The number of puncta corresponding to GFP-LC3 on a per cell basis rather than simply the total number of cells displaying puncta can be quantified to monitor autophagy (Klionsky et al. 2012). Sizes of autophagosomes may vary, but additional assays will be required to correlate autophagosome size with autophagic activity (Klionsky et al. 2012; Wu and Pollard 2005). When using fluorescence microscopy to monitor autophagy, a ratio for establishing differences in the degree of autophagy between cells should be obtained by calculating the SD of pixel intensities within the fluorescence image and dividing this by the mean intensity of the pixels within the area of analysis (Klionsky et al. 2012). This is crucial as the expression of GFP-LC3 may not be the same in all cells. Multispectral imaging cytometry has been proposed to assist in quantifying GFP-LC3 puncta in a large number of cells (Dolloff et al. 2011). An additional advantage of this method is the ability of quantification of endogenous LC3 in non-transfected primary cells (Phadwal et al. 2012). A caveat to using GFP-LC3 is the potential association of this chimera with protein aggregates (Kuma et al. 2007). Furthermore, using antibodies will obviate the need for generation of a transgenic organism. The late stage of mitophagy where mitochondria undergo lysosomal degradation is monitored by labeling lysosomes with lysotracker and mitochondria with MitoTracker or mitochondrial-targeted fluorescent proteins (Rodriguez-Enriquez et al. 2006). Autophagic flux can also be measured by a tandem monomeric RFP-GFP-tagged LC3 (Kimura et al. 2007) with a more sensitive and accurate reporter described in 2012 (Zhou et al. 2012). The signal elicited from mRFP is not affected by environmental conditions. The GFP signal, however, is sensitive to the acidic and/or proteolytic conditions of the lysosome lumen. Colocalization of both GFP and mRFP fluorescence indicates a phagophore or an autophagosome that has not fuse with a lysosome. In contrast, an mRFP signal without GFP may correspond to an amphisome or autolysosome. The Rosella biosensor, a dual fluorescence assay, complements the tandem mRFP/mCherry-GFP reporter by monitoring the uptake of specific cellular components to the lysosome/vacuole and the internal environment of the biosensor during autophagy (Rosado et al. 2008). The biosensor Rosella consists of a relatively pH-stable fast-maturing RFP variant and a pH-sensitive GFP variant (Rosado et al. 2008). Novel tools for studying mitochondrial turnover and biogenesis include MitoTimer, a fluorescent reporter protein that changes fluorescence from green to red concurrent with protein maturation in whole cells and isolated mitochondria (Hernandez et al. 2013), the use of Keima, a coral-derived acid-stable fluorescent protein that emits different-colored signals at acidic and neutral pHs to quantify autophagy at a single time point (Katayama et al. 2011). The correlation between component proteins and organelles involved in the timing of the autophagic process has also been studied (Karanasios et al. 2013; Katayama et al. 2011).
5.4 Conclusion
The onset of mitochondrial diseases can occur at any age with multifaceted symptoms in various organs, such as the CNS, visual system, and neuromuscular system. Diagnosis of mitochondrial diseases is not easily achievable, due to the underlying factors such as double genetic origin of RC proteins, heterogenous clinical presentations of patients, and variables between genotype and phenotype. Coupled with other investigation tools such as genetic or biochemical analysis, imaging methods are crucial to visualize and differentiate CNS abnormalities in mitochondrial disorders. Findings from the different imaging methods, however, have to be corroborated to ensure that a proper and accurate diagnosis is achieved. Advances in biomedical imaging enhance a better understanding of mitochondrial integrity and function which will help develop future therapeutics against mitochondrial diseases.
References
Abdallah Y, Kasseckert SA, Iraqi W, Said M, Shahzad T, Erdogan A, Neuhof C et al (2011) Interplay between Ca2+ cycling and mitochondrial permeability transition pores promotes reperfusion-induced injury of cardiac myocytes. J Cell Mol Med 15(11):2478–2485. doi:10.1111/j.1582-4934.2010.01249.x
Abe K (2004) Cerebral lactic acidosis correlates with neurological impairment in MELAS. Neurology 63(12):2458; author reply 2458. Retrieved from http://www.ncbi.nlm.nih.gov/pubmed/15623741
Alavi MV, Fuhrmann N (2013) Dominant optic atrophy, OPA1, and mitochondrial quality control: understanding mitochondrial network dynamics. Mol Neurodegeneration 8(1):32. doi:10.1186/1750-1326-8-32
Alpers BJ (1931) Diffuse progressive degeneration of the gray matter of the cerebrum. Arch Neurol Psychiatry 25(3):469. doi:10.1001/archneurpsyc.1931.02230030027002
Amati-Bonneau P, Valentino ML, Reynier P, Gallardo ME, Bornstein B, Boissière A, Campos Y et al (2008) OPA1 mutations induce mitochondrial DNA instability and optic atrophy “plus” phenotypes. Brain: J Neurol 131(Pt 2):338–351. doi:10.1093/brain/awm298
Amati-Bonneau P, Milea D, Bonneau D, Chevrollier A, Ferré M, Guillet V, Gueguen N et al (2009) OPA1-associated disorders: phenotypes and pathophysiology. Int J Biochem Cell Biol 41(10):1855–1865. doi:10.1016/j.biocel.2009.04.012
Anderson S, Bankier AT, Barrell BG, De Bruijn MH, Coulson AR, Drouin J, Eperon IC (1981) Sequence and organization of the human mitochondrial genome. Nature 290(5806):457–465. Retrieved from http://www.ncbi.nlm.nih.gov/pubmed/7219534
Anglade P, Vyas S, Javoy-Agid F, Herrero MT, Michel PP, Marquez J, Mouatt-Prigent A et al (1997) Apoptosis and autophagy in nigral neurons of patients with Parkinson’s disease. Histol Histopathol 12(1):25–31. Retrieved from http://www.ncbi.nlm.nih.gov/pubmed/9046040
Aon MA, Cortassa S, Maack C, O’Rourke B (2007) Sequential opening of mitochondrial ion channels as a function of glutathione redox thiol status. J Biol Chem 282(30):21889–21900. doi:10.1074/jbc.M702841200
Apostolova LG, White M, Moore SA, Davis PH (2005) Deep white matter pathologic features in watershed regions: a novel pattern of central nervous system involvement in MELAS. Arch Neurol 62(7):1154–1156. doi:10.1001/archneur.62.7.1154
Ashley N, O’Rourke A, Smith C, Adams S, Gowda V, Zeviani M, Brown GK et al (2008) Depletion of mitochondrial DNA in fibroblast cultures from patients with POLG1 mutations is a consequence of catalytic mutations. Hum Mol Genet 17(16):2496–2506. doi:10.1093/hmg/ddn150
Bach D, Pich S, Soriano FX, Vega N, Baumgartner B, Oriola J, Daugaard JR et al (2003) Mitofusin-2 determines mitochondrial network architecture and mitochondrial metabolism. A novel regulatory mechanism altered in obesity. J Biol Chem 278(19):17190–17197. doi:10.1074/jbc.M212754200
Baertling F, Schaper J, Mayatepek E, Distelmaier F (2013) Teaching NeuroImages: rapidly progressive leukoencephalopathy in mitochondrial complex I deficiency. Neurology 81(2):e10–e11. doi:10.1212/WNL.0b013e31829a339b
Bardosi A, Creutzfeldt W, DiMauro S, Felgenhauer K, Friede RL, Goebel H, Kohlschütter A et al (1987) Myo-, neuro-, gastrointestinal encephalopathy (MNGIE syndrome) due to partial deficiency of cytochrome-c-oxidase. A new mitochondrial multisystem disorder. Acta Neuropathol 74(3):248–258. Retrieved from http://www.ncbi.nlm.nih.gov/pubmed/2823522
Barker PB, Hearshen DO, Boska MD (2001) Single-voxel proton MRS of the human brain at 1.5T and 3.0T. Magn Reson Med: Official J Soc Magn Reson Med/Soc Magn Reson Med 45(5):765–769. Retrieved from http://www.ncbi.nlm.nih.gov/pubmed/11323802
Barkovich AJ, Good WV, Koch TK, Berg BO (1993) Mitochondrial disorders: analysis of their clinical and imaging characteristics. AJNR Am J Neuroradiol 14(5):1119–1137. Retrieved from http://www.ncbi.nlm.nih.gov/pubmed/8237691
Barragán-Campos HM, Vallée J-N, Lô D, Barrera-Ramírez CF, Argote-Greene M, Sánchez-Guerrero J, Estañol B et al (2005) Brain magnetic resonance imaging findings in patients with mitochondrial cytopathies. Arch Neurol 62(5):737–742. doi:10.1001/archneur.62.5.737
Baughman JM, Perocchi F, Girgis HS, Plovanich M, Belcher-Timme CA, Sancak Y, Bao XR et al (2011) Integrative genomics identifies MCU as an essential component of the mitochondrial calcium uniporter. Nature 476(7360):341–345. doi:10.1038/nature10234
Bernier FP, Boneh A, Dennett X, Chow CW, Cleary MA, Thorburn DR (2002) Diagnostic criteria for respiratory chain disorders in adults and children. Neurology 59(9):1406–1411. Retrieved from http://www.ncbi.nlm.nih.gov/pubmed/12427892
Bertholet AM, Millet AME, Guillermin O, Daloyau M, Davezac N, Miquel M-C, Belenguer P (2013) OPA1 loss of function affects in vitro neuronal maturation. Brain: J Neurol 136(Pt 5):1518–1533. doi:10.1093/brain/awt060
Bianchi MC, Tosetti M, Battini R, Manca ML, Mancuso M, Cioni G, Canapicchi R et al (2003) Proton MR spectroscopy of mitochondrial diseases: analysis of brain metabolic abnormalities and their possible diagnostic relevance. AJNR Am J Neuroradiol 24(10):1958–1966. Retrieved from http://www.ncbi.nlm.nih.gov/pubmed/14625217
Boddaert N, Romano S, Funalot B, Rio M, Sarzi E, Lebre AS, Bahi-Buisson N et al (2008) 1H MRS spectroscopy evidence of cerebellar high lactate in mitochondrial respiratory chain deficiency. Mol Genet Metab 93(1):85–88. doi:10.1016/j.ymgme.2007.09.003
Boitier E, Rea R, Duchen MR (1999) Mitochondria exert a negative feedback on the propagation of intracellular Ca2+ waves in rat cortical astrocytes. J Cell Biol 145(4):795–808. Retrieved from http://www.pubmedcentral.nih.gov/articlerender.fcgi?artid=2133193&tool=pmcentrez&rendertype=abstract
Bonora M, Giorgi C, Bononi A, Marchi S, Patergnani S, Rimessi A, Rizzuto R et al (2013) Subcellular calcium measurements in mammalian cells using jellyfish photoprotein aequorin-based probes. Nat Protoc 8(11):2105–2118. doi:10.1038/nprot.2013.127
Brockmann K, Bjornstad A, Dechent P, Korenke CG, Smeitink J, Trijbels JMF, Athanassopoulos S et al (2002) Succinate in dystrophic white matter: a proton magnetic resonance spectroscopy finding characteristic for complex II deficiency. Ann Neurol 52(1):38–46. doi:10.1002/ana.10232
Burgeois M, Goutieres F, Chretien D, Rustin P, Munnich A, Aicardi J (1992) Deficiency in complex II of the respiratory chain, presenting as a leukodystrophy in two sisters with Leigh syndrome. Brain Dev 14(6):404–408. Retrieved from http://www.ncbi.nlm.nih.gov/pubmed/1492653
Cady EB, Lorek A, Penrice J, Reynolds EO, Iles RA, Burns SP, Coutts GA et al (1994) Detection of propan-1,2-diol in neonatal brain by in vivo proton magnetic resonance spectroscopy. Mag Reson Med: Official J Soc Mag Reson Med/Soc Mag Reson Med 32(6):764–767. Retrieved from http://www.ncbi.nlm.nih.gov/pubmed/7869898
Castro-Gago M, González-Conde V, Fernández-Seara MJ, Rodrigo-Sáez E, Fernández-Cebrián S, Alonso-Martín A, Campos Y et al (1999) Early mitochondrial encephalomyopathy due to complex IV deficiency consistent with Alpers-Huttenlocher syndrome: report of two cases. Rev Neurol 29(10):912–917. Retrieved from http://www.ncbi.nlm.nih.gov/pubmed/10637838
Chan DC (2006a) Mitochondria: dynamic organelles in disease, aging, and development. Cell 125(7):1241–1252. doi:10.1016/j.cell.2006.06.010
Chan DC (2006b) Mitochondrial fusion and fission in mammals. Annu Rev Cell Dev Biol 22:79–99. doi:10.1146/annurev.cellbio.22.010305.104638
Chandrasekaran K, Hazelton JL, Wang Y, Fiskum G, Kristian T (2006) Neuron-specific conditional expression of a mitochondrially targeted fluorescent protein in mice. J Neurosci: Official J Soc Neurosci 26(51):13123–13127. doi:10.1523/JNEUROSCI.4191-06.2006
Cheldi A, Ronchi D, Bordoni A, Bordo B, Lanfranconi S, Bellotti MG, Corti S et al (2013) POLG1 mutations and stroke like episodes: a distinct clinical entity rather than an atypical MELAS syndrome. BMC Neurol 13:8. doi:10.1186/1471-2377-13-8
Chen H, Chan DC (2004) Mitochondrial dynamics in mammals. Curr Top Dev Biol 59:119–144. doi:10.1016/S0070-2153(04)59005-1
Chen H, Chomyn A, Chan DC (2005) Disruption of fusion results in mitochondrial heterogeneity and dysfunction. J Biol Chem 280(28):26185–26192. doi:10.1074/jbc.M503062200
Chen H, Vermulst M, Wang YE, Chomyn A, Prolla TA, McCaffery JM, Chan DC (2010) Mitochondrial fusion is required for mtDNA stability in skeletal muscle and tolerance of mtDNA mutations. Cell 141(2):280–289. doi:10.1016/j.cell.2010.02.026
Chen C, Xiong N, Wang Y, Xiong J, Huang J, Zhang Z, Wang T (2012a) A study of familial MELAS: evaluation of A3243G mutation, clinical phenotype, and magnetic resonance spectroscopy-monitored progression. Neurol India 60(1):86–89. doi:10.4103/0028-3886.93609
Chen Z, Li J, Lou X, Ma L (2012b) Sequential evaluation of brain lesions using functional magnetic resonance imaging in patients with Leigh syndrome. Nan fang yi ke da xue xue bao = J South Med Univ 32(10):1474–1477. Retrieved from http://www.ncbi.nlm.nih.gov/pubmed/23076188
Chi C-S, Lee H-F, Tsai C-R, Chen CC-C, Tung J-N (2011a) Cranial magnetic resonance imaging findings in children with nonsyndromic mitochondrial diseases. Pediatr Neurol 44(3):171–176. doi:10.1016/j.pediatrneurol.2010.09.009
Chi C-S, Lee H-F, Tsai C-R, Chen W-S, Tung J-N, Hung H-C (2011b) Lactate peak on brain MRS in children with syndromic mitochondrial diseases. JCMA J Chin Med Assoc 74(7):305–309. doi:10.1016/j.jcma.2011.05.006
Chu CT (2006) Autophagic stress in neuronal injury and disease. J Neuropathol Exp Neurol 65(5):423–432. doi:10.1097/01.jnen.0000229233.75253.be
Chu BC, Terae S, Takahashi C, Kikuchi Y, Miyasaka K, Abe S, Minowa K et al (1999) MRI of the brain in the Kearns-Sayre syndrome: report of four cases and a review. Neuroradiology 41(10):759–764. Retrieved from http://www.ncbi.nlm.nih.gov/pubmed/10552027
Chu CT, Zhu J, Dagda R (2007) Beclin 1-independent pathway of damage-induced mitophagy and autophagic stress: implications for neurodegeneration and cell death. Autophagy 3(6):663–666. Retrieved from http://www.pubmedcentral.nih.gov/articlerender.fcgi?artid=2779565&tool=pmcentrez&rendertype=abstract
Cipolat S, Martins de Brito O, Dal Zilio B, Scorrano L (2004) OPA1 requires mitofusin 1 to promote mitochondrial fusion. Proc Natl Acad Sci USA 101(45):15927–15932. doi:10.1073/pnas.0407043101
Conway LJ, Robertson TE, McGill JJ, Hanson JP (2011) MELAS syndrome in an Indigenous Australian woman. Med J Aust 195(10):581–582. Retrieved from http://www.ncbi.nlm.nih.gov/pubmed/22107001
Dagda RK, Zhu J, Kulich SM, Chu CT (2008) Mitochondrially localized ERK2 regulates mitophagy and autophagic cell stress: implications for Parkinson’s disease. Autophagy 4(6):770–782. Retrieved from http://www.pubmedcentral.nih.gov/articlerender.fcgi?artid=2574804&tool=pmcentrez&rendertype=abstract
Stay updated, free articles. Join our Telegram channel

Full access? Get Clinical Tree


