Fortunately, the factorial terms are always the same in the numerator and denominator of the likelihood ratio, and therefore they cancel each other out and can be ignored. If θ = 0.5, the numerator and denominator are the same and the odds equal 1.
Statistical theory tells us that when the value of the likelihood ratio for all values of θ between 0 and 0.5 are calculated, the value of θ that gives the greatest value of this likelihood ratio is, in fact, the best estimate of the recombination fraction you can make given the data and is referred to as θmax. By convention, the computed likelihood ratio for different values of θ is usually expressed as the log10 and is called the LOD score (Z) where LOD stands for “Logarithm of the ODds.” The use of logarithms allows likelihood ratios calculated from different families to be combined by simple addition instead of having to multiply them together.
How is LOD score analysis actually carried out in families with mendelian disorders? (See Box this page) Return to the family shown in Figure 10-6, in which the mother has an autosomal dominant form of retinitis pigmentosa. There are dozens of different forms of this disease, many of which have been mapped to specific sites within the genome and the genes for which have now been identified. Typically, when a new family comes to clinical attention, one does not know which form of RP a patient has. In this family, the mother is also heterozygous for two marker loci on chromosome 7, locus 1 in distal 7q and locus 2 in 7p14. Suppose we know (from other family data) that the disease allele D is in coupling with allele A at locus 1 and allele B at locus 2. Given this phase, one can see that there has been recombination between RP and locus 2 in only one of her eight children, her daughter II-3. The alleles at the disease locus, however, show no tendency to follow the alleles at locus 1 or alleles at any of the other hundreds of marker loci tested on the other autosomes. Thus, although the RP locus involved in this family could in principle have mapped anywhere in the human genome, one now begins to suspect on the basis of the linkage data that the responsible RP locus lies in the region of chromosome 7 near marker locus 2.
To provide a quantitative assessment of this suspicion, suppose we let θ be the “true” recombination fraction between RP and locus 2, the fraction we would see if we had unlimited numbers of offspring to test. The likelihood ratio for this family is therefore
(θ)1(1−θ)7(12)1(12)7

and reaches a maximum LOD score of Zmax = 1.1 at θmax = 0.125.
The value of θ that maximizes the likelihood ratio, θmax, may be the best estimate one can make for θ given the data, but how good an estimate is it? The magnitude of the LOD score provides an assessment of how good an estimate of θmax you have made. By convention, a LOD score of +3 or greater (equivalent to greater than 1000 : 1 odds in favor of linkage) is considered firm evidence that two loci are linked—that is, that θmax is statistically significantly different from 0.5. In our RP example,  of the offspring are nonrecombinant and
  are recombinant. The θmax = 0.125, but the LOD score is only 1.1, enough to raise a suspicion of linkage but insufficient to prove linkage because Zmax falls far short of 3.
Linkage Analysis of Mendelian Diseases
Linkage analysis is used when there is a particular mode of inheritance (autosomal dominant, autosomal recessive, or X-linked) that explains the inheritance pattern.
LOD score analysis allows mapping of genes in which mutations cause diseases that follow mendelian inheritance.
The LOD score gives both:
• A best estimate of the recombination frequency, θmax, between a marker locus and the disease locus; and
• An assessment of how strong the evidence is for linkage at that value of θmax. Values of the LOD score Z above 3 are considered strong evidence.
Linkage at a particular θmax of a disease gene locus to a marker with known physical location implies that the disease gene locus must be near the marker. The smaller the θmax is, the closer the disease locus is to the linked marker locus.
Combining LOD Score Information across Families
In the same way that each meiosis in a family that produces a nonrecombinant or recombinant offspring is an independent event, so too are the meioses that occur in different families. We can therefore multiply the likelihoods in the numerators and denominators of each family’s likelihood odds ratio together. Suppose two additional families with RP were studied and one showed no recombination between locus 2 and RP in four children and the other showed no recombination in five children. The individual LOD scores can be generated for each family and added together (Table 10-1). Because the maximum LOD score Zmax exceeds 3 at θmax = ≈0.06, the RP gene in this group of families is linked to locus 2 at a recombination distance of ≈0.06. Because the genomic location of marker locus 2 is known to be at 7p14, the RP in this family can be mapped to the 7p14 region and likely involves the RP9 gene, one of the already identified loci for a form of autosomal dominant RP.
If, however, some of the families being used for the study were to have RP due to mutations at a different locus, the LOD scores between families would diverge, with some showing a trend to being positive at small values of θ and others showing strongly negative LOD scores at these values. Thus, in linkage analysis involving more than one family, unsuspected locus heterogeneity can obscure what may be real evidence for linkage in a subset of families.
Phase-Known and Phase-Unknown Pedigrees
In the RP example just discussed, we assumed that we knew the phase of marker alleles on chromosome 7 in the affected mother in that family. Let us now look at the implications of knowing phase in more detail.
Consider the three-generation family with autosomal dominant neurofibromatosis, type 1 (NF1) (Case 34) in Figure 10-10. The affected mother, II-2, is heterozygous at both the NF1 locus (D/d) and a marker locus (A/a), but (as shown in Fig. 10-10A) we have no genotype information on her parents. The two affected children received the A alleles along with the D disease allele, and the one unaffected child received the a allele along with the normal d allele. Without knowing the phase of these alleles in the mother, either all three offspring are recombinants or all three are nonrecombinants. Because both possibilities are equally likely in the absence of any other information, we consider the phase on her two chromosomes to be D-a and d-A half of the time and D–A and d–a the other half (which assumes the alleles in these haplotypes are in linkage equilibrium). To calculate the overall likelihood of this pedigree, we then add the likelihood calculated assuming one phase in the mother to the likelihood calculated assuming the other phase. Therefore, the overall likelihood =  and the likelihood ratio for this pedigree, then, is:
12(1−θ)3(θ0)+12(θ3)(1−θ)018
giving a maximum LOD score of Zmax= 0.602 at θmax = 0.
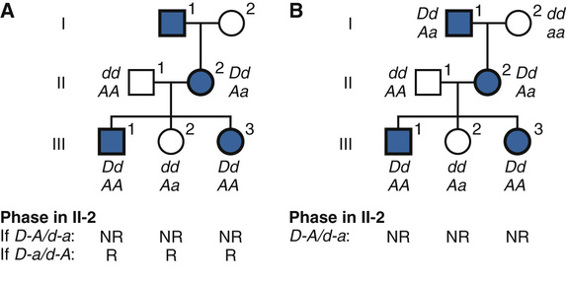
If, however, additional genotype information in the maternal grandfather I-1 becomes available (as in Fig. 10-10B), the phase can now be determined to be D–A (i.e., the NF1 allele D was in coupling with the A in individual II-2). In light of this new information, the three children can now be scored definitively as nonrecombinants, and we no longer have to consider the possibility of the opposite phase. The numerator of the likelihood ratio now becomes (1 − θ)3(θ0) and the maximum LOD score Zmax = 0.903 at θmax = 0. Thus knowing the phase increases the power of the data available to test for linkage.
Mapping Human Disease Genes by Association
Designing an Association Study
An entirely different approach to identification of the genetic contribution to disease relies on finding particular alleles that are associated with the disease in a sample from the population. In contrast to linkage analysis, this approach does not depend upon there being a mendelian inheritance pattern and is therefore better suited for discovering the genetic contributions to disorders with complex inheritance (see Chapter 8). The presence of a particular allele at a locus at increased or decreased frequency in affected individuals compared with controls is known as a disease association. There are two commonly used study designs for association studies:
• Case-control studies. Individuals with the disease are selected in a population, a matching group of controls without disease are then selected, and the genotypes of individuals in the two groups are determined and used to populate a two-by-two table (see below).
• Cross-sectional or cohort studies. A random sample of the entire population is chosen and then analyzed for whether they have (cross-sectional) or, after being followed over time, develop (cohort) a particular disease; the genotypes of everyone in the study population are determined. The numbers of individuals with and without disease and with and without an allele (or genotype or haplotype) of interest are used to fill out the cells of a two-by-two table.
Stay updated, free articles. Join our Telegram channel

Full access? Get Clinical Tree


