(1)
Fluorescence Division, HORIBA Instruments Inc., Edison, NJ, USA
Abstract
Contemporary spectrofluorimeters comprise exciting light sources, excitation and emission monochromators, and detectors that without correction yield data not conforming to an ideal spectral response. The correction of the spectral properties of the exciting and emission light paths first requires calibration of the wavelength and spectral accuracy. The exciting beam path can be corrected up to the sample position using a spectrally corrected reference detection system. The corrected reference response accounts for both the spectral intensity and drift of the exciting light source relative to emission and/or transmission detector responses. The emission detection path must also be corrected for the combined spectral bias of the sample compartment optics, emission monochromator, and detector. There are several crucial issues associated with both excitation and emission correction including the requirement to account for spectral band-pass and resolution, optical band-pass or neutral density filters, and the position and direction of polarizing elements in the light paths. In addition, secondary correction factors are described including (1) subtraction of the solvent’s fluorescence background, (2) removal of Rayleigh and Raman scattering lines, as well as (3) correcting for sample concentration-dependent inner-filter effects. The importance of the National Institute of Standards and Technology (NIST) traceable calibration and correction protocols is explained in light of valid intra- and interlaboratory studies and effective spectral qualitative and quantitative analyses including multivariate spectral modeling.
Key words
AbsorbanceBand-passGrating ordersInner-filter effectsPhotobleachingQuenchingRaman scatterRayleigh scatterSpectral resolutionWood’s anomalies1 Introduction
Fluorescence excitation and emission spectroscopy, compared to absorbance spectrophotometry, is a popular analytical instrument technique because it exhibits higher sensitivity and spectral selectivity. However, in contrast to absorbance spectrophotometry, where the spectral qualities of the light sources, dispersive elements, and detectors divide out commutatively in the final signal formulae, fluorescence data are subject to being highly convolved with and potentially distorted by the instrument’s spectral response function and sample conditions. Hence in order to facilitate valid intra- and interlaboratory comparisons of data collected on a fluorimeter, all components of the light path including the sample properties must be corrected in sequence to approach the “ideal” National Institute of Standards and Technology (NIST) traceable instrument response function [1–3] as is the subject of this chapter.
A conventional modular scanning spectrofluorimeter as shown in Fig. 1 comprises several components acting in concert to excite the sample with a chosen color of light followed by measuring the spectrum of light emitted by the sample. The initial essential element is the excitation light source, in this case a vertically mounted xenon arc lamp, which emits a broadband solar-like spectrum. The light source is optically coupled to an excitation monochromator, the design and internal components of which determine the spectral resolution, stray-light rejection, and peak wavelength efficiency of the light emitted into the sample compartment. The excitation monochromator contains the dispersive grating(s) and slits which regulate the color and band-pass of light. Ideally, the excitation monochromator is scanned from high energy (UV) to lower energy (red) to minimize photobleaching of the sample by the UV radiation. The sample compartment contains the focusing optics, polarizing elements (prisms or films), filter holders, and sometimes front-face viewing optical elements. Usually sample compartment focusing optics are either mirror based (as shown here) or lens based, the former being preferred to eliminate chromatic aberrations and facilitate focusing over a wider spectral range. Following the light path beyond the exit slit of the excitation monochromator into the sample compartment is the best location for an order-sorting filter holder or filter-changing apparatus (filter wheel). Following the primary beam path into the sample compartment, a beam splitter is encountered that reflects a small fraction (on the order of a few percent) onto a reference detector diode (or quantum counter cell plus reference detector) to monitor the intensity of the excitation light and correct for lamp spectral intensity or drift on the emission and absorbance detector signals. An absorbance detector can be provided as shown to monitor the transmission spectrum of light through the solvent blank and sample to calculate the samples absorbance and/or transmittance. The emission paths normally comprise at right angles to the excitation path emission monochromators (L-side and T-side) that are tuned via the “blaze” of the grating(s) and detector spectral response towards redder “Stokes-shifted” wavelengths compared to the excitation monochromator. Figure 1 also highlights the key components functionally associated with the major spectral correction factors including the effective relevant excitation correction factor elements and beam path (in green) and the emission monochromator-detector correction factors (L-side in red and T-side in black), the details of which are described below.
Figure 2 exemplifies another typical commercial unitized absorbance-fluorescence spectrophotometer, namely, the Aqualog® from Horiba Instruments Inc. [4]. The Aqualog® optical bench includes a special aberration-corrected double-grating excitation monochromator, a reference detector and absorbance detector (both Si photodiodes), and a unique emission detector comprised of a thermoelectrically cooled back-illuminated CCD and spectrograph. The system incrementally scans excitation from high energy to low energy and can collect the full emission spectrum at each excitation increment to rapidly and simultaneously generate absorbance spectra and fully corrected excitation-emission spectral maps or matrices (EEMs).
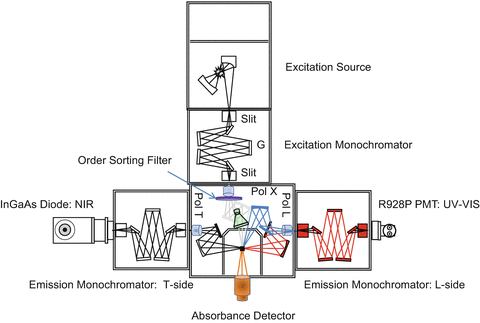
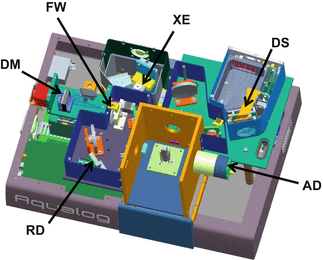

Fig. 1
Schematic of a typical modular Fluorolog® spectrofluorimeter manufactured by HORIBA Instruments Inc. illustrating the major components including the excitation source, the excitation monochromator, the sample compartment, and the L-side and T-side emission monochromators. The slit locations and dispersive grating (G) are labeled inside the excitation monochromator. Inside the sample compartment, the following components are labeled including the respective excitation, the L-side and T-side polarizers (Pol X, Pol L, and Pol T), the ideal location for order-sorting and optical filters in the excitation path, the beam-splitter and reference detector and beam path components sb influenced by the excitation correction factor (in green), the front-face 22.5° beam path and mirror components (in light blue), and the location and beam path for an absorbance detector (orange). The red right-angle sample compartment beam path and black L-side emission monochromator components illustrate those components influenced by their respective emission correction factors

Fig. 2
Optical bench layout of the Aqualog®, a commercial absorbance-fluorescence spectrophotometer manufactured by HORIBA Instruments Inc. The major components labeled in the legend include the vertically mounted 150 W xenon arc source (XE), the subtractive 10-cm double-grating excitation monochromator (DM), the order-sorting filter wheel (FW), the silicon diode reference detector (RD), the silicon diode absorbance detector (AD), and the thermoelectrically cooled CCD spectrograph (DS)
The chapter is organized as follows to relate to the typical optical benches described above: first there are descriptions of the protocols and data treatments associated with the NIST traceable spectral wavelength, band-pass, and absorbance accuracy calibration procedures. Following the protocols for calibration of the optical elements, the NIST traceable spectral shape correction factor protocols are explained for the excitation and emission beam paths. Then secondary correction protocols and algorithms for the spectral data are defined including (1) dealing with and/or removing overlapping scatter signals associated with the grating orders of the monochromators (spectrographs) and Raman bands from the solvent(s), (2) subtracting solvent background emission signals, and (3) correcting for sample concentration-dependent absorbance of the excitation and emission beams in the sample cuvette (inner-filter effects). The chapter concludes with an example analysis implementing the recommended best practices for fluorescence NIST traceable spectral data collection and treatment as they can facilitate validation of qualitative and quantitative analyses for intra- and interlaboratory comparisons.
2 Methods
2.1 Spectrofluori meter Excitation and Emission Optical Component Calibration Procedures
Accurate spectral correction requires accurate calibration of all aspects of the instrument including wavelength accuracy, slit-band-pass accuracy, and optical beam alignment including the instrument throughput and signal to noise. The optical alignment and slit calibration are normally performed only by qualified personnel trained by the manufacturer. Most fluorescence instruments are calibrated using software tools provided by the manufacturer to within their factory specified wavelength accuracy, nominally 0.5–1 nm. It is logical and conventional to first calibrate the excitation optical path from the source up to the reference detector. This can be done by referring to the distinctive emission lines of gas-filled xenon or mercury pen lamps passed through the excitation monochromator [2, 3]. Figure 3 shows a typical xenon lamp spectrum suitable for wavelength calibration illustrating three landmark calibration features: (1) the 0-nm peak associated the zero-order emission of the grating, (2) the first-order peak at 467 nm, and (3) another peak at 991 nm commonly used to calibrate the NIR region. Often times it is a good idea to verify the full range of the monochromator versus the calibration lamp data by beginning the scan at 0 nm to visualize the 0th-order peak (white light); this helps to ascertain the monochromator is calibrated in the first order up to and including the referenced gas emission lines (see Note 1). Figure 4 shows the results of two standard reference material sample-dependent methods commonly used to verify calibration of the excitation optical path, respectively, for absorbance (photometric) and wavelength accuracy. The samples are included in the NIST traceable Starna RM-06HLKI United States Pharmacopeia reference set. Figure 4a shows a typical absorbance scan of the holmium oxide dissolved in 0.1-N perchloric acid measured against the 0.105-N perchloric acid blank. The RM certificate for the holmium spectrum contains the values for the peaks as shown and as defined for the representative spectral band-pass (in this case 5 nm for a typical Aqualog® instrument). Figure 4b shows the typical absorbance spectrum of the potassium dichromate standard solution measured relative to its solvent blank. The values and symbols in the figure refer to the four major calibration values for the RM, namely, the absorbance values at 235 nm, 257 nm, 313 nm, and 350 nm, respectively. Again both the holmium and dichromate RM data provide verification of the excitation path wavelength accuracy and just as importantly the photometric accuracy which itself is critical to correct for inner-filter effect corrections as explained later.
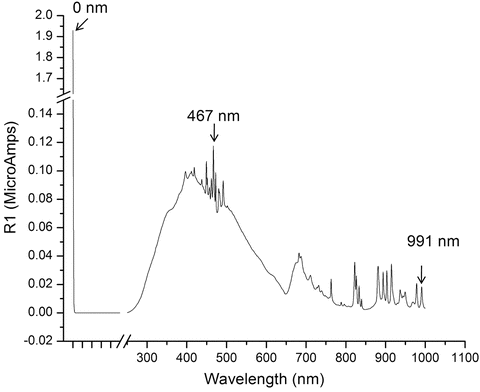
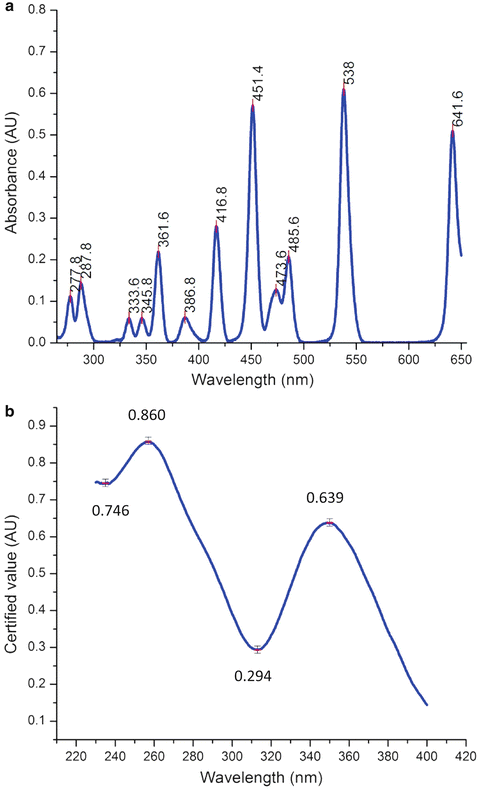

Fig. 3
A typical reference diode detector signal (in microamp units) of the xenon lamp spectrum obtained by scanning the excitation monochromator from 0 to 1,000 nm in 1-nm steps, 1-nm band-pass, and 0.1-s integration time. Three landmark xenon peaks are identified for excitation monochromator calibration purposes including the 0-nm peak, the 467-nm peak, and the 991-nm peak

Fig. 4
Panel (a) shows holmium oxide excitation monochromator spectral calibration standard data from Starna RM-06HLKI set sample traceable to NIST SRM 2034, the peaks are identified within wavelength specification as shown, and the absorbance data were acquired with the absorbance detector and reference detector signals ratioed as A1c /R1c using a blank solution cuvette of 0.105 N HClO4. Panel (b) shows the Starna potassium dichromate photometric (absorbance) accuracy standard sample from the Starna RM-06HLKI set traceable to NIST SRM 935. The calibration data with absorbance values identified within the specifications as shown were measured according to the manufacturer’s certificate instructions for Starna RM-06HLKI
Emission path wavelength calibration for UV-visible spectrofluorimeters usually is achieved by one or more of the following three methods: (1) by analyzing either the peak Raman scattering signal of a purified water sample, (2) measuring the emission peaks of known reference materials under specified excitation-emission wavelengths, or (3) measuring the peak coordinates of the lamp lines used for excitation (see Fig. 3 above) from a diffuse reflector material such as Spectralon™ placed in the sample compartment (see Note 2). Notably accurate water Raman calibration is the most popular method and is most effective when one uses highly purified water in pristine scratch-free cuvettes devoid of scattering particles and importantly with very low total dissolved organic carbon (TOC) at <10-ppb concentrations. The typical water Raman scan as shown in Fig. 5a is performed using 5-nm band-pass on excitation and emission with excitation at 350 nm and emission scanned from 365 to 450 nm (0.5-nm increments). As shown in Fig. 5a, the water Raman (OH stretch) peak signal used for emission calibration is at 3,382 cm−1 from the excitation energy such that 350-nm excitation yields a peak at 397 ± 0.5 nm.
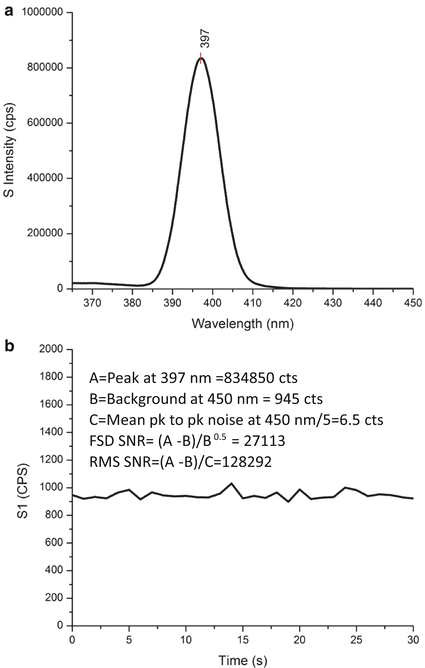

Fig. 5
Typical data used to calculate the water Raman signal-to-noise ratios using both a first standard deviation (FSD) and root-mean-square method (RMS). Panel (a) shows a water Raman spectrum at 5-nm band-pass obtained by exciting the Starna 3Q-10 water sample at 350 nm and scanning the emission in 0.5-nm steps with 1-s integration from 265 to 450 nm. The peak calibration wavelength is labeled at 397 nm. Panel (b) shows the kinetics scan used to evaluate the peak-to-peak noise and RMS of the water Raman sample; the Starna 3Q-10 sample was excited at 5-nm band-pass at 350 nm, and the kinetics of the signal at 450 nm were monitored for 30 s at 1-s intervals. The legend in panel (b) illustrates the parameters from panels (a) and (b) and the calculations of the FSD and RMS
In addition to the emission wavelength calibration, the water Raman sample analysis conditions above are used to calibrate the instrument throughput and signal-to-noise ratio. These data are often instrumental in diagnosing issues with the instrument primarily those associated with the age and output of the excitation source to indicate a need for lamp servicing. The typical Horiba Instrument Inc. water Raman analysis includes in addition to the scan in Fig. 5a a second kinetics scan to define the peak-to-peak and root-mean-square (RMS) value of the noise of the Raman sample signal at 450 nm, excited at 350 nm under 5-nm band-pass conditions. The kinetics are measured for 30 s at 1-s intervals and 1-s integration. From these data, the average peak-to-peak noise value divided by 5 is used to estimate the RMS. Two signal-to-noise ratio (SNR) figures of merit are computed from the data as shown in the legend of Fig. 5b, namely, a first standard deviation (FSD SNR) and a root mean square (RMS SNR). In addition to the throughput information indicated by the peak signal, the two figures of merit each provide unique independent information about the instrument’s performance. The FSD SNR indicates the stray-light rejection of the system as indicated by the average intensity of the background signal at 450 nm. The RMS SNR indicates the electronic noise associated with the instrument, which influences the background intensity readings at 450 nm (see Note 3).
Near-infrared emission path wavelength calibration and throughput are commonly achieved using excitation-emission lines from rare-earth-doped laser glass materials (Schott Laser Glass 2 % Nd) in addition to measuring at characteristic reflected lamp emission lines. The data in Fig. 6 show the results of an emission scan of the 2 % Nd glass sample measured at an angle of 30° from normal excitation. The band-pass was 5 nm, excitation was at 575 nm, and the emission was measured with an InGaAs array and an emission spectrograph over the range of 800–1,500 nm with an integration time of 30 ms for the entire emission scan. The landmark emission peak at 1,053 nm is used to verify wavelength calibration, and the intensity of the peak can be used to judge the total instrument throughput under the defined sample position and instrument conditions.
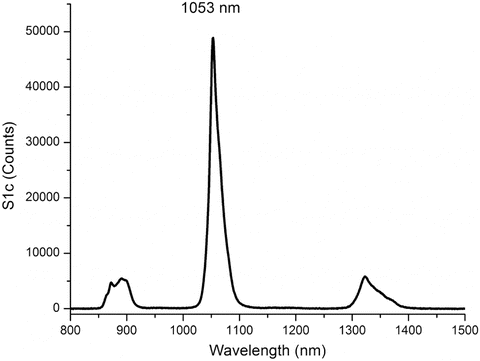

Fig. 6
A typical emission scan of a 2 % Nd-doped laser phosphate glass material (Schott Glass) measured at 5-nm band-pass, excitation at 575 nm, and emission at 1-nm increments from 800 to 1,550 nm with a 150-ms integration time. The instrument was a Nanolog® from Horiba Instruments Inc., equipped with a double-grating excitation monochromator with gratings at blazed at 500 nm with 1,200 lines/mm. The emission was measured with a Symphony InGaAs array detector (512 × 1 array, 50-μm pixels, −170 °C) mounted on an iHR320 imaging spectrograph using an emission grating blazed at 800 nm with 100 lines/mm
2.2 Excitation Intensity and Spectral Correction Factors
Experimentally the excitation intensity can vary widely as a function of the light source, grating efficiency, selected wavelength, chosen band-pass, and placement of filters before the sample excitation. As explained above, the excitation intensity and spectral response are typically monitored with a reference detector that receives a small fraction (on the order of a few percent) of the beam reflected from a “pick-off” beam splitter. The beam splitter is ideally made of quartz material to effectively transmit light from the deep ultraviolet (UV) into the near infrared. The beam splitter should be angled to minimize polarization artifacts. Whereas the reference detector signal itself accounts for the vast majority of the excitation correction, there is still a substantial fraction of the ideal response that requires correction that is associated with the combined wavelength dependence of the reference detector and beam-splitter transmission-reflection properties [2, 3, 5, 6].
Stay updated, free articles. Join our Telegram channel

Full access? Get Clinical Tree


