Fig. 1
Principle of homo-FRET process. (a) Angular orientation of donor (cyan) and acceptor (yellow-orange) transition dipoles are shown as θ D and θ A, respectively, where the intermolecular distance is shown as r. The extent of depolarization in the emission is dependent on the angle between the two transition dipoles, during the energy transfer process. (b) Spectral overlap integral J (λ) (shown in gray) between the donor emission (E D ) and acceptor absorption (A A ) is one of the factors determining the Förster distance, R 0. (c) A pool of isolated fluorophores when excited by polarized light (in the absence of significant rotational motions) results in fluorescence emission being relatively polarized (top). When fluorophores are relatively close together (in circles below), homo-FRET can take place between two like fluorophores, if the fluorophores have a significant overlap between their own excitation and emission spectrum, resulting in depolarized fluorescence emission and a lower value of anisotropy. Adapted with permission from Krishnan et al. [2] and Sharma et al. [18]
![$$ E=1/\left[1+{\left(r/{R}_0\right)}^6\right] $$](/wp-content/uploads/2017/03/A270600_1_En_9_Chapter_Equ1.gif)
(1)
Fluorescence anisotropy (r) is defined by
where I pa and I pe are the emission intensities collected in the parallel and the perpendicular directions, respectively. Since fluorescence anisotropy (r) is normalized to the total intensity (denominator term), its readout can be considered as a sum of intensity-weighted fluorescence anisotropies of individual fluorophores. The polarized illumination allows selective excitation (photoselection) of a pool of fluorophores with excitation dipoles aligned to the plane of illumination. The depolarization (or loss of anisotropy) of the fluorescence emission of a population of photoselected fluorophores can be dictated by two processes, rotational diffusion and homo-FRET. In a dilute solution of fluorophores (say 1–10 μM), the high intermolecular distances (r ≫ R 0) between individual fluorophores preclude homo-transfer, and hence, the anisotropy of emission is depolarized only by rotational diffusion. The rotational diffusion rates of molecules are governed by their size and local viscosity. If the rotational diffusion time is smaller than the lifetime of the probe, the probe can tumble multiple times during its lifetime and thereby depolarize the emission. The same probe when placed in a considerably more viscous medium will have much higher rotational diffusion time than its lifetime, and hence, the emission retains polarization partially. The Perrin equation provides the relationship between rotational diffusion, viscosity and molecular size, and fluorescence anisotropy (r):
where T is the temperature, V is the hydrodynamic volume, η is the viscosity, τ is the rotational correlation time, and R is the universal gas constant [7]. Here r 0 is the fundamental anisotropy of the fluorophore in the absence of any rotational diffusion and arising only from the photoselection and the angular displacement between its excitation and emission dipoles. Homo-FRET can further depolarize the fluorescence emission (and thereby reduce emission anisotropy) under conditions of low inter-fluorophore distances (r < R 0) and significant spectral overlap. This is because photoselected fluorophores can transfer energy to acceptors with different relative angular orientations of their transition dipoles. Moreover, the acceptors can also undergo rotational tumbling during its fluorescence lifetime, thereby reducing the emission anisotropy of the system considerably (Fig. 1c). Since both the acceptor and donor are spectrally similar in homo-FRET, a precise measurement of the extent of loss in fluorescence emission anisotropy is the only way to monitor homo-FRET.
(2)
(3)
In most experiments, a comparison of the fluorescence anisotropy of an experimental sample is made with situations where there is no FRET. Like hetero-FRET, an expression for homo-FRET efficiency can make quantitative comparisons across different measurements convenient. One can use an expression based on measuring anisotropies r c and r m of donor fluorescence in the presence or absence of FRET conditions, respectively, i.e.:

It must be noted that the above equation is valid only under simple assumptions that homo-FRET is the only agent for the change in anisotropy and where excitation after leaving the donor never returns to the same donor species and where there is no change in the donor lifetimes [5].
(4)
The spatiotemporal interaction of like fluorophores inside living cells can be imaged by implementing the measurement of fluorescence anisotropy in a microscope configuration. In subsequent sections we describe how homo-FRET imaging is carried out in living cells to look at the nanoscale organization of cell surface molecules.
2 Materials
2.1 Buffers and Media
All the buffers and media are prepared in autoclaved Milli-Q-filtered water and filter sterilized prior to storage:
1.
Medium 1(M1) buffer: 150 mM NaCl, 20 mM HEPES, 5 mM KCl, 1 mM CaCl2, 1 mM MgCl2, pH 7.2–7.4.
M1 can be used as the buffer system for washing, labeling, and imaging cells (both live and fixed) for fluorescence imaging. M1 should be supplemented with 2 mg/ml of glucose (M1-Glc) for live cell imaging.
2.
Phosphate buffer saline (PBS): 137 mM NaCl, 2 mM KCl, 10 mM Na2HPO4, 2 mM KH2PO4, pH 7.4.
PBS is widely used for passaging of cells and clearing coverslips and in immunofluorescence experiments with CHO cells.
3.
Cell culture media: Chinese hamster ovary (CHO) is maintained in Ham’s F12 medium (HiMedia). The cells expressing folate receptor are specifically maintained in a folate-free variant of HF-12, which also needs to be supplemented by dialyzed serum (free of folate) when labeling the receptor with folate analogs.
2.2 Cell Lines
1.
CHO cell line stably expressing folate receptor (FR-GPI), also referred to as IA2.2F, is used to study the native nanoscale organization of FR-GPI. They are also used for labeling the cells with different lipid probes to look at their specific organization.
2.
CHO cell line stably expressing EGFP-GPI, also referred to as GG8. These cells do not need any exogenous labeling as they are expressing GPI-anchored fluorescent protein. Instead, they need to be treated with cycloheximide (50–75 μg/ml) for 3 h prior to imaging to clear the pool of the protein residing in internal organelles like the Golgi and the endoplasmic reticulum.
2.3 Reagents for Cleaning Coverslips
1.
Hellmanex III (Hellma Analytics): An alkaline cleaning agent for glass surfaces.
2.
Piranha solution: Conc. H2SO4, 30 % H2O2 (Merck).
3.
Phosphate buffer saline (PBS).
2.4 Reagents for Replating Method
1.
Ham’s F12 media without phenol red (HiMedia, India) are reconstituted in water with NaHCO3 (Merck, India) as per manufacturer’s instructions (see Note 1 ).
2.
Cell de-adhering buffer: 5 mM EDTA (Na+ salt, Merck) in Ca2+– and Mg2+-free M1 (150 mM NaCl, 20 mM HEPES, 5 mM KCl, pH 7.4).
3.
Human/bovine fibronectin (Sigma-Aldrich), used at 1 mg/ml, maintained as 10 μl aliquots at −20 °C or 4 °C as per manufacturer’s instructions.
2.5 Solvents for Lipid Storage
HPLC grade chloroform, methanol, ethyl acetate, acetone, water (SD-Fine Chemicals, India).
2.6 Reagents for Lipid Incorporation
1.
Lipofectamine (Invitrogen).
2.
Fatty acid-free BSA (Sigma-Aldrich).
3.
γ-Cyclodextrin (Sigma-Aldrich).
2.7 Reagents to Label the Cell Membrane
1.
Folate analogs: Folate analog (pteroyl lysine) is synthesized in the laboratory and conjugated to commercially available organic fluorophores like FITC, BODIPY-TMR, or BODIPY-FL (Molecular Probes) to generate the analogs of varying spectral ranges. These analogs can be used for the cell surface labeling of FR-GPI.
2.
Lipid analogs: The fluorescent analogs (Molecular Probes, Avanti Polar Lipids) of sphingomyelin (C5-BODIPY-FL SM, chain labeled) and phosphatidylethanolamine (BODIPY-FL-DHPE, head labeled) have been used to study the nanoscale organization of incorporated probes.
2.8 Reagents to Mark Intracellular Compartments
1.
Transferrin (Tf): Apo-transferrin (Sigma-Aldrich) is iron loaded, purified, and stored at 4 °C [8]. 1 mg of iron loaded transferrin is conjugated to Alexa 647 (Molecular Probes) such that it gives a dye to protein ratio of 1:1, followed by purification by size exclusion chromatography, and stored at 4 °C. Conjugated Tf was pulsed at 10 μg/ml concentration.
2.
10 kDa dextran (Invitrogen) conjugated to FITC as reported in [9] is stored at 4 °C and pulsed at 1 mg/ml.
3 Methods
Here we will highlight in a stepwise manner the different stages of making a homo-FRET measurement, from preparing the cells, setting up the microscope, followed by the analysis and interpretation of the data.
3.1 Cleaning Coverslips to Minimize Background Noise Due to Sticking of Probes
Homo-FRET is a sensitive technique, and hence, it is very important to minimize the background signals emanating due to nonspecific sticking of fluorescent probes on glass coverslips. For this purpose, prior to plating cells, we resort to one of the following methods to clean the coverslips.
3.1.1 Piranha Solution
This is a 3:1 mixture of concentrated sulfuric acid (conc. H2SO4) and hydrogen peroxide (H2O2), which forms a strong oxidizing agent to remove organic residues from the coverslip. This solution is prepared fresh each time by adding conc. H2SO4 drop by drop (! caution: exothermic reaction!) into cold H2O2 solution in a beaker and with frequent mixing. To this piranha solution, coverslips are added and incubated for 30 min followed by thorough cleaning with double-distilled water five times and then once with PBS. The treated coverslips are air-dried and UV exposed prior to plating cells for experiment.
3.1.2 Hellmanex III
This is a strong alkaline reagent used to clean glass surfaces of coverslips and cuvettes. Coverslips are incubated with 1 % Hellmanex III solution (in ion-free water, double-distilled water) at room temperature for 45 min and then washed thoroughly with copious amounts of double-distilled water five times and then one final wash with PBS. The coverslips are air-dried and UV exposed prior to plating cells for experiment (see Note 10 ).
3.2 Methods to Get Rid of Lipid Sticking on Coverslips
In case of certain lipids especially BODIPY-tagged lipids, cleaning the coverslips by the above mentioned methods might not be enough to minimize nonspecific sticking, and in such cases, we resorted to replating method. In this method, post-lipid incorporation, the cells were de-adhered and replated on to fresh coverslips coated with fibronectin for the cells to adhere faster.
1.
Fibronectin plating on coverslip dishes: Coverslips were incubated with fibronectin (10 μg/ml) at 37 °C for 1 h or 4 °C overnight. Excess fibronectin was gently removed and the coverslips were rinsed once with PBS before use.
2.
Protocol: Cells grown on coverslip for 24 h and at 80 % confluence are incubated in 5 mM EDTA solution (in Ca2+– and Mg2+-free M1 or PBS, pH 7.2–7.4) for 10 min at 37 °C. During this time the cells will round up and float in the buffer, failing which it is advisable to tap gently on the sides of the coverslip (see Note 8 ). The cells floating in the buffer are then transferred to a 1.5 mL Eppendorf tube (see Note 9 ) and centrifuged at room temperature or 4 °C (as per requirement) at 82 × g for 10 min. The supernatant is carefully removed and the pellet containing cells are resuspended in Ham’s F12 media. These cells are then transferred on to fibronectin-coated dishes, followed by incubation at 37 °C for 30 min. During this time the cells will re-adhere to the coverslip completely, ready to be used for microscopic imaging.
One can use a combination of methods described in Subheadings 3.1 and 3.2 to get rid of the background sticking (Fig. 2).
Fig. 2
Flowchart of cell surface labeling strategies. Protocols for exogenous labeling of FR-GPI (with fluorescent folate analogs) and incorporation of fluorescent lipid probes via three different methods, using γ-CD, defatted BSA, and lipofectamine
3.3 Preparing Cells for Microscopy
3.3.1 Exogenous Labeling of Cells with Folate Analogs
CHO cells expressing folate receptor are plated in HF-12 (with dialyzed serum) at a density such that they become semi-confluent (70–80 %) in 36–42 h. The media are removed from the dishes, and the cells are washed 2–3 times gently with cold 1× M1-Glc buffer. Cells can be labeled with folate analog resuspended in M1 at saturating concentrations (~100–500 nM) on ice for 45 min [10]. Following this, the labeling mix is removed, and the cells are washed gently two times with cold M1-Glc and further imaged live in the same buffer at the desired temperatures (Figs. 2 and 3).
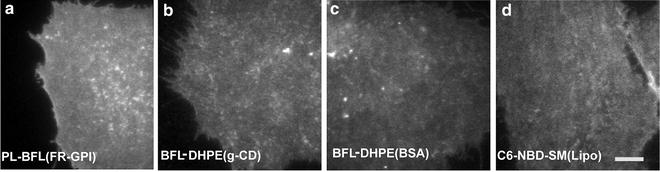
Fig. 3
Cell surface labeling of lipid probes and lipid-tethered proteins. Representative images of CHO cells labeled exogenously with fluorescent folate analog (PL-BFL) to mark the surface expressed folate receptor (FR-GPI) (a) or incorporated with lipid probes like BODIPY-FL-DHPE (BFL-DHPE) by either γ-CD method (b) or defatted BSA (c) method and C6-NBD-SM by lipofectamine method (d) and imaged on a custom-built TIRF-anisotropy platform. Scale bar 5 μm
3.3.2 Preparing Cells Expressing Fluorescent Protein Constructs
The power of the homo-FRET technique also lies in the fact that it can be easily extended to making measurements on fluorescent protein-based chimeric constructs, like EGFP-GPI, which is a lipid-tethered protein we have extensively studied. Since most of the GFP-tagged proteins in cells are fluorescent, there is considerable fluorescence from the biosynthetic pool of GFP-tagged proteins present in ER, Golgi, and secretory vesicles. This is undesirable when measurements are made on GFP-tagged proteins (GFP-GPI in our case) present on cell surface. Cycloheximide treatment is used to deplete GFP-tagged proteins from its biosynthetic pool. For GPI-APs, conditions required for depletion of proteins from biosynthetic pool was found to be highly cell type specific. In CHO cells, 50–75 μg/ml of cycloheximide reconstituted into plating medium for 3 h could remove Golgi-localized GPI-APs from >90 % of the cells [9]. Post-cycloheximide treatment, the media from the dishes are removed, and the dishes are washed 2–3 times gently with cold M1-Glc buffer. The experiments are done using M1-Glc as the imaging buffer at the desired temperature.
3.3.3 Exogenous Incorporation of Lipids into Cells
Lipid molecules are amphipathic in nature due to the presence of hydrophilic head group and hydrophobic lipid tails. This property of lipid molecules poses a problem for exogenous incorporation into native cell membrane. This problem can be solved by using a vehicle to transfer lipids into the cell membrane, which can be lipids that help in the formation of micelles, lipid transfer proteins or lipid trapping organic molecules. Based on this, lipids are incorporated into the cell membrane by three different methods. In particular, we introduce lipofectamine-based lipid incorporation as a novel method: (1) BSA method, (2) γ-CD method, and (3) lipofectamine method. In each of these methods, prior to incubation of lipid complexes with cells, it is important to get rid of the serum components which itself are capable of trapping lipids. For this purpose the cells are incubated in Ham’s F12 media for 15 min at 37 °C prior to incorporation of lipids.
1.
Get Clinical Tree app for offline access

BSA method: Bovine serum albumin (BSA) contains lipid pockets that can stably incorporate lipid molecules. The BSA-lipid complexes are incubated on cells to exchange the lipids from BSA to that of the cell membrane [11] and hence act like lipid transfer proteins. However, the BSA-lipid complex formation is dependent on the fatty acid chain length. The longer the chain length, the higher the affinity to BSA and the lower the efficiency of lipid transfer to the membrane [12, 13] (see Note 4 ). This method works efficiently for lipids with short fatty acid tails:
(a)
Preparation of BSA-lipid complexes: Fatty acid-free BSA, dissolved in Ham’s F12 media (20 μM), is added to dried lipids such that final BSA-lipid complex attains BSA to lipid ratio 1:x (x > 1 for short lipid tails C8–C12 and x < 1 for long lipid tails). The mix was vortexed vigorously or probe sonicated (3 × 2 s) for three times (see Note 5 ).
(b)


Protocol for lipid incorporation as BSA-lipid complexes: Firstly to get rid of serum components, the cells are incubated in Ham’s F12 media for 15 min at 37 °C followed by incubation with BSA-lipid complexes for 30 min either on ice for short-chain lipids or at 37 °C for long-chain lipids (see Note 11 , Fig. 3b)
Stay updated, free articles. Join our Telegram channel
Full access? Get Clinical Tree