Fig. 5.1
Distribution of incident cases of CF in the UK by deprivation quintile 1996–2010. Error bars represent 95 % binomial CIs (n = 2066) (Source: Adapted from Taylor-Robinson et al. 2013b)
Clinical Management of CF
Describing the management of CF in any depth is beyond the scope of this chapter, but for a succinct review see Davies and colleagues (2007). In brief, the key treatment outcomes considered in the analysis relate to respiratory and nutritional therapies:
Treatment of respiratory infections with antibiotics is a central pillar of CF therapy including for prophylaxis; eradication of infections; long-term treatment of chronic infection, and treatment of acute exacerbations. The aim is to prevent initial bacterial infection in children, and promptly treat acute infections using antibiotics. Acute chest infections (exacerbations) are treated with oral, nebulised, and/or IV antibiotics.
DNase is an inhaled mucolytic that breaks down the thick sputum in the lungs. This was first commercially available in 1992, and was the first treatment to demonstrate an improvement in lung function in CF (Fuchs et al. 1994).
The main aims of nutritional support in CF are to achieve optimal nutritional status, and allow normal growth and development throughout childhood. Pancreatic enzyme insufficiency leads to malabsorption of fats, diarrhoea, and failure to thrive, and this is compounded by lung disease and infection, which further increases calorie requirements. Thus recommendations are for early nutritional support with adequate pancreatic replacement management, as this has been shown to improve growth and subsequent lung function (Konstan et al. 2003; Munck et al. 2009).
Previous Research on Health Inequalities and CF
People with CF from more disadvantaged groups in the UK and US die earlier than those from more advantaged backgrounds. In the UK, the first study to look at social differences in survival in CF found a consistent trend from 1959 to 1986 towards higher age at death in CF patients in more advantaged social groups on the basis of occupational class (Britton 1989). The authors speculated that the observed lower survival chances in lower social classes could relate to lack of access to the appropriate services, poorer nutrition, increased parental smoking, and poorer quality housing.
Evidence from the US corroborated these findings, and indicated higher survival rates in the 1980s and 1990s among more advantaged socio-economic groups, measured by Medicaid status and area-based income, compared with their less advantaged counterparts (Schechter et al. 2001; Schechter 2004; O’Connor et al. 2003). For instance the adjusted risk of death was around four times higher in CF patients with Medicaid cover (used as a surrogate for poverty) compared to those without Medicaid cover (Schechter et al. 2001). Two studies from the US showed differences in lung function on the basis of measures of SES. For instance Schechter et al. also showed significantly lower percent predicted forced expiratory volume in one second (%FEV1) at age 5 in the Medicaid patients (9.2 percentage points, 95 % CI 7.1–11.4), and this gap increased slightly in an age dependent manner up to age 20. O’Connor et al. extended the work of Schechter’s team by demonstrating a social gradient in the relationship between area-based income in the US, and mortality rates, lung function and weight (O’Connor et al. 2003). The authors point out the limitations of the ecological (area-based) measure of SES used in their analysis, and suggest that the associations observed may be due to poor adherence to medications, or local environmental conditions.
In many chronic illnesses, differences in access to specialist health care by SES are evident. These differences often contribute to the exacerbation of health inequalities, since a bias towards more advantaged groups is widespread across health care (Stirbu et al. 2011). This could be particularly important in the context of inequalities in outcomes for a disease like CF, where treatment advances have had such a profound effect on survival. The studies exploring access to services and treatments in CF have been predominantly from the US, and have demonstrated a mixed picture, depending on the type of treatment under consideration, and the exact measure of SES used (O’Connor et al. 2003; Schechter et al. 2009, 2011). For instance, one study showed greater access to intravenous (IV) antibiotics for older children, on the basis of area-based income, but also showed no difference in access to DNase, another important treatment in CF, using Medicaid status as a measure of SES (Schechter et al. 2009). Overall the US studies have played down the role of health service factors in the generation of health disparities in CF. However, it is debatable how much of this evidence can be generalized to other health care settings, especially to the UK context, where access to health services is free at the point of use.
Using the Diderichsen Model to Study Inequalities in CF Outcomes in the UK
To gain a better understanding of when and how inequalities in outcomes develop in cystic fibrosis in a UK context, the studies summarised in the subsequent sections of this chapter explored the effect of deprivation on growth, nutrition, lung function, risk of Pseudomonas aeruginosa colonisation, and the use of major cystic fibrosis treatment modalities in a UK-wide population cohort, in the context of a the British NHS, a universal healthcare system, free at the point of use (Taylor-Robinson 2013; Taylor-Robinson et al. 2013a, b).
The studies involved longitudinal analyses of individual level patient data from the UK CF Registry, which is supported and co-ordinated by the UK CF Trust (2013; Adler et al. 2008), and records information about the health and treatment of patients with CF from diagnosis onwards. The Registry is estimated to include nearly all people with CF in the UK population (Mehta et al. 2004) and is therefore ideally suited to the study of outcomes and treatments across the whole socio-economic spectrum in the UK society. The studies use postcodes to link individuals to small area deprivation measures in the UK as a measure of socio-economic status (SES), since individual level measures of patient SES, such as parental education level, were not available. The indices of multiple deprivation combine economic, social and housing indicators measured at the census into a fine grained composite deprivation score for small areas in the UK constituent countries (ONS 2011).
The analyses were informed by the Diderichsen model of pathways to health inequalities (Diderichsen et al. 2001). This model captures key concepts in our contemporary understanding of how health inequalities are generated, and was used as the conceptual basis for the work of the WHO Commission for Social Determinants of Health (CSDH 2008). The framework conceptualises the generation of health inequalities occurring through four main pathways over the life course (Fig. 5.2): through social stratification itself, which is the process by which people are sorted into different social positions (for example by social inequalities in the education system); because social stratification leads to differential exposure to risk factors (for example children living in poverty are more likely to be exposed to second-hand smoke in the home); differential vulnerability at the same level of exposure (for example due to clustering of cardiovascular risk factors, smoking is more harmful to health in the presence of high blood pressure (Capewell and Graham 2010)); and differential consequences of ill health (for example less advantaged groups who experience cardiovascular events are more likely to become unemployed than individuals in more advantaged positions (Holland et al. 2009)).
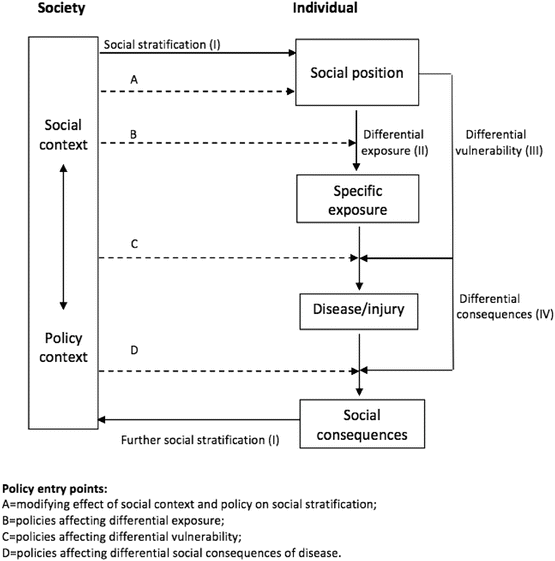

Fig. 5.2
A conceptual model for studying the effect of social position and social context on health (Adapted from Diderichsen et al. 2001)
A key feature of the Diderichsen model is that it incorporates both social causation and social selection mechanisms within a common framework, across the life course. Importantly, the model also explicitly links the broader social environment to the causal pathway at the individual level and makes it clear that the social determinants of health are policy sensitive (Taylor-Robinson 2013).
Using the Diderichsen model, the studies outlined here explored how the clinical consequences of CF vary in the UK on the basis of SES across the life course, and how exposure to health damaging risk factors such as acquisition of important lung infections, and use of major CF treatment modalities vary over time.
A neglected area of study has been the effect of SES on social outcomes in CF, such as employment status. Understanding the social consequences of ill health is a key step in elucidating the pathways to health inequalities, since any adverse social outcomes that occur as a result of ill health can feedback and further damage health status. For example, ill health might lead to job loss, which can then have further adverse effects on health status, mediated by a range of physical and psycho-social mechanisms. Furthermore, there is evidence from social epidemiological studies to suggest that, in many settings, it is people from more disadvantaged backgrounds who particularly experience adverse health outcomes as a result of ill health – so called differential social consequences in the Diderichsen model (Milton et al. 2006; Holland et al. 2009; Carlsen et al. 2007, 2008).
The Effect of Socioeconomic Status on Clinical Outcomes in Cystic Fibrosis in the UK
In the UK studies, children with CF from more disadvantaged areas were shown to have worse growth and lung function trajectories compared with children from more affluent areas, but these inequalities did not widen with advancing age (Table 5.1). Looking at growth in the UK CF population in more detail, Fig. 5.3 shows clinically important differences for weight, height BMI on the basis of area deprivation. In a longitudinal analysis, adjusting for a range of confounding factors, the difference in weight and height standard deviation (SD) score is about one third between the most and least advantaged quintiles, whereas for BMI the difference is about one sixth of a standard deviation score (z-score). These results show that having CF, and living in the most disadvantaged areas of the UK effectively doubles the nutritional disadvantage experienced by a person with CF. The deprivation gap in weight is greatest in the first few months of life, at the time of diagnosis, and there follows narrowing of the gap up to around age 3 from around −0.54 SD scores (95 % CI –0.73 to –0.34) at birth to −0.28 (95 % CI −0.38 to −0.18) at age 3, but then the gap remains constant into adulthood (Fig. 5.4).
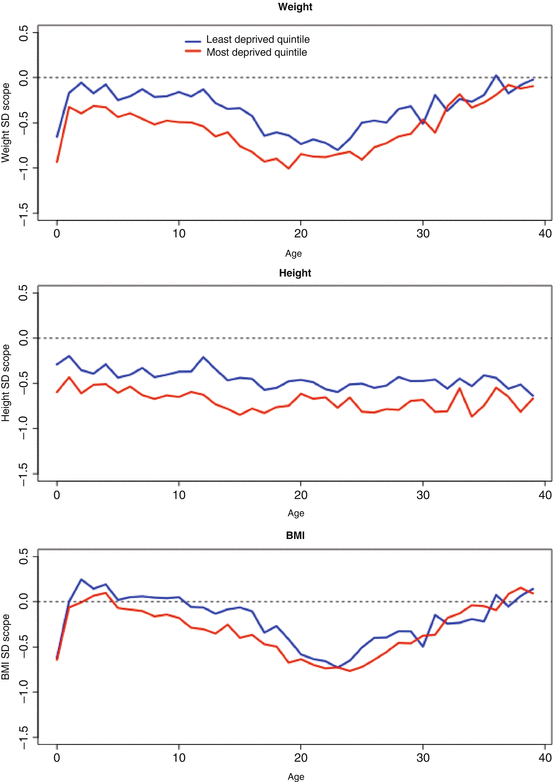
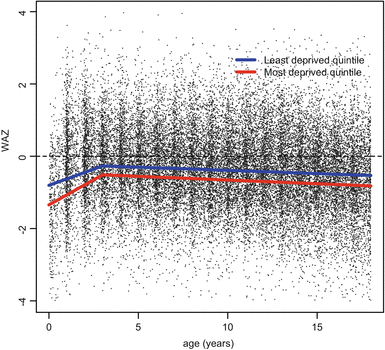
Table 5.1
Summary of adjusted effects of deprivation on clinical outcomes and use of therapies in the paediatric and adult CF population in the UK
Age < 18 | Age 18–40 | |
|---|---|---|
Clinical outcomes a | ||
Lung function as measured by percent predicted forced expiratory volume – %FEV1 (%) | −4 · 12 (−5 · 01 to −3 · 19) | −1 · 6 (−4 · 41 to 1 · 25) |
Weight-for-age (SD score) | −0 · 28 (−0 · 38 to −0 · 18) | −0 · 31 (−0 · 46 to −0 · 16) |
Height-for-age (SD score) | −0 · 31 (−0 · 40 to −0 · 21) | −0 · 31 (−0 · 43 to −0 · 19) |
BMI-for-age (SD score) | −0 · 13 (−0 · 22 to −0 · 04) | −0 · 12 (−0 · 25 to 0 · 01) |
OR for P. aeruginosa colonisation | 1 · 89 (1 · 34 to 2 · 66) | 1 · 78 (1 · 26 to 2 · 51) |
Therapies | ||
OR for any IV therapyb | 2 · 52 (1 · 92 to 3 · 17) | 1 · 89 (1 · 51 to 2 · 38) |
Mean difference IV days per year (%)b | 15 · 9 (8 · 2 to 24) | 10 · 6 (2 · 5 to 19 · 2) |
OR for supplemental feedingc | 1 · 78 (1 · 42 to 2 · 2) | 2 · 38 (1 · 69 to 3 · 36) |
OR for DNase therapyb | 0 · 40 (0 · 21 to 0 · 72) | 0 · 37 (0 · 26 to 0 · 52) |
OR for inhaled antibioticsc | 0 · 66 (0 · 47 to 0 · 93) | 0 · 40 (0 · 31 to 0 · 5) |

Fig. 5.3
Anthropometric outcomes: mean cross-sectional weight, height, and BMI by age comparing extremes of deprivation quintile (red most deprived) (Adapted from Taylor-Robinson et al. 2013a)

Fig. 5.4
Longitudinal weight trajectory in children in the UK with CF comparing extremes of deprivation quintile. Trajectories plotted at reference values for other covariates in the regression model: female sex, homozygote delta F508 carrier, not diagnosed by screening, white, born in 1991 (Adapted from Taylor-Robinson 2013)
The finding of a social gradient in growth outcomes, evident from around the time of diagnosis, points to important effects of deprivation in utero, and/or in the initial period prior to diagnosis. Both are plausible, but a limitation of studies thus far has been a lack of data on birth-weight, which would complete the picture. The association between low SES and low birth-weight, and length is well established in the general population (Spencer et al. 1999; Marmot et al. 2010; Howe et al. 2011, 2012). The causes for this are likely to be multi-factorial and relate to maternal health, including stress, diet, drug, alcohol and tobacco use during pregnancy (Marmot et al. 2010). The question remains, however, as to how having CF modifies this relationship. Direct comparison of the SES effect on growth in the CF population, and the general population is challenging, due to the lack of studies using comparable SES measures and birth cohorts, and due to the effect of the obesity epidemic in the general population, whereby a relationship between overweight and low SES emerges from around age 4 onwards (Howe et al. 2011, 2012). This is in contrast to CF, where children are consistently underweight compared to the UK reference population (Taylor-Robinson et al. 2013a). Further data on SES gradients in birth-weight in CF would clarify the extent to which the early growth differentials demonstrated are a reflection of the broader SES effects on birth-weight in the general population. The narrowing of inequality in weight SD score in the first 3 years of life is an important finding and suggests that diagnosis and treatment for CF in the NHS may be having a pro-poor, or ‘levelling-up’ effect on health inequalities. This has policy implications, and supports the universal screening that has been introduced in the UK to allow earlier diagnosis (Taylor-Robinson 2013).
Lung function, as measured by percent predicted forced expiratory volume in one second (%FEV1) is considered one of the most important clinical outcomes in CF, and Fig. 5.5 shows the differences between deprivation quintiles in the UK with respect to key respiratory outcomes. In an adjusted longitudinal analysis (Table 5.1), people from the most deprived areas had significantly worse lung function (–4.12 percentage points, 95 % C1 –5.01 to –3.19), but the deprivation gap in %FEV1 did not increase over the paediatric age range. The prevalence of chronic P. aeruginosa colonisation, the key infection in CF, is also higher in people from the most deprived areas of the UK, from an early age (OR 1.89 in the <18 age group, 95 % CI 1.34 to 2.66) (Table 5.1).
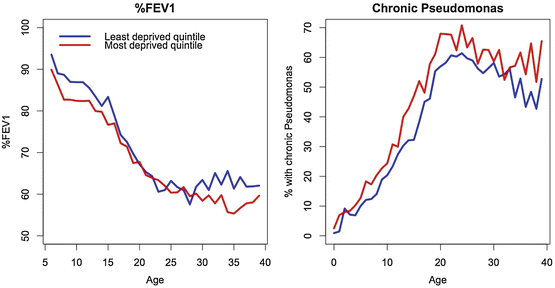

Fig. 5.5
Respiratory outcomes: mean cross-sectional %FEV1 and P. aeruginosa colonization prevalence by age comparing extremes of deprivation quintile (Adapted from Taylor-Robinson et al. 2013a)
The finding of a social gradient in lung function at age 5 in the UK, when it can be first measured on a routine basis, points to the influence of risk factors earlier in the life course. These are likely to include both environmental and healthcare factors. Schechter and colleagues’ found that inequalities in %FEV1 by Medicaid status widened slightly from 5 to 20 years of age (Schechter et al. 2001) in a cross sectional analysis. At round age 5 there was a gap of around 9 % in %FEV1 in the US population, whereas in another study O’Connor and colleagues found a difference of 5.5 % between most and least deprived quintiles (O’Connor et al. 2003). Due to the methodological differences it is not possible to make a direct comparison between UK and US findings in terms of the magnitude of the deprivation gap in lung function (Taylor-Robinson 2013).
In the adult population, growth and P. aeruginosa outcomes were worse in the most deprived adults, but no significant difference in lung function was detected (Table 5.1). The lack of an association between SES and %FEV1 in the adult population is perhaps surprising, given the tendency for social inequalities in health outcomes to increase over time. This may relate to the differences in the use of therapies across social groups described in the next section, or to factors relating to the CF registry, such as left-censoring, selective dropout due to death, and reduced power to detect effects in the adult age range due to the smaller numbers of individuals in the analysis (Taylor-Robinson 2013).
The Effect of Socioeconomic Status on Treatment and Healthcare Use in the UK
Use of IV antibiotic therapy for the treatment of respiratory infections, and clinical exacerbations is a major treatment modality in CF. Longitudinal analysis showed that people in the UK from more deprived areas are about twice as likely to receive IV antibiotics in a particular year, after adjustment for disease severity, on the basis of %FEV1 and P. aeruginosa colonisation status (Odds ratio 2.52, 95 % CI 1.92–3.17 in the <18 age group, and OR 1.89, 95 % CI 1.51–2.38 in the adult age group, comparing most to least deprived quintiles) (Table 5.1, Fig. 5.6). This apparent positive discrimination persists across the age range, from infancy up to 40 years of age. Furthermore if children and adults with CF are recorded as having any IV therapy in a particular year, then people from most deprived areas in the UK, compared to the least, are more likely to have more treatment days (more intensive treatment), after adjusting for disease severity (15.9 % more days in the paediatric age group, 95 % CI 8.2–24, and 10.6 % more days in the adult age group 95 % CI 2.5–19.2). Disaggregating the use of any IV antibiotics into use of therapies at home, and in hospital, demonstrated that the positive discrimination in use of any IV therapy was almost entirely due to delivery of these therapies in hospital, as opposed to home-based treatment. Overall, children from more affluent areas were more likely to be treated at home compared to their more disadvantaged counterparts (Fig. 5.6).
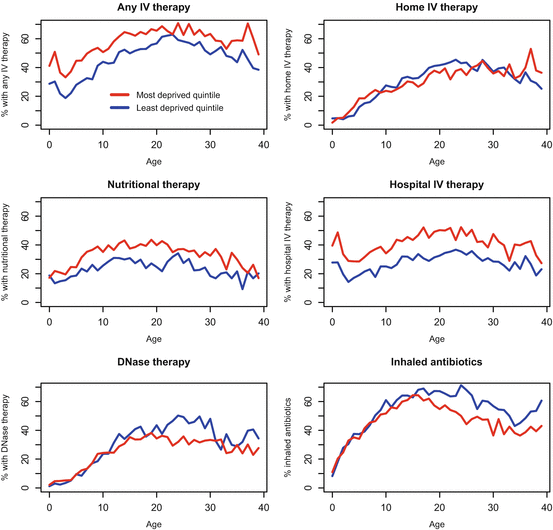

Fig. 5.6
Use of therapies: any IV antibiotic therapy, home IV antibiotic therapy, hospital IV antibiotic therapy, supplemental feeding, DNase, and inhaled antibiotics, by age comparing extremes of deprivation quintile (Source: Adapted from Taylor-Robinson et al. 2013a)
The picture is similar for nutritional therapies, with people from more deprived areas of the UK with CF being more likely to be treated with nutritional therapies, after adjustment for nutritional status, measured on the basis of BMI SD score (OR 1.78, 95 % CI 1.42–2.2 in the <18 age group, and OR 2.38, 95 % CI 1.69–3.36 in the adult age group, comparing the most to the least deprived quintiles).
A different pattern is observed when it comes to use of long term inhaled therapies such as DNase and inhaled antibiotics. There was evidence of inequality in the delivery of inhaled therapies to the UK CF population, after adjusting for measures of disease severity (Table 5.1, Fig. 5.6). Furthermore, this association becomes stronger in the adult age range. In children, there was no association between DNase use and deprivation, prior to adjustment for disease severity. However, after adjustment for disease severity, there was an apparent inequality, suggesting that DNase may not be delivered equitably in children. This analysis was clear in the adult population in both the unadjusted and adjusted associations, with adults from more affluent areas being more likely to report using DNase or inhaled antibiotics in the preceding year.
With regard to the major treatments for CF, the UK studies provide evidence of more intensive treatment being delivered to both children and adults with CF, for two major pillars of CF care – treatment with IV therapies, and nutritional therapies – after adjusting for measures of disease severity. These findings provide evidence of a so-called ‘pro-poor’ bias (Ravallion 2001). Aside from the possibility of residual confounding by severity, one explanation for these findings is that clinicians in the UK are actively taking steps to address, and overcome the perceived excess disadvantage faced by people living in more deprived areas. This may be particularly the case with regard to paediatric care which may be delivered more intensively, and in a hospital setting, to children with CF who are perceived to be living in more disorganised home circumstances, where there may be additional barriers to ensuring that they receive the care and treatments needed (Gupta et al. 2009). More intensive delivery of treatment to more disadvantaged children may further play a role in the reduction in weight inequality over the first few years of life, and the relatively stable inequalities gap demonstrated in the UK studies, as opposed to a finding of increasing inequality.
Longitudinal Employment Status in People with CF
People with chronic illnesses face numerous barriers to entering the labour market, and CF provides a case in point. Factors related to disease severity, such as reduced lung function may restrict employment choices for adults with CF, and the treatment burden further compounds this; adults with CF are generally expected to perform physiotherapy regularly and there are the added demands of taking large numbers of therapies, including frequent visits to hospital (Sawicki et al. 2009).
The analysis of the UK Registry shows that at any one time, about 50 % of the UK CF population was recorded as being in full or part-time employment for all ages, but patterns differed by age, sex, and deprivation status. In a longitudinal analysis, all other things being equal, people from more disadvantaged areas in the UK were less likely to be in employment, and furthermore, social deprivation was found to modify the effect of disease severity in CF: poor lung function, as measured by lower lung function (%FEV1), is more harmful to employment chances for people living in the most disadvantaged circumstances compared to the least (Fig. 5.7, Table 5.2). A fall in lung function in people with CF has more of an effect on employment chances in disadvantaged populations – at the age of 30, a contrast of 40 percentage points in lung function corresponds to a decline in employment prevalence from 69.2 to 66.1 % (3.1 percentage points difference) for men in least deprived quintile, compared to a change from 54.1 to 46.4 % (7.7 percentage points difference) in the most deprived quintile (Table 5.2).
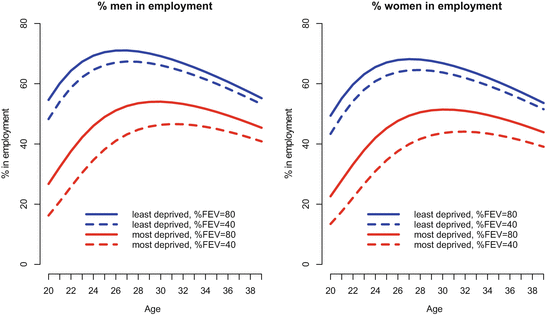

Fig. 5.7
Longitudinal employment trajectory versus age, demonstrating the interaction between deprivation and %FEV1. The lines show the final modelled longitudinal contrasting the adjusted effects of deprivation, and %FEV 1 . Low %FEV 1 is more damaging to employment chances in people living in the most disadvantaged areas. Other covariates in the final model are fixed (Adapted from Taylor-Robinson et al. 2013b)
Table 5.2
Percentage of people with CF in employment at age 30
Employment (%) | Employment (%) | |
|---|---|---|
Men | Women | |
No health or social disadvantage (good lung function and high SES) | 69 · 2 | 66 · 8 |
Health disadvantage only (poor lung function and high SES) | 66 · 1 | 63 · 7 |
Social disadvantage only (good lung function and low SES) | 54 · 1 | 51 · 4 |
Double disadvantage (poor lung function and low SES) | 46 · 4 | 43 · 6 |


