SURVIVAL OF MICROORGANISMS IN THE NATURAL ENVIRONMENT
The population of microorganisms in the biosphere remains roughly constant because the growth of microorganisms is balanced by the death of these organisms. The survival of any microbial group within an environmental niche is ultimately influenced by successful competition for nutrients and by maintenance of a pool of all living cells, often composed of human cells and a consortium of different microorganisms (referred to as the microbiome or microbiota). Understanding competition for nutritional resources within a given microenvironment is essential to understanding the growth, survival, and death of bacterial species (also known as physiology).
Much of our understanding of microbial physiology has come from the study of isolated cultures grown under optimal conditions in laboratories (nutrient excess). However, most microorganisms compete in the natural environment under nutritional stress. Furthermore, a vacant environmental microbial niche will soon be filled with a different microbiota composition. In the end, appreciating the complex interactions that ensure the survival of a specific microbiome is a balance between availability of nutrients and physiologic efficiency.
THE MEANING OF GROWTH
Growth is the orderly increase in the sum of all the components of an organism. The increase in size that results when a cell takes up water or deposits lipid or polysaccharide is not true growth. Cell multiplication is a consequence of binary fission that leads to an increase in the number of single bacteria making up a population, referred to as a culture.
Microbial concentrations can be measured in terms of cell concentration (the number of viable cells per unit volume of culture) or of biomass concentration (dry weight of cells per unit volume of culture). These two parameters are not always equivalent because the average dry weight of the cell varies at different stages of a culture. Nor are they of equal significance: For example, in studies of microbial genetics and the inactivation of microbes, cell concentration is the significant quantity; in studies on microbial biochemistry or nutrition, biomass concentration is the significant quantity.
The viable cell count (Table 4-1) is typically considered the measure of cell concentration. For this, a 1-mL volume is removed from a bacterial suspension and serially diluted 10-fold followed by plating 0.1-mL aliquots on an agar medium. Each single invisible bacterium (or clump of bacteria) will grow into a visible colony that can be counted (see Chapter 5). For statistical purposes, plates containing between 30 and 300 colonies give the most accurate data. The plate count × the dilution × 10 will give the number of colony forming units (CFU)/mL in the undiluted bacterial suspension. Using this method, dead bacteria within the suspension do not contribute to the final bacterial count.
For most purposes, the turbidity of a culture, measured by photoelectric means, can be related to the viable count using a standard curve. As an alternative a rough visual estimate is sometimes possible: For example, a barely turbid suspension of Escherichia coli contains about 107 cells per milliliter, and a fairly turbid suspension contains about 108 cells per milliliter. The correlation between turbidity and viable count can vary during the growth and death of a culture; cells may lose viability without producing a loss in turbidity of the culture.
In principle, biomass can be measured directly by determining the dry weight of a microbial culture after it has been washed with distilled water. In practice, this procedure is cumbersome, and the investigator customarily prepares a standard curve that correlates dry weight with viable cell count. Alternatively, the concentration of biomass can be estimated indirectly by measuring an important cellular component such as protein or by determining the volume occupied by cells that have settled out of suspension.
EXPONENTIAL GROWTH
The growth rate of cells unlimited by nutrient is first order: The rate of growth (measured in grams of biomass produced per hour) is the product of time (t), the growth rate constant (k), and the biomass concentration B:

Rearrangement of equation (1) demonstrates that the growth rate constant is the rate at which cells are producing more cells:

A growth rate constant of 4.3 h−1, one of the highest recorded, means that each gram of cells produces 4.3 g of cells per hour during this period of growth. Slower growing organisms may have growth rate constants as low as 0.02 h−1. With this growth rate constant, each gram of cells in the culture produces 0.02 g of cells per hour.
Integration of equation (2) yields

The natural logarithm of the ratio of B1 (the biomass at time 1 [t1]) to B0 (the biomass at time zero [t0]) is equal to the product of the growth rate constant (k) and the difference in time (t1 – t0). Growth obeying equation (3) is termed exponential because biomass increases exponentially with respect to time. Linear correlations of exponential growth are produced by plotting the logarithm of biomass concentration (B) as a function of time (t).
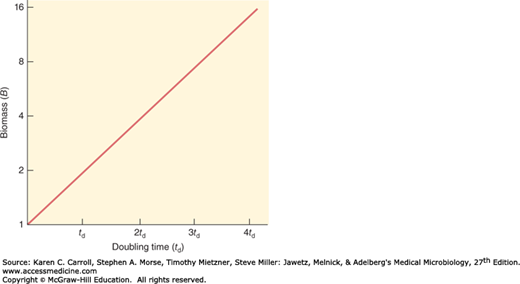
Bacteria reproduce by binary fission, and the average time required for the population, or the biomass, to double is known as the generation time or doubling time (td). Usually the td is determined by plotting the amount of growth on a semi-logarithmic scale as a function of time; the time required for doubling the biomass is td (Figure 4-1). The growth rate constant can be calculated from the doubling time by substituting the value 2 for B1/B0 and td for t1 – t0 in equation (3), which yields

A rapid doubling time corresponds to a high growth rate constant. For example, a doubling time of 10 minutes (0.17 hour) corresponds to a growth rate constant of 4.1 h−1. The relatively long doubling time of 35 hours indicates a growth rate constant of 0.02 h−1.
The calculated growth rate constant can be used either to determine the amount of growth that will occur in a specified period of time or to calculate the amount of time required for a specified amount of growth.
The amount of growth within a specified period of time can be predicted on the basis of the following rearrangement of equation (3):

It is possible to determine the amount of growth that would occur if a culture with a growth rate constant of 4.1 h−1 grew exponentially for 5 hours:

In this example, the increase in biomass is 10−9 g; a single bacterial cell with a dry weight of 2 × 10⁻¹³ g would give rise to 2 × 10⁻⁴ g (0.2 mg) of biomass, a quantity that would densely populate a 5 mL culture. Another 5 hours of growth at this rate would produce 200 kg dry weight of biomass, or roughly 1 ton of cells. This assumes that nutrients are unlimited, which is an assumption that does not occur in nature.
Another rearrangement of equation (3) allows calculation of the amount of time required for a specified amount of growth to take place. In equation (7), shown below, N, cell concentration, is substituted for B, biomass concentration, to permit calculation of the time required for a specified increase in cell number.

Using equation (7), it is possible, for example, to determine the time required for a slowly growing organism with a growth rate constant of 0.02 h−1 to grow from a single cell into a barely turbid cell suspension with a concentration of 107 cells per milliliter.

Solving equation (8) reveals that about 800 hours—slightly more than a month—would be required for this amount of growth to occur. The survival of slowly growing organisms implies that the race for biologic survival is not always to the swift—those species flourish that compete successfully for nutrients and avoid annihilation by predators and other environmental hazards.
THE GROWTH CURVE IN BATCH CULTURE
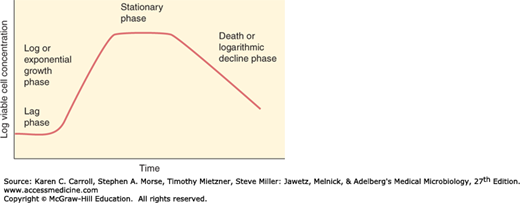
If a fixed volume of liquid medium is inoculated with microbial cells taken from a culture that has previously been grown to saturation and the number of viable cells per milliliter is determined periodically and plotted, a curve of the type shown in Figure 4-2 is usually obtained. The phases of the bacterial growth curve shown in Figure 4-2 are reflections of the events in a population of cells, not in individual cells. This type of culture is referred to as a batch culture. The typical growth curve may be discussed in terms of four phases (Table 4-2). Batch culture is a closed system with finite resources; this is very different from the environment of the human host where nutrients are metabolized by bacteria and human cells. Nonetheless, understanding growth in batch culture provides fundamental insight into the genetics and physiology of bacterial replication, including the lag, exponential, stationary, and death phases that comprise this process.
FIGURE 4-2
Idealized bacterial growth curve plotting the log viable cell concentration versus time. Noted in the figure are the lag, log, stationary, and death phases with the approximate rates of increase or decrease representing what one would see upon inoculating a single bacterial colony in a closed batch culture system.
The lag phase represents a period during which cells, depleted of metabolites and enzymes as the result of the unfavorable conditions that existed at the end of their previous culture history, adapt to their new environment. Enzymes and intermediates are formed and accumulate until they are present in concentrations that permit growth to resume.
If the cells are taken from an entirely different medium, it often happens that they are genetically incapable of growth in the new medium. In such cases, a long lag in growth may occur, representing the period necessary for a few variants in the inoculum to multiply sufficiently for a net increase in cell number to be apparent.
During the exponential phase, the cells are in a steady state and grow as modeled in equations 5–7. New cell material is being synthesized at a constant rate, but the new material is itself catalytic, and the mass increases in an exponential manner. This continues until one of two things happens: either one or more nutrients in the medium become exhausted or toxic metabolic products accumulate and inhibit growth. For aerobic organisms, the nutrient that becomes limiting is usually oxygen. When the cell concentration exceeds about 1 × 10⁷/mL, the growth rate decreases unless oxygen is forced into the medium by agitation or by bubbling in air. When the bacterial concentration reaches 4–5 × 10⁹/mL, the rate of oxygen diffusion cannot meet the demand even in an aerated medium, and growth is progressively slowed.
Eventually, the exhaustion of nutrients or the accumulation of toxic products causes growth to cease completely. In most cases, however, cell turnover takes place in the stationary phase: There is a slow loss of cells through death, which is balanced by the formation of new cells through growth and division. When this occurs, the total cell count slowly increases, although the viable count stays constant.
Stay updated, free articles. Join our Telegram channel

Full access? Get Clinical Tree


