(1)
Department Cell and Molecular Biology, John A. Burns School of Medicine, University of Hawaii, Honolulu, HI, USA
Abstract
Frequency domain fluorometry is a widely utilized tool in the physical, chemical, and biological sciences. This chapter focuses on the theory of the method and the practical aspects required to carry out intensity decay, i.e., lifetime measurements on a modern frequency domain fluorometer. Several chemical/biological systems are utilized to illustrate data acquisition protocols. Data analysis procedures and methodologies are also discussed.
Key words
Frequency domain fluorometryMultifrequency phase-modulation fluorometryEthidium bromidetRNAPhasor plotHuman serum albumin (HSA)1 Introduction
Fluorescence spectroscopy has proven to be an extremely valuable tool in a wide variety of fields ranging from biology to chemistry as well as medical diagnostics and material sciences. Its usefulness stems from the detailed information available from multiple fluorescent parameters, i.e., emission spectra, excitation spectra, polarizations/anisotropies, lifetimes, and quantum yields. While knowledge of all these fluorescent properties is important to fully understand the processes being investigated, the focus of this review is on time-resolved measurements, in particular intensity decay or lifetime measurements.
The absorption of light generates an excited state within femtoseconds and deactivation typically occurs on the order of picoseconds to tens of nanoseconds depending on the fluorophore and its surroundings. The newly generated population of photoexcited molecules decays exponentially from the S1 electronic excited state (usually, although some exceptions exist) through emission of a photon, though other non-radiative processes usually deactivate the excited state also. The time it takes for the number of excited molecules to decay to 1/e of the excited state population is defined as the excited state lifetime, τ, and is unique to a given molecule in a given environment [1]. This environmental sensitivity is one reason why the excited state lifetime is an important fluorescent property. Two principle methods, namely, frequency domain and time domain, are presently used to obtain time-resolved information. This chapter discusses the frequency domain method only and focuses specifically on data acquisition and analysis of intensity decay, i.e., lifetime data. We also describe practical aspects of the frequency domain method, also known as multifrequency phase and modulation fluorometry, by describing measurements on a simple fluorophore in solution (fluorescein), protein fluorescence (human albumin serum), and a ligand binding system (ethidium bromide-tRNA).
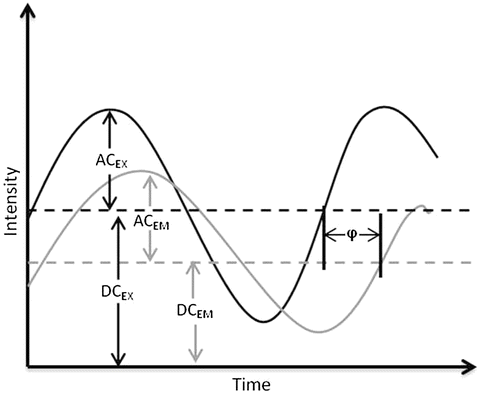
The first accurate frequency domain lifetime measurements were realized by Enrique Gaviola in 1926 [2, 3], while the mathematical theory behind frequency domain fluorometry was first described by Dushinsky in 1933 [4]. Dushinsky determined that a fluorophore, with a single exponential excited state decay time, τ, excited by light sinusoidally modulated at high frequencies, E(t), emits light, F(t), sinusoidally modulated at the same angular frequency, ω (equal to 2πf, where f is the linear light modulation frequency), as the exciting light, but delayed in phase (φ) and demodulated as depicted in Fig. 1 and expressed as:


Fig. 1
Schematic representation of sinusoidally modulated exciting light (black) and the resulting sinusoidally modulated fluorescence (grey) delayed in phase and demodulated

(1)
The relative modulation of the emission, M, is given by the ratio of the AC/DC components for the exciting, M E, and emitted light, M F:


(2)

(3)
The correlation between the phase delay, modulation, and excited state lifetime is given by:


where τ p and τ m are independently determined and represent the phase and modulation lifetimes, respectively. For systems characterized by a single exponential decay, the phase and modulation lifetimes are identical and are independent of the light modulation frequency. For more complex systems with multiple fluorescing species, τ p is less than τ m and both are dependent upon the modulation frequency. In 1969, Weber and Spencer [5] described a frequency domain fluorometer which utilized the principle of cross-correlation, wherein the light source (in their case a xenon arc passing through a Debye-Sears light modulation tank) was modulated at one frequency, while the detector was modulated at a slightly different frequency. The “cross-correlation” frequency was typically low (about 40 Hz) such that a low-frequency signal could be isolated, which was far easier to work with than the original high frequencies. In this instrument only two light modulation frequencies were available. In 1983, Enrico Gratton introduced a true multifrequency fluorometer by passing laser light (originally an argon ion laser) through a Pockels cell [6]. Table 1 gives an example of τ p and τ m determined for a solution containing two components of 12.08 and 1.38 ns in the proportions of 53 and 47 % (fractional intensities, i.e., contributions to the total intensity), respectively. These differences between τ p and τ m, and their frequency dependence, permit one to extract the underlying lifetime components.

(4)

(5)
Table 1
τ p and τ m values obtained for a fluorophore mixture (details in text)
Frequency (MHz) | τ p (ns) | τ m (ns) |
|---|---|---|
5 | 6.76 | 10.24 |
10 | 6.02 | 9.70 |
30 | 3.17 | 6.87 |
70 | 1.93 | 4.27 |
Resolution of the underlying lifetime components in a mixture, and assignment of their relative contributions to the signal, requires fitting the frequency dependence of the phase delay and demodulation to a specific decay scheme (see Note 1). Two commercially available programs for analysis, Vinci Multidimensional Spectroscopy software and Globals for Spectroscopy, will be discussed later in the Analysis section.
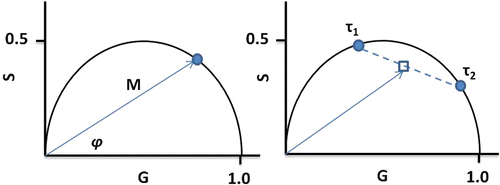
The relationship between S and G provides another way to treat the data known as the phasor method [8]. This model-less approach offers immediate graphical evidence of lifetime heterogeneity as well as possible excited state reactions present in the sample. In recent years, the phasor method has gained in popularity as a tool used in fluorescence lifetime image microscopy (FLIM), but it is also useful in cuvette studies [9–11]. We should also note that this approach was introduced for FLIM studies by several groups who designated the graphs as phasor plots [12], AB plots [13], and polar plots [14]. A plot of S versus G values for a particular modulation frequency is characterized by a vector of length equal to M with an angle from the x-axis equal to φ as shown in Fig. 2. For a system with a single exponential lifetime, the frequency dependence of the vector forms a semicircle with a radius of ½ known as the universal circle. For systems that are multi-exponential, the phasor point is restricted to the inside of the universal circle [9, 10]. Thus, a phasor plot immediately indicates lifetime heterogeneity.


Fig. 2
Phasor plot illustrating the basic concept of a phasor point at one frequency for a system with a single exponential lifetime (left) and for a system with a double exponential lifetime (right)
2 Materials
The frequency domain time-resolved measurements described in this chapter were carried out on a Chronos (ISS, Champaign, IL) frequency domain fluorometer. This instrument is designed to accommodate light-emitting diodes (LEDs), laser diodes (LDs), as well as CW and mode locked lasers. Clearly, the sample under investigation, be it a protein or a simple fluorophore, must be as pure as possible. Equally important, though, is that the reagents used for the lifetime measurements, both sample and reference solvents, must be of the highest possible purity to eliminate errors due to background fluorescence. Solvent impurities should always be checked before measurements (see Note 2). Also, one must keep in mind that additional sample purification may be required, and one should not necessarily trust the purity of commercial compounds. It is important to follow proper protocol for storage, usage, and disposal for all reagents. It is also very important to know the optical transparency of the cuvettes being used. Plastic or glass cuvettes typically absorb light in the near-UV (<330 nm) wavelength range. For UV-visible range experiments, quartz cuvettes are recommended and were utilized for the lifetime experiments described here.
3 Methods
All multifrequency phase and modulation lifetime measurements involve choosing an excitation light source and optical filters, sample preparation, reference preparation, selecting an optimal frequency range, data acquisition, and analysis [8, 15, 16]. Below we have separated each of these required steps for additional discussion and to provide experimental details for the acquisition of lifetimes for three systems, namely, fluorescein in 0.01 M NaOH, intrinsic protein fluorescence (HSA), and EB-tRNA binding. Finally, the notes section provides additional information and nuances one learns with experience.
3.1 Experimental Considerations
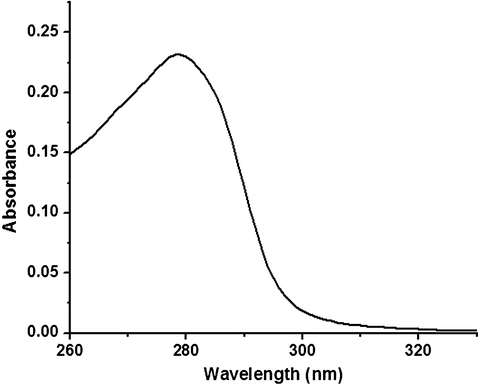
One of the first tasks in any lifetime measurement is choosing the excitation wavelength. The probability of a species to absorb a photon of an appropriate energy to generate an excited state is proportional to the molecular absorption coefficient (extinction coefficient), and hence the absorption spectrum of the sample should be known. For instance, the absorption spectra of HSA in buffered solution displays a prominent absorption band centered near 278 nm, with absorption out to about 315 nm as shown in Fig. 3 (see Note 3). Therefore, an excitation source anywhere from 250 to 315 nm may theoretically be used (see Note 4). Fortunately, with the emergence of light-emitting diodes (LEDs) and laser diodes (LD), the choice of available wavelengths has increased and the costs have decreased. Together, LEDs and LDs provide a wavelength range that spans the entire UV and visible range of the spectrum (see Note 5). Unlike xenon arc lamps and CW lasers implemented in earlier instruments, the input voltage of the LEDs and LDs can be directly modulated [8, 15, 16]. While there are advantages to these types of light sources, LDs and LEDs often emit over a small range of wavelengths and require additional optical components to increase wavelength selectivity. The best types of optical filters to achieve a narrow excitation wavelength range of a few nanometers are interference filters. The narrow wavelength range of interference filters are specified by its wavelength plus the FWHM (full width at half max), i.e., a 300 nm interference filter with FWHM of 5 nm passes 50 % of the laser intensity at 295 and 305 nm as it does at 300 nm. The excitation wavelength, interference filter, and emission filter for the three systems are provided in Table 2 (see Note 6). The “magic angle” conditions [17, 18] for the excitation and emission polarizers are also summarized in Table 2 (see Note 7).


Fig. 3
UV-vis absorption spectrum of 15 μM HSA in 20 mM HEPES, pH 7.2
Table 2
Summary of the light source and instrument configuration for the three example systems
Sample | λ ex (type/ wavelength) | Filter type | Magic angle configuration (excitation/emission) | Frequency range (MHz) |
|---|---|---|---|---|
Fl in 0.1 M NaOH | LED/471 nm | LP 515 nm | 0°/55° | 10–100 |
HSA 20 mM HEPES, pH 7 | LD/300 nm | LP 305 nm | –/35° | 10–150 |
EB-tRNA | LED/471 nm | LP 525 nm | 0°/55° | 1–100 |
3.1.1 Sample Preparation
As already mentioned, optical grade solvents and highest purity compounds are required for reliable lifetime data. All experiments described here were performed in a 1 cm cuvette with a final volume of 2 mL. Fluorescein was purchased from Invitrogen and used without further purification. HSA was purchased from Sigma and purified according to the protocol described in the review by James et al. [10]. Yeast tRNA and ethidium bromide solution (10 mg/mL) were purchased from Invitrogen. Table 3 is a complete summary of the sample preparations.
Table 3
Summary of the sample preparations for the three example systems
Sample | Solvent | Temperature (°C) |
|---|---|---|
500 nM Fl | 0.01 aqueous NaOH | 25 |
60 μM HSA | 20 mM HEPES, pH 7.0 | 20 |
1 μM EB | 20 mM HEPES, 2 mM MgCl2, 0.1 mM EDTA, 100 mM KCl, pH 7.0 | 25 |
1 μM EB, 4.0 μM tRNA | 20 mM HEPES, 2 mM MgCl2, 0.1 mM EDTA, 100 mM KCl, pH 7.0
Stay updated, free articles. Join our Telegram channel
Full access? Get Clinical Tree
 Get Clinical Tree app for offline access

|


