Flow Cytometry
As discussed in Chapter 6, immunophenotyping is a key component of the World Health Organization (WHO) lymphoma classification and is necessary for the diagnosis of most specific lymphoma entities (1). Some lymphoma types have a characteristic immunophenotype, and recognition of this immunophenotype in the appropriate clinical and morphologic context strongly supports the diagnosis. Immunophenotype is also essential in the differential diagnosis of morphologically similar entities. In this chapter, we discuss flow cytometry as a diagnostic tool, focusing primarily on its role in immunophenotyping. It is important to remember, however, that flow cytometry can be used for other purposes and, at the end of this chapter, we briefly discuss its role in DNA ploidy and S-phase analysis.
Advantages of Flow Cytometry for Immunophenotypic Analysis
Flow cytometry has distinct advantages when compared to competing methods of immunophenotyping, in particular, immunohistochemistry. The most important advantages are listed here.
Flow cytometry allows for simultaneous analysis of a number of antigens. Currently, in clinical flow cytometry laboratories, at least three fluorochromes per test tube are used routinely, following the recommendations of a consensus conference (2). This allows the simultaneous analysis of at least three antigens on a cell population. Combined with side and forward light scatter, five parameters are assessed simultaneously. The ability to assess multiple antigens simultaneously allows one to define and characterize cell populations reliably. Furthermore, the trend is to increase the capacity of flow cytometers to analyze more antigens simultaneously. One clinical laboratory is currently using nine or 10 antibodies to simultaneously analyze cell populations; this approach identifies cell populations even more reliably while at the same time improving laboratory efficiency (3).
Flow cytometry has the capacity to analyze extremely large numbers of cells. In many laboratories, 106 cells per test tube are stained with various antibody combinations and 10,000 to 30,000 events are acquired and analyzed. However, if the application is the detection of minimal residual disease, a much greater number of cells can be acquired for analysis.
Flow cytometry is a highly sensitive technique. Cells with an aberrant immunophenotype can be detected with a sensitivity ranging from 1 in 103 to 1 in 104 cells (4).
Flow cytometry is quantitative, allowing the determination of the density of surface antigen being expressed. Low- or high-density antigen expression are referred to as “dim” and “bright,” respectively. In the evaluation of clinical specimens involved by leukemias and lymphomas, intensity of antigen expression, as well as presence or absence of antigen, is helpful in diagnosis.
Flow cytometry immunophenotypic analysis allows for the use of a greater library of antibodies compared to immunohistochemistry, particularly when using routinely processed tissue sections.
Flow cytometry immunophenotyping is a highly flexible approach. It is relatively easy to mix and match antibodies for analysis based on the suspected diagnosis or the specific application (e.g., de novo diagnosis versus detection of minimal residual disease).
Flow cytometry has a rapid turnaround time, usually being completed within a few hours. In addition, turnaround time is not dependent, for the most part, on the number of antibodies used in the analysis. The time required for the assessment of many antibodies versus only a few is not substantially different.
As compared to immunohistochemistry, flow cytometry has relatively few disadvantages; these are discussed in more detail in Chapter 6. A major disadvantage of flow cytometry immunophenotyping is that it requires viable cells for analysis. This excludes all samples that have been routinely processed, as well as fresh tissue specimens in which the cells are poorly viable (e.g., infarcted neoplasms). A second major disadvantage of flow cytometry is that one cannot directly observe the cell population being immunophenotyped. This is particularly true when examining a tissue biopsy specimen (as compared with fluid specimen) because the lymph node architecture must be destroyed to create a cell suspension. Examination of the cell-suspension cytospin being analyzed by flow cytometry can be helpful in lieu of directly observing the architectural context of the specimen, but this approach is not always reliable.
Indications for Flow Cytometric Analysis of Hematologic Neoplasms
Flow cytometry excels in the following applications:
Diagnosis of hematologic neoplasms. Typically, this is achieved by detecting an aberrant immunophenotype or monoclonal immunoglobulin (Ig) light-chain expression in mature B-cell leukemias and lymphomas.
Classification of hematologic neoplasms. Determining the lineage and maturational stage of hematologic neoplasms is essential for classification.
Assessment of minimal residual disease after therapy. The ability of flow cytometry to sensitively assess multiple antigens on a cell population makes it an excellent method for this purpose. Greatest sensitivity of detection by flow cytometry can be achieved when a neoplasm is known to have an aberrant immunophenotype and the antibody panel is tailored to optimally assess this population. However, the immunophenotype of neoplastic cells is not always stable, and this must be accounted for in the analysis.
Assessment for minimal disease in staging specimens. Perhaps the best example of this indication is staging bone
marrow specimens in patients with malignant lymphoma. It is not infrequent for flow cytometry to identify a small monoclonal B-cell population in patients with no histologic evidence of bone marrow involvement. Kaleem has estimated that flow cytometric analysis of the bone marrow aspirate material will upstage approximately 5% of patients with lymphoma (7). In our experience, the lymphoma cell population identified by flow cytometry often represents 1% or less of all cells in the specimen assessed. The clinical significance of this finding is currently uncertain. Some argue that flow cytometry analysis allows for more sensitive and definitive assessment of the bone marrow and therefore more reliable staging of the patient (7). However, clinical guidelines for staging have taken the position that a positive flow result, without histologic confirmation, should not be considered definitely positive for staging purposes (8,9). Studies must be performed to assess the prognostic impact of minimal involvement of the bone marrow detected by flow cytometry immunophenotyping.
Assessment of biologic markers important for prognosis. The most common markers in this category are various antigens whose expression is associated with prognosis. A good example is the relatively recent discovery that expression of CD38 and ZAP-70 in chronic lymphocytic leukemia/small lymphocytic lymphoma (CLL/SLL) correlates with unmutated Ig genes and worse prognosis. DNA content analysis and tumor proliferation rate, the latter assessed by quantifying the cells in S phase of the cell cycle, also can be included in this indication. Aneuploid DNA content has been shown to have prognostic significance in patients with precursor B-cell acute lymphoblastic leukemia (10) and plasma cell myeloma (11).
Detection of targets of therapy. Various monoclonal antibody therapies are available, and detection of their targets on the neoplastic cells is an important part of the workup of hematologic neoplasms. Examples of targets that correspond to currently available therapies include CD20, CD25, CD22, CD33, and CD52. The number of targets is increasing.
Flow Cytometry Methods
A detailed description of flow cytometry instrumentation and methods is beyond the scope of this chapter, and the reader is referred to various textbooks. Here, some of the essential concepts underlying flow cytometric immunophenotypic analysis are described briefly.
Flow cytometers have five major components: a monochromatic light source (usually a laser), an optical system that focuses the light source on the sample stream, a fluidics system designed to transport the sample in laminar flow through the light source, an electronic system that converts light impulses into digital signals, and a powerful computer system that allows data acquisition, storage, and analysis. Flow cytometers used currently in clinical laboratories have multiple lasers/light sources.
To perform flow cytometry immunophenotyping, the cells in a sample must be prepared and stained. If peripheral blood or bone marrow aspirate specimens are being examined, erythrocytes can interfere with analysis and must be removed. Most commonly, erythrocytes are removed by whole blood lysis techniques using ammonium chloride or commercially available reagents. Historically, the Ficoll-Hypaque gradient separation technique was used for this purpose. However, Ficoll-Hypaque separation is time consuming, alters the ratios of various leukocyte subsets in a sample, and allows for poor recovery when applied to bone marrow specimens. If a tissue biopsy specimen is being studied, a cell suspension must first be prepared, usually by initially placing the tissue specimen in media, then manually mincing the tissue gently to prevent excessive destruction of cells in the sample.
After the cells are aliquoted into test tubes—routinely 106 cells per tube—the cells are stained with antibodies conjugated to fluorochromes. Either direct or indirect staining can be performed. Direct staining requires that the antibody being used be directly conjugated to a fluorochrome. This approach is generally preferred because of speed and convenience. Currently available reagents include single antibodies as well as various antibody combinations conjugated to a number of fluorochromes that can be combined in an almost limitless number of combinations. Indirect staining is a two-step approach in which the cells are first incubated with a primary antibody, usually a mouse monoclonal, then subsequently incubated with a second anti-mouse antibody conjugated with a fluorochrome. Following staining, the cells are usually fixed (e.g. using a very low concentration of formaldehyde), which stabilizes specimen stability and antibody binding and therefore allows greater flexibility in analyzing the specimen. Staining also reduces the biohazard risks.
Fluorochromes absorb light from the light source at incident wavelength and then emit light at a longer wavelength specific for the fluorochrome. When multiple fluorochromes are being used simultaneously, the ideal is to select fluorochromes with distinct emission spectra. A group of these fluorochromes has been developed and standardized. In addition, some fluorochromes can be linked to create unique emission spectra. These emission spectra are referred to as colors. Thus, the use of one, two, or three fluorochromes is referred to as one-, two-, or three-color analysis. The greater the number of colors, the greater the number of antigens that can be assessed simultaneously in a selected cell population.
Independent of the light emitted from the fluorochromes, the light source becomes scattered as the cells in a sample pass through the instrument. This light scatter provides for two more parameters that can be used in analysis, known as forward scatter and side scatter. Light scattered in the forward direction is proportional to cell size. Light scattered orthogonally, or to the side, is proportional to cellular internal complexity (which includes granularity). The combination of light scatter with specific emission spectra from various fluorochromes can be used in gating strategies.
A number of gating strategies can be employed. The ideal of any gating strategy is to select a pure population of cells for analysis. A pure gate allows the flow cytometrist to know exactly which cells are being analyzed. Historically, the analysis gate of lymph node specimens for lymphoma was selected by initially examining a two-dimensional plot of side scatter versus forward scatter. The events with the greatest forward and lowest side scatter, consistent with lymphocytes, were then selected for analysis. Currently, in most clinical laboratories, analysis gating is usually done using a combination of CD45 and side scatter (12,13). A two-dimensional plot using these parameters shows distinct clusters of events that correspond to granulocytes, monocytes, and lymphocytes, and also shows a distinct area where blasts appear in the analysis of bone marrow specimens. This allows the flow cytometrist to select a discrete and relatively pure population of cells for analysis. The disadvantage to analysis gating is that the data generated are based only on the population of cells gated. In other words, not all events are analyzed. An alternative method is to use strategies such as Paint-a-Gate, in which every event positive for a specific marker is analyzed. This is a much more complete analysis but also more time consuming to perform and analyze. In our experience in a high-volume clinical laboratory, a hybrid approach is most practical. Analysis gating is done routinely on clinical specimens, then Paint-a-Gate is done on those selected samples for which it is necessary.
How Many Fluorochromes (Colors) are Needed for Analysis?
The current recommendation is that flow cytometry immunophenotyping be performed using three fluorochromes, allowing five-parameter analysis (three colors plus forward and light scatter). In our routine clinical laboratory, we currently use four colors. The trend is to continue to increase the number of colors used in flow cytometry analysis, and recently, six-color flow cytometers have become commercially available.
The clinical flow cytometry laboratory at the University of Washington in Seattle is currently using nine- and 10–color analysis (3). To achieve this approach, flow cytometers were custom-built for this purpose by Becton-Dickinson (San Jose, CA). As reviewed by Brent Wood, the number of colors adequate to immunophenotype a specific cell populations depends, in part, on the objective. If a homogeneous population of cells is being analyzed, with the question being a simple determination of the immunophenotype, theoretically one-color flow cytometry analysis can be sufficient. This is, in fact, how flow cytometry immunophenotyping was first applied in the clinical setting, in the analysis of leukemias. In a patient with CLL/SLL, for example, in whom the leukocyte count is elevated and almost all cells in the sample analyzed are neoplastic lymphocytes, results expressed as percentages can be easily interpreted. Many of our clinical colleagues still retain this appreciation for the percentages. However, this approach does not take into consideration practical laboratory issues, such as the number of tubes required for analysis, acquisition and analysis time, and other parameters. As the goals of immunophenotypic analysis become more ambitious or complex, and as the cell population in the sample becomes more heterogeneous, flow cytometry immunophenotyping requires multicolor analysis. In the typical analysis of a case of acute leukemia, in which immunophenotype is unknown a priori, a large number of antibodies must be assessed to determine lineage and stage of maturation. For this goal, multicolor flow cytometry immunophenotypic analysis is ideal. Furthermore, the sensitivity currently achievable using multicolor analysis cannot be replicated using one or two colors. Thus, the assessment of minimal residual disease is not possible without multicolor analysis.
Nine- or 10–color flow cytometry immunophenotyping has a number of advantages, including (a) increased specificity and sensitivity; (b) very small-volume or low cellularity specimens (e.g., cerebrospinal fluid) can be analyzed more efficiently and completely; (c) fewer test tubes can be used for analysis; (d) with smaller specimens and less tubes, the time saved can be used to analyze a greater number of events per test tube; and (d) standardization may be improved. Using a large number of colors obviates the need to argue over which three-color reagent, or mixture of three-color reagents, is best for analysis of a specific specimen (3).
Data Interpretation: More Than Just Numbers
The data derived from flow cytometry immunophenotypic analysis are not simply lists of the percentages of cells positive for each antibody assessed (4,14,15). The patterns obtained using this method provide much additional data, and it cannot be overemphasized that the interpretation of flow cytometry data is, in fact, a practice of pattern recognition. This pattern is created by the number of cells positive for a given marker, the intensity of expression of that marker, the characteristics of each cell in the population being examined, and the forward scatter and side scatter properties of the cells being examined. As a result, the ideal reporting of flow cytometry data should be, in large part, descriptive. It should include conclusions about the expression of each marker by the cells being analyzed (e.g., positive or negative) as well as a statement regarding intensity of immunofluorescence as a measure of antigen density (e.g., dim, moderate, or bright), the cell size based on light scatter characteristics (e.g., small versus large), and the overall percentage of neoplastic cells in the sample. In some instances, only a subset of the neoplastic cells are positive for a specific marker, and this also should be specified. Pertinent negatives should be included in the diagnostic line as well. Thus, a typical report for a case of CLL/SLL might read as follows: a monotypic B-cell population is identified positive for Igλ (dim), CD5, CD19, CD20 (dim), CD23, and negative for CD3, CD10, CD38, ZAP-70, and FMC-7.
B-Cell Clonality
As discussed in Chapter 6, the assessment of Ig light chain expression is one of the most useful methods for determining the presence of a monoclonal B-cell population. Mature B-cells express surface membrane-bound Ig composed of heavy and light chains (16). Based on the principle of allelic exclusion, an individual B cell synthesizes either κ or λ light chain. If a B-cell population being analyzed expresses only κ or λ, the cell population is monoclonal, and monoclonality correlates strongly with B-cell lymphoma or leukemia. In contrast, a mixture of B cells expressing κ and λ is polyclonal, and polyclonality correlates strongly with a benign process. In healthy persons, the κ-to-λ ratio in peripheral blood and bone marrow specimens is in the range of 0.5 to 3.0, and in lymph node specimens the κ-to-λ ratio is higher in germinal centers (1.1 to 3.1) than it is in mantle zone cells (1.0 to 2.2) (17,18,19).
Using multicolor flow cytometry immunophenotyping for measuring the κ-to-λ ratio has many advantages over immunohistochemistry. Flow cytometry can easily analyze far greater numbers of cells and is much more quantitative (3,4,7). Simultaneous assessment of Ig with other antigens, such as a pan–B-cell marker (e.g., CD19) or a B-cell subset antigen (e.g., CD10) improves the sensitivity and specificity of the analysis by focusing on the B-cell population of interest, and also eliminates any background staining of monocytes. The latter can nonspecifically bind surface Ig via their Fc receptors (4,7) (Fig. 7.1). Visual inspection of two-dimensional plots or calculating simple κ-to-λ ratios is usually adequate to distinguish monoclonal from polyclonal B-cell populations. By transforming all κ-to-λ ratios to maximum ratios—that is, Rmax = max (κ/λ, λ/κ)—so that all resulting ratios have a value of at least 1, surface Ig light chain data can be used to establish a laboratory range for improving quality assurance and comparing results between laboratories (20) (Fig. 7.2).
The Kolmogorov-Smirnov statistical test also can be used to determine B-cell clonality; this test analyzes differences in the fluorescence curve shape and peak position attributable to Ig expression (21). Essentially, Ig light chains expressed by monoclonal B-cells more exactly resemble each other than Ig light chains of the same type expressed by polyclonal B-cells.
With the well established use of κ-to-λ light chain ratios for diagnosis, it is somewhat surprising that cutoffs that distinguish monoclonal from polyclonal B-cell populations are less well established. Iancu and colleagues (22) reviewed the literature and found that cutoffs ranging from 1.4 to 6.0 have been suggested as reliable for distinguishing monoclonal from polyclonal B cells. Furthermore, both symmetric or paired (e.g., κ-to-λ 3:1 or 1:3) and asymmetric or unpaired (e.g., κ-to-λ 4:1 or 1:3) have been proposed. In part, this is similar to many other clinical laboratory tests in which the cutoff chosen is a balance between sensitivity and specificity; increasing
sensitivity is associated with decreasing specificity and vice versa. The study by Iancu et al. (22) illustrates these tradeoffs (Tables 7.1 and 7.2). They chose the asymmetric κ-to-λ cutoffs of 4:1 and 1:3 (0.33) because these were thought to yield the best combination of sensitivity and specificity. However, the optimal Ig light chain ratio must be determined in each clinical laboratory.
sensitivity is associated with decreasing specificity and vice versa. The study by Iancu et al. (22) illustrates these tradeoffs (Tables 7.1 and 7.2). They chose the asymmetric κ-to-λ cutoffs of 4:1 and 1:3 (0.33) because these were thought to yield the best combination of sensitivity and specificity. However, the optimal Ig light chain ratio must be determined in each clinical laboratory.
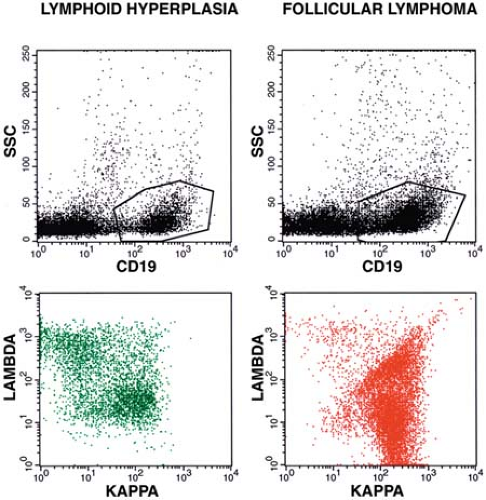 Figure 7.1. Lymphoid hyperplasia (LH) versus follicular lymphoma (FL). In LH, gating the CD19+ B cells (upper left) reveals a polyclonal population of κ+ and λ+ cells (lower left). In FL, gating the CD19+ B cells (upper right) reveals a monoclonal population of κ+ cells (lower right). The prominent diagonal population probably represents serum immunoglobulin (κ+ and λ+) nonspecifically bound by Fc receptors on FL B cells (lower right). SSC, side scatter (right-angle light scatter). |
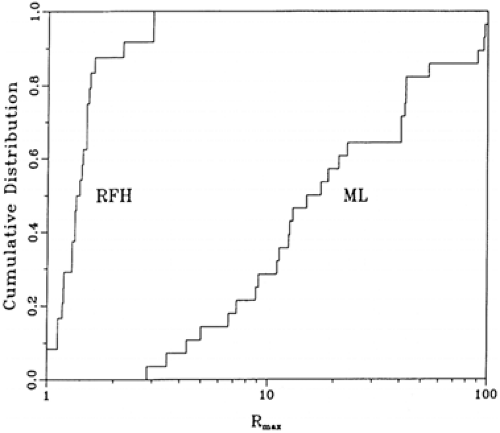 Figure 7.2. Cumulative distribution of Rmax values of reactive follicular hyperplasia (RFH) and B-cell malignant lymphoma (ML). This is a statistic for evaluating surface immunoglobulin light chain restriction by transforming all κ-to-λ ratios to maximum ratios—that is, Rmax = max (κ/λ, λ/κ). All resulting ratios have a value of at least 1. (From Ratech H, Litwin S. Surface immunoglobulin light chain restriction in B-cell non-Hodgkin malignant lymphomas. (From Ratech H, Litwin S. Surface immunoglobulin light chain restriction in B-cell non-Hodgkin’s malignant lymphomas [published erratum appears in Am J Clin Pathol 1989;92:560]. Am J Clin Pathol 1989;91:583–586, with permission.)
Stay updated, free articles. Join our Telegram channel
Full access? Get Clinical Tree
 Get Clinical Tree app for offline access

|